Archive for Energy – Page 15

Will price caps on coal and gas bring power prices down? An expert isn’t so sure

By Bruce Mountain, Victoria University 

In a bid to arrest escalating power prices, Australia’s federal, state and territory governments have agreed to impose caps on the wholesale price of coal and gas.

Announcing the decision after National Cabinet met on Friday, Prime Minister Anthony Albanese said parliament would be recalled next week to pass the necessary legislation. He indicated there was enough crossbench support for this to be a formality.

There will also be $1.5 billion to subsidise electricity bills for households and small businesses. This will be administered by state and territory governments starting in April 2023, and for households it will be subject to means tests.

For the next year, coal used in Australia cannot be sold in wholesale markets for more than $125 a tonne. Gas used in Australia cannot be sold in wholesale markets for more than $12 a gigajoule.

At the time of writing, the short-term (spot) market price for coal at the Newcastle export terminal was $580 a tonne. Gas could be bought at the Wallumbilla hub near Brisbane for $22 a gigajoule.

With such a big gap between spot coal and gas prices and the announced caps, can we expect much lower gas and electricity prices?

In short, maybe or maybe not.

The aphorism “the devil is in the detail” is made for questions like this. This is because of the complex ways domestic coal and gas markets are linked to export markets, how supplies are contracted, and the lack of publicly available information on supply and demand in these markets.

Effect on coal price

The majority of Australia’s coal-fired electricity generators get their coal from nearby mines. Much of this coal cannot be exported, either because of its low quality (such as the brown coal of Victoria’s Latrobe Valley) or because the transport infrastructure doesn’t exist.

This “mine mouth” coal is therefore unaffected by export prices. Its price is based on extraction and delivery costs, plus a margin (of course). In all cases this is well below the $125 per tonne cap.

There are exceptions. Two of Queensland’s eight coal-fired generators – the government-owned Stanwell and the privately owned Gladstone – are supplied by mines able to divert some coal to export markets.

In NSW, coal from most of the mines that supply the state’s six coal-fired stations can, to varying degrees, be diverted. But much of this supply is already contracted for years ahead, so the export price is unlikely to be an accurate estimate of the price power stations will pay.

As best we know, only the Eraring station, near Newcastle in NSW’s Hunter region, is currently paying a price higher than the cap.

In the National Energy Market covering eastern Australia the price of the most expensive generator sets the price all generators receive. The coal price cap is therefore likely to make a difference to wholesale electricity prices when the Eraring power station is setting the market price.

This happens about 30% of the time, according to the publicly available data. So capping the coal price Eraring will pay much below what it is now paying could have a big effect on electricity prices.

But there’s a caveat. How will Eraring’s coal supplier respond?

Will it continue to supply coal at the lower capped price? Or will it decide to divert that coal to more lucrative export markets?

If the former, we can reasonably say the cap will reduce electricity prices.

If the latter, we could potentially be facing a supply crisis, with much higher electricity prices. If Eraring, the largest generator in eastern Australia, sits idle for want of coal to burn, more expensive gas generators (if available) will have to take its place.

Effects on gas price

What about gas? It’s a similar story to coal, although diverting gas to the export market is easier than for coal (because gas is much easier to move than coal and the pipeline network is much more extensive than the coal freight network).

As a result, domestic spot gas prices are more closely linked to export prices.

Like the coal price cap, the gas price cap is much lower than spot gas price. So the question is whether gas suppliers will sell uncontracted gas at the capped price, or politely decline.

The government hopes the Heads of Agreement with gas suppliers will ensure supply. It remains to be seen whether such a deal will ensure supply at a much lower price than we see in the gas markets today, at least for spot market purchases.

Imperfect information

None of this is to suggest the decision to impose price caps is necessarily flawed.

I do not have the necessary information about the existing situation, or accurate foresight of what lies ahead, to pass a categorical judgement. Presumably neither do any of our governments. None of us can confidently predict success or failure.

At the media briefing to announce the policy, Albanese was asked to quantify the effect on prices. He wisely refused to name a number, but insisted the policy would place “downward pressure” on prices. Presumably the government intends that the rebates (to be funded by federal taxpayers and the jurisdictions) will kick in if the wholesale caps don’t work as hoped.

Are there obviously better solutions?

Orthodox economists would suggest these challenges should be handled outside the market (for example through coal and gas export taxes, which would provide income to bail out exposed customers).

Sounds easy, but here too many devils lurk in the details.The Conversation

About the Author:

Bruce Mountain, Director, Victoria Energy Policy Centre, Victoria University

This article is republished from The Conversation under a Creative Commons license. Read the original article.


How do floating wind turbines work? With 5 companies winning the first US leases to build wind farms off California’s coast, let’s take a look

By Matthew Lackner, UMass Amherst 

Northern California has some of the strongest offshore winds in the U.S., with immense potential to produce clean energy. But it also has a problem. Its continental shelf drops off quickly, making building traditional wind turbines directly on the seafloor costly if not impossible.

Once water gets more than about 200 feet deep – roughly the height of an 18-story building – these “monopile” structures are pretty much out of the question.

A solution has emerged that’s being tested in several locations around the world: wind turbines that float.

In California, where drought has put pressure on the hydropower supply, the state is moving forward on a plan to develop the nation’s first floating offshore wind farms. On Dec. 7, 2022, the federal government auctioned off five lease areas about 20 miles off the California coast to companies with plans to develop floating wind farms. The bids were lower than recent leases off the Atlantic coast, where wind farms can be anchored to the seafloor, but still significant, together exceeding US$757 million.

So, how do floating wind farms work?

Three main ways to float a turbine

A floating wind turbine works just like other wind turbines – wind pushes on the blades, causing the rotor to turn, which drives a generator that creates electricity. But instead of having its tower embedded directly into the ground or the seafloor, a floating wind turbine sits on a platform with mooring lines, such as chains or ropes, that connect to anchors in the seabed below.

These mooring lines hold the turbine in place against the wind and keep it connected to the cable that sends its electricity back to shore.

Most of the stability is provided by the floating platform itself. The trick is to design the platform so the turbine doesn’t tip too far in strong winds or storms.

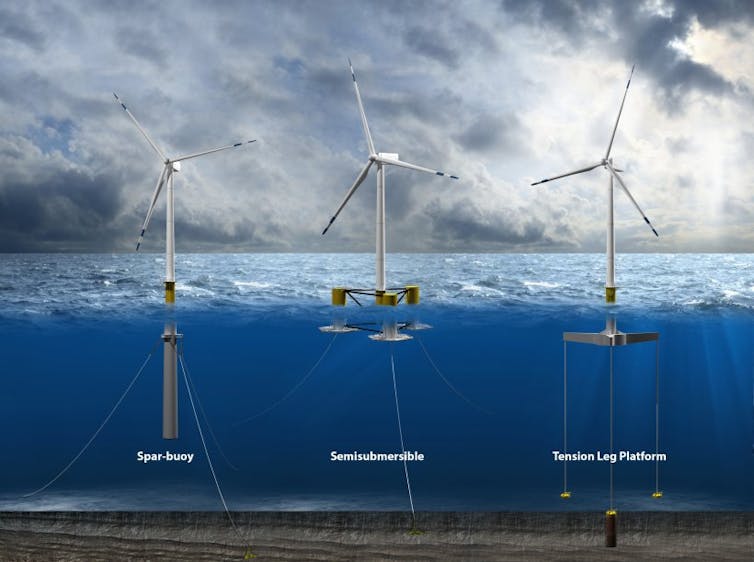
An illustration of each in an ocean, showing how lines anchor it to the seafloor.
Three of the common types of floating wind turbine platform.
Josh Bauer/NREL

There are three main types of platforms:

  • A spar buoy platform is a long hollow cylinder that extends downward from the turbine tower. It floats vertically in deep water, weighted with ballast in the bottom of the cylinder to lower its center of gravity. It’s then anchored in place, but with slack lines that allow it to move with the water to avoid damage. Spar buoys have been used by the oil and gas industry for years for offshore operations.
  • Semisubmersible platforms have large floating hulls that spread out from the tower, also anchored to prevent drifting. Designers have been experimenting with multiple turbines on some of these hulls.
  • Tension leg platforms have smaller platforms with taut lines running straight to the floor below. These are lighter but more vulnerable to earthquakes or tsunamis because they rely more on the mooring lines and anchors for stability.

Each platform must support the weight of the turbine and remain stable while the turbine operates. It can do this in part because the hollow platform, often made of large steel or concrete structures, provides buoyancy to support the turbine. Since some can be fully assembled in port and towed out for installation, they might be far cheaper than fixed-bottom structures, which require specialty vessels for installation on site.

Floating platforms can support wind turbines that can produce 10 megawatts or more of power – that’s similar in size to other offshore wind turbines and several times larger than the capacity of a typical onshore wind turbine you might see in a field.

Why do we need floating turbines?

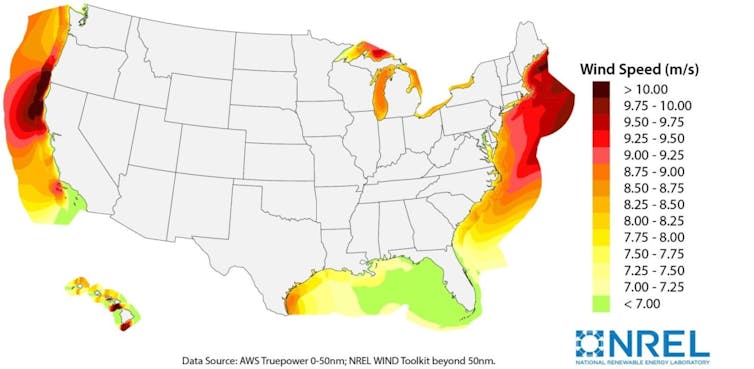
Some of the strongest wind resources are away from shore in locations with hundreds of feet of water below, such as off the U.S. West Coast, the Great Lakes, the Mediterranean Sea and the coast of Japan.

Map showing offshore wind potential
Some of the strongest offshore wind power potential in the U.S. is in areas where the water is too deep for fixed turbines, including off the West Coast.
NREL

The U.S. lease areas auctioned off in early December cover about 583 square miles in two regions – one off central California’s Morro Bay and the other near the Oregon state line. The water off California gets deep quickly, so any wind farm that is even a few miles from shore will require floating turbines.

Once built, wind farms in those five areas could provide about 4.6 gigawatts of clean electricity, enough to power 1.5 million homes, according to government estimates. The winning companies suggested they could produce even more power.

But getting actual wind turbines on the water will take time. The winners of the lease auction will undergo a Justice Department anti-trust review and then a long planning, permitting and environmental review process that typically takes several years.

Maps showing the locations off Moro Bay, north of Santa Barbara, and Eureka, near the Oregon border.
The first five federal lease areas for Pacific coast offshore wind energy development.
Bureau of Ocean Energy Management

Globally, several full-scale demonstration projects with floating wind turbines are already operating in Europe and Asia. The Hywind Scotland project became the first commercial-scale offshore floating wind farm in 2017, with five 6-megawatt turbines supported by spar buoys designed by the Norwegian energy company Equinor.

Equinor Wind US had one of the winning bids off Central California. Another winning bidder was RWE Offshore Wind Holdings. RWE operates wind farms in Europe and has three floating wind turbine demonstration projects. The other companies involved – Copenhagen Infrastructure Partners, Invenergy and Ocean Winds – have Atlantic Coast leases or existing offshore wind farms.

While floating offshore wind farms are becoming a commercial technology, there are still technical challenges that need to be solved. The platform motion may cause higher forces on the blades and tower, and more complicated and unsteady aerodynamics. Also, as water depths get very deep, the cost of the mooring lines, anchors and electrical cabling may become very high, so cheaper but still reliable technologies will be needed.

But we can expect to see more offshore turbines supported by floating structures in the near future.

This article was updated with the first lease sale.The Conversation

About the Author:

Matthew Lackner, Professor of Mechanical Engineering, UMass Amherst

This article is republished from The Conversation under a Creative Commons license. Read the original article.


Oil continues to decline. The Bank of Canada has chosen a more aggressive rate hike

By JustMarkets

National Economic Council Director Brian Deese said yesterday that the US economy is resilient despite the Federal Reserve raising interest rates. Brian Deese also added that low credit card delinquencies and mortgage problems point to resilient household balance sheets, while the labor market and savings rates also point to more robust growth. Moreover, he pointed to slowing inflation as a positive sign of healthier economic growth. But at the moment, the Fed is expected to raise rates again at its meeting next week, and that is putting downward pressure on quotes. As the stock market closed Wednesday, the Dow Jones Index (US30) closed at opening levels, while the S&P 500 Index (US500) was down by 0.19%. Technology Index NASDAQ (US100) fell by 0.51% yesterday. All three indices closed negative.

The 2/10 Treasury bond yield curve flipped by 82 basis points, the biggest reversal in 40 years, signaling growing fears of a potential recession.

The Bank of Canada has chosen a more aggressive 50 bps rate hike, though analysts had expected a 25 bps increase. The Bank of Canada’s overnight rate now stands at 4.25%, the highest since 2008. The Bank of Canada and the Reserve Bank of New Zealand currently hold the highest rates of the major economies. The statement indicates that inflation growth has been more robust than expected, while Canada’s labor market remains “tight” and the economy continues to operate in excess demand. The Bank of Canada plans a final 25 basis point hike early next year and will take a long pause after that. The next meeting is scheduled for January 25.

Equity markets in Europe were mostly down yesterday. German DAX (DE30) decreased by 0.57%, French CAC 40 (FR40) fell by 0.41%, Spanish IBEX 35 (ES35) was down by 0.50%, British FTSE 100 (UK100) closed on Wednesday with minus 0.43%.

European Central Bank Governing Council spokesman Peter Kazimir expressed support for a third straight 75 basis point interest rate hike next week. While the slowdown to 10% in November is welcome, it is too early to declare that the worst of the unprecedented price spike is over, Kazimir said in an interview. According to him, any recession in the eurozone is likely to be short, and inflation will remain above the target level even in 2025. In addition to interest rates, officials will also discuss how to begin writing off about 5 trillion euros ($5.3 trillion) worth of bonds bought in recent years as part of stimulus measures, a process known as quantitative tightening (QT).

The UK and US are forming a new energy partnership aimed at improving energy security and lowering prices. The new partnership will stimulate work to reduce global dependence on energy exports from Russia, stabilize energy markets, and increase cooperation on energy efficiency, nuclear power, and renewable energy. As part of this, the US will export at least 9 to 10 billion cubic meters of LNG over the next year through British terminals, more than double the level exported in 2021.

China seems to have loosened its zero COVID policy considerably, but US crude reserves showed a huge increase in petroleum products, which outweighs the country’s weekly crude consumption. Crude oil inventories were down by 5.187 million barrels, compared to expectations of a 3.305 million barrel decline. That sent crude oil prices down for the fourth straight day, near a yearly low. January WTI crude oil fell by 3% to $72 a barrel. Brent crude oil fell by 2.8% to $77.11/bbl in London trading.

Asian markets were mostly down yesterday. Japan’s Nikkei 225 (JP225) decreased by 0.72%, Hong Kong’s Hang Seng (HK50) was 3.22% lower, and Australia’s S&P/ASX 200 (AU200) was 0.85% lower.

Asian markets were mostly down yesterday. Japan’s Nikkei 225 (JP225) gained 0.24%, Hong Kong’s Hang Seng (HK50) ended the day down by 0.40%, and Australia’s S&P/ASX 200 (AU200) fell by 0.47%.

China on Wednesday announced its biggest easing of COVID restrictions, lifting several travel restrictions and testing mandates. The move sparked some gains in Asian markets in the previous session. But with China still struggling with a record-high daily increase in COVID-19 cases, investors remain uncertain as to when Beijing will announce a full opening.

Japan’s economy shrank at an annualized rate of 0.8% in real terms in the last quarter, down from 1.2% last quarter. Inflation-adjusted real gross domestic product shrank by 0.2% on a quarterly basis. The country recorded an unexpected current account deficit in the third quarter on the back of lower exports and more expensive imports.

S&P 500 (F) (US500) 3,933.78 −7.48 (−0.19%)

Dow Jones (US30) 33,596.87 +0.53 (+0.02%)

DAX (DE40) 14,261.19 −82.00 (−0.57%)

FTSE 100 (UK100) 7,489.19 −32.20 (−0.43%)

USD Index 105.15 -0.43 (-0.41%)

Important events for today:
  • – Japan GDP (q/q) at 01:50 (GMT+3);
  • – Eurozone ECB President Lagarde Speaks at 14:00 (GMT+3);
  • – US Initial Jobless Claims (w/w) at 15:30 (GMT+3);
  • – US Natural Gas Storage (w/w) at 17:30 (GMT+3).

By JustMarkets


This article reflects a personal opinion and should not be interpreted as an investment advice, and/or offer, and/or a persistent request for carrying out financial transactions, and/or a guarantee, and/or a forecast of future events.

Murrey Math Lines 02.12.2022 (Brent, S&P 500)

By RoboForex.com

BRENT

On H4, the quotes are under the 200-day Moving Average, which indicates the prevalence of a downtrend. The RSI has broken through the ascending trendline downwards. Hence, we should expect a test of 3/8 (84.38), a breakaway of it, and falling to the support level of 2/8 (81.25). The scenario can be cancelled by rising over the resistance level of 4/8 (87.50). In this case, the quotes may rise to 5/8 (90.62).

BRENTH4
Risk Warning: the result of previous trading operations do not guarantee the same results in the future

On M15, further decline of the price can be signaled by a breakaway of the lower line of VoltyChannel.

BRENT_M15
Risk Warning: the result of previous trading operations do not guarantee the same results in the future

S&P 500

On H4, the quotes have broken through the 200-day Moving Average and rest above it, which indicates possible development of an uptrend. The RSI has bounced off the ascending trendline and continues going upwards. Hence, we should expect further growth of the quotes to the nearest resistance level of 3/8 (4218.8). The scenario can be cancelled by a downwards breakaway of the support level of 2/8 (4062.5). This might entail further falling of the quotes to 1/8 (3906.2).

S&P 500_H4
Risk Warning: the result of previous trading operations do not guarantee the same results in the future

On M15, the upper line of VoltyChannel is broken away, which increases the probability of price growth to 3/8 (4218.8) on H4.

S&P 500_M15

Article By RoboForex.com

Attention!
Forecasts presented in this section only reflect the author’s private opinion and should not be considered as guidance for trading. RoboForex LP bears no responsibility for trading results based on trading recommendations described in these analytical reviews.

The Economy May Not Look Good but Oil and Energy Transport Stocks Do

Source: Ron Struthers  (11/29/22) 

Expert Ron Struthers believes consumers are on an unsustainable path of wracking up credit card debt, and it is only a matter of when the economy buckles, meanwhile big profits are being made by tanker companies and oil and gas/energy transmission companies as supplies continue to tighten.

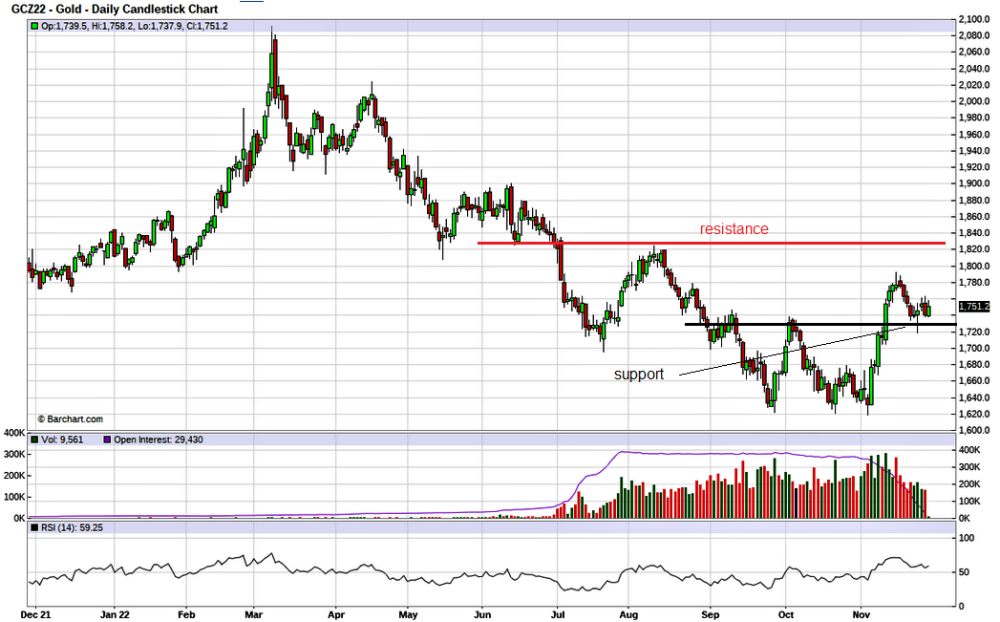
Gold bounced off the US$1730 support area I outlined in my Nov 22, 2022 update. Last week witnessed a hammer candle stick down to US$1720. So far, we are holding above my support level, and my new bull market theory is looking good so far. A break above US$1830 would be a strong sign of a new bull move.
A U.S. consumer confidence survey fell to 100.2 in November and touched the lowest level in four months, reflecting growing angst about a softening economy and potential recession. The closely followed index dropped 2 points from 102.2 in the prior month, the nonprofit Conference Board said today.

The U.S. Housing Market

The U.S. housing market pulled back even more in September, with prices slipping 1.2% from a month earlier. It was the third straight decline for the seasonally adjusted measure of prices in 20 large U.S. cities, according to the S&P CoreLogic Case-Shiller index.

Canada is setting records. Home sales had fallen for eight straight months before October brought a small uptick. Not only is that the longest stretch of falling sales on record, but it is also the steepest, said a CIBC team. “And it’s not really over yet.”

Prices are also setting records. With the average price of a home in Canada down 20% since February, the correction is already the steepest on record, said CIBC.

Well, this is no surprise to us. I believe the bad effect on Canadian Banks will be delayed some. I have learned that many of the variable rate mortgages have fixed payments but increase the amount of the payment that is interest only as rates rise until some trigger point is met, and the mortgagee will then have to make a large lump sum payment.

Skyrocketing home prices and massive interest rate spikes have driven affordability to its worst level in decades, according to a TD Economics report, leaving some first-time buyers shut out of the market altogether.

It is hard to get a handle on the numbers, but there was an article last week where the Bank of Canada said 50% of variable rate mortgages have hit the trigger. I quote from that article.

“After hiking the overnight rate from near zero at the start of the year to 3.75%, the Bank of Canada said this week that about 50% of borrowers with variable-rate, fixed-payment mortgages have reached a trigger rate — the point at which set monthly payments cover only the interest while the principal remains unpaid. Nearly 13% of all Canadian mortgages are affected, according to the central bank.

Federal rules stipulate that mortgages must be amortizing — meaning borrowers must be repaying principal — but lenders have three options once a trigger-rate threshold is reached: raise monthly payments, require a lump-sum pre-payment on the mortgage, or allow borrowers to slip into negative or reverse amortization for a period under rules set by banking authorities and mortgage insurers.”

I expect the majority of affected mortgages are in Ontario. This has likely delayed defaults and more selling pressure, and the banks have not had to increase their loss reserves as quickly as past housing declines. That said, Canadian Banks are reporting financials this week, so we will get a picture of how much their earnings are declining, but they won’t feel the heavy brunt of the housing decline until 2023.

Canada house prices will fall much further. Skyrocketing home prices and massive interest rate spikes have driven affordability to its worst level in decades, according to a TD Economics report, leaving some first-time buyers shut out of the market altogether.

The drop in prices has not offset the effect of higher interest rates,” said RBC economist Robert Hogue. “Our affordability measure is still deteriorating.

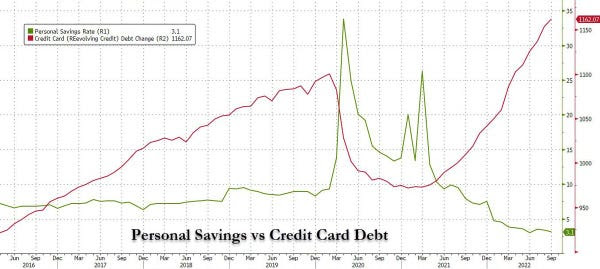
Another factor is that homeowners and consumers are piling up credit card debt, which only delays the reckoning.

Equifax Canada’s consumer survey released end of October found the average credit card balance held by Canadians was at a record high of CA$2,121 by the end of September.

This chart was posted by @zerohedge on Twitter. U.S. consumers are piling on credit card debt even faster than Canadians.
Cyber Monday Vs. Black Friday

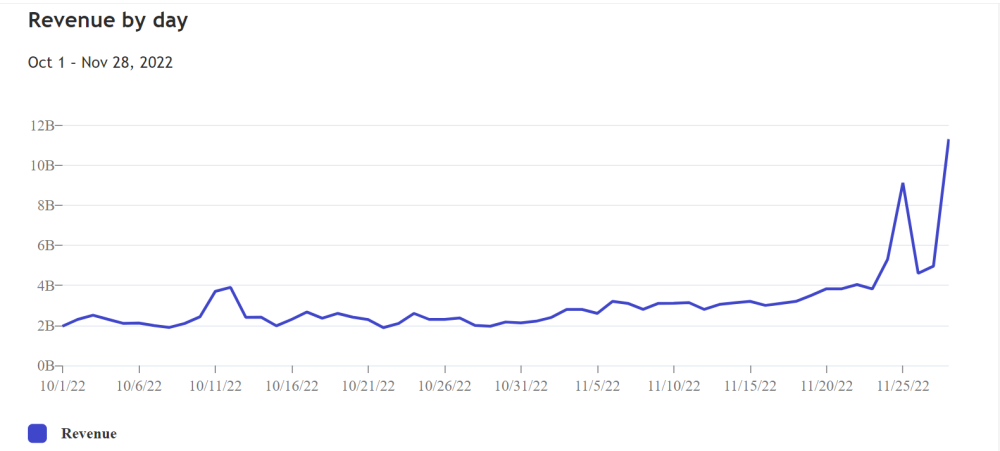
According to Adobe Analytics, the e-commerce-focused Cyber Monday has usurped Black Friday as the premier sales day of the holiday season.

Consumers spent US$11.79B on Cyber Monday sales, comfortably above the US$9.12B recorded for Black Friday, which was a new record.

It would appear that U.S. consumers are not worried about high-interest rates and a recession or maybe don’t know what one is. At the moment, there is no sign of a recession, but avoiding one by making ends meet with credit cards is just a band-aid.

The chart next page shows the spike in Monday online sales over Black Friday.
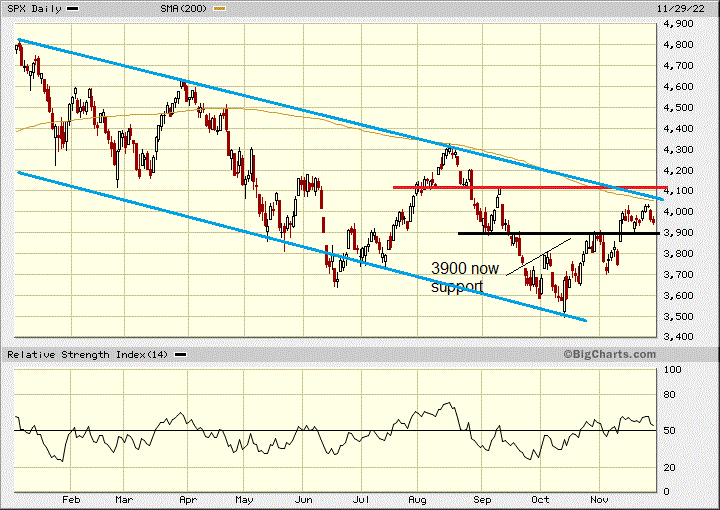
Meanwhile, the equity markets seem to be undecided about their direction.

I think there is some more room to rally up to around 4,100, but if we see a drop below 3,900, it would likely mean this bear market rally is over.
The Oil Market

Now let’s get to some better news for us with our shipping stocks, ATCO and DHT. And a look at the oil market.
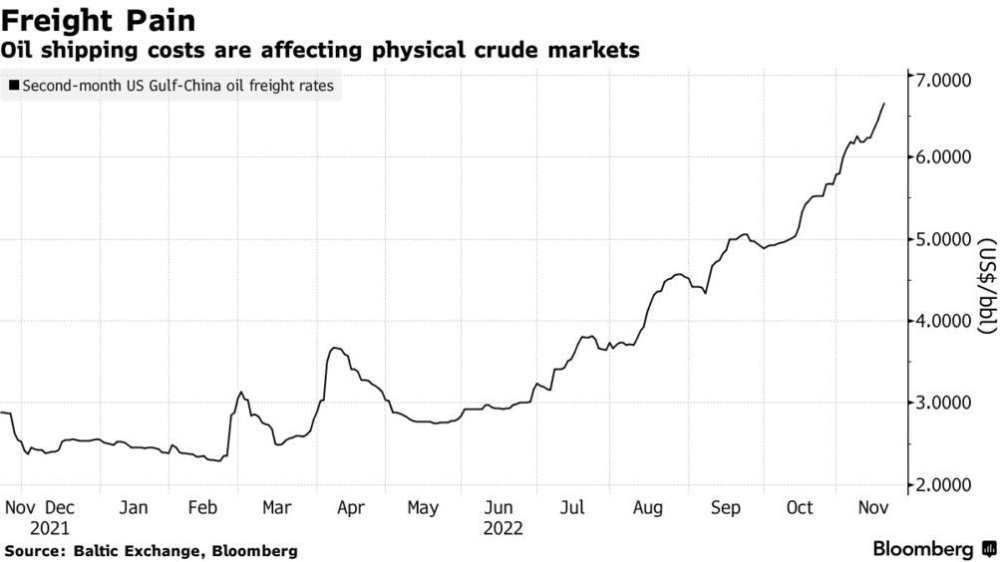
Earnings on the U.S. Gulf Coast-to-China shipping route have soared above US$100,000 per day, equivalent to US$7 per barrel, demonstrating the shrinking availability of crude tankers lately.

As reported by Bloomberg, global long-term LNG contracts before 2026 are all sold out, meaning that over the upcoming three years (until Qatar’s upgrades are commissioned), Europe and Asia will remain on a collision course for remaining spot cargoes.

The recent weakness in oil is probably because of shipping costs. Spot differentials for crudes across the Americas are tanking because of higher shipping costs — free-on-board prices for WTI plummeted a whopping US$5 per barrel week-on-week to reflect the shipping.

Oilprice.com pointed out last week that the shortage of tankers is taking place across all vessel categories; even VLCC freight costs from the Middle East into Asia Pacific have tripled year-on-year. The news of Freeport LNG pushing its restart into March 2023 following a damning report from federal pipeline safety regulators has pushed U.S. natural gas prices to US$6.7 per mmBtu, aggravated by forecasts for colder weather into December.

Germany’s LNG Terminal Costs Soar

The cost of purchasing and maintaining floating LNG terminals to help Germany survive this winter and diversify away from Russian gas has doubled to some US$6.6 billion, with the first unit already completed at the North Sea port of Wilhelmshaven.

As reported by Bloomberg, global long-term LNG contracts before 2026 are all sold out, meaning that over the upcoming three years (until Qatar’s upgrades are commissioned), Europe and Asia will remain on a collision course for remaining spot cargoes.

Remember, the oil sanctions on Russia were only announced, and the EU sanctions are supposed to come into effect in less than two weeks. Italy is considering several options to save its largest refinery, operated by Russia’s Lukoil in Sicily; one of them is to ask the EU for a temporary waiver.

A petition from a range of public interest groups is pushed the U.S. government to condition the approval of federal drilling permits on operators posting the upfront cost to clean up wells, trying to deter cases when small producers file for bankruptcy to avoid cleanup costs.

More Biden Administration negative influence on oil and gas exploration. The only thing I know for certain is the whole energy sector is in a mess and will just get worse. This winter will be horrific for many. However, as investors, there are great ways to profit from the government fiasco. Our two shipping stocks are doing great.

Atlas Energy Group

Atlas Energy Group, LLC (ATLS:OTCMKT) is being bought out at US$15.50 and will be taken private by Q2 2023, and they will keep paying the dividend until then.

You can hold the stock and get US$15.50 or sell now and put funds into one of my other millennium stocks.

We have a yield of 6.8%, but that is based on our US$7.33 buy price. The current yield is 3.2%, and there are other stocks on my Millennium Index with higher yields. A good replacement could be—

Energy Transfer

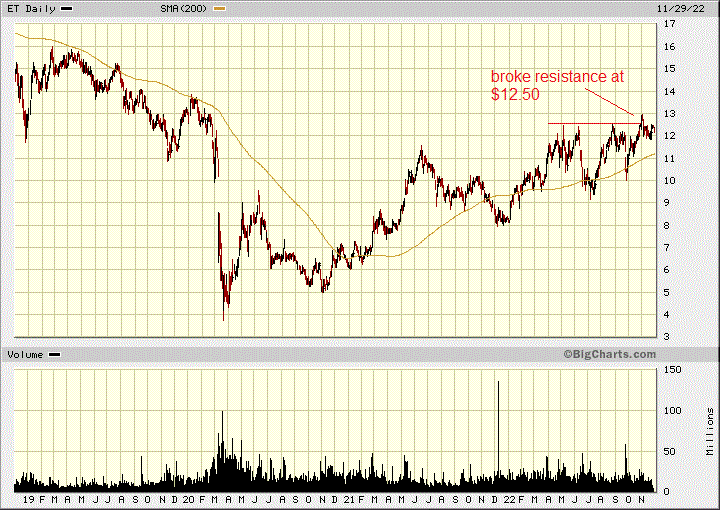
Energy Transfer Partners L.P. (ET:NYSE) is yielding 8.5% paying US$0.265 per quarter. The company plans to get back to its pre covid dividend of US$0.305 per quarter. I see no reason why they will not get there.

ET reported very good Q3 results on September 30, 2022. Net income attributable to partners for the three months ended September 30, 2022, of US$1.01 billion, a US$371 million increase from the same period last year. For the same period, net income per limited partner unit (basic and diluted) was US$0.29 per unit.

In the third quarter of 2022, the partnership experienced a US$126 million charge in the crude oil transportation and services segment related to a legal matter. In addition, Energy Transfer’s third quarter 2022 results were impacted by an approximately US$130 million negative adjustment related to hedged inventory in the NGL and refined products transportation and services segment.

These two items impacted the third quarter of 2022’s Adjusted EBITDA by approximately US$260 million in aggregate. Otherwise, ET numbers could have been better still.

During the third quarter of 2022, each of Energy Transfer’s five core segments realized higher volumes compared with the same period in 2021.

  • Intrastate natural gas transportation volumes were up 28% and set a new Partnership record.
  • Interstate natural gas transportation volumes were up 43%.
  • Midstream gathered volumes were up 47% and set a new Partnership record.
  • NGL transportation volumes were up 5%.
  • NGL fractionation volumes were up 6% and set a new Partnership record.
  • Crude oil transportation and terminal volumes were up 10% and 14%, respectively.

Over 90% of ET’s growth capital spending is comprised of projects that are already on-line or expected to be on-line and contributing cash flow at very attractive returns before the end of 2023.

The project backlog includes Gulf Run Pipeline in Louisiana, Grey Wolf and Bear processing plants in the Permian Basin, Fractionator VIII in Mont Belvieu, and LPG facilities projects at Energy Transfer’s Nederland Terminal.

There is no good reason why this stock is not back to the higher levels witnessed in 2019. The recent break above US$12.50 is a good signal the stock is headed higher.
DHT Holdings

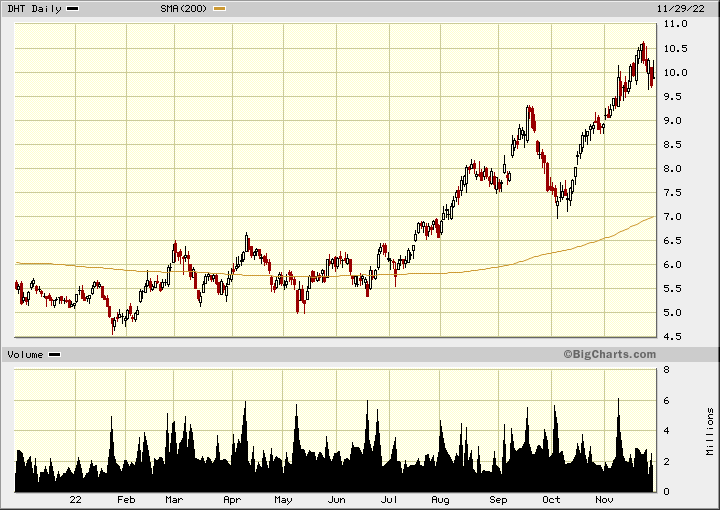
DHT Holdings Inc.’s (DHT:NYSE) stock moved very quickly for us, breaking out to highs and prices not seen since 2012. The oil shipping market will probably get tighter still this winter. Since we bought the stock in early October, they released their Q3 results on November 7, 2022.

In the third quarter of 2022, the Company achieved combined time charter equivalent earnings of US$25,400 per day, comprised of US$35,300 per day for the Company’s VLCCs on time-charter and US$22,000 per day for the Company’s VLCCs operating in the spot market. Adjusted EBITDA for the third quarter of 2022 was US$35.6 million. Net profit for the quarter was US$7.5 million, which equates to US$0.04 per basic share. DHT is paying a US$0.04 dividend, payable today.

Profits and dividends are going much higher. Look at the rates they are getting so far in Q4 compared to the above. Thus far, in the fourth quarter of 2022, 69% of the available VLCC spot days have been booked at an average rate of US$61,800 per day on a discharge-to-discharge basis.

77% of the available VLCC days, combined spot and time-charter days, have been booked at an average rate of US$53,100 per day (not including any potential profit splits on time charters).

Our timing to buy the stock was perfect, with the dip under US$7.50. The pullback from the recent US$10.50 is healthy market action, and I would buy on any dip below US$9.50.
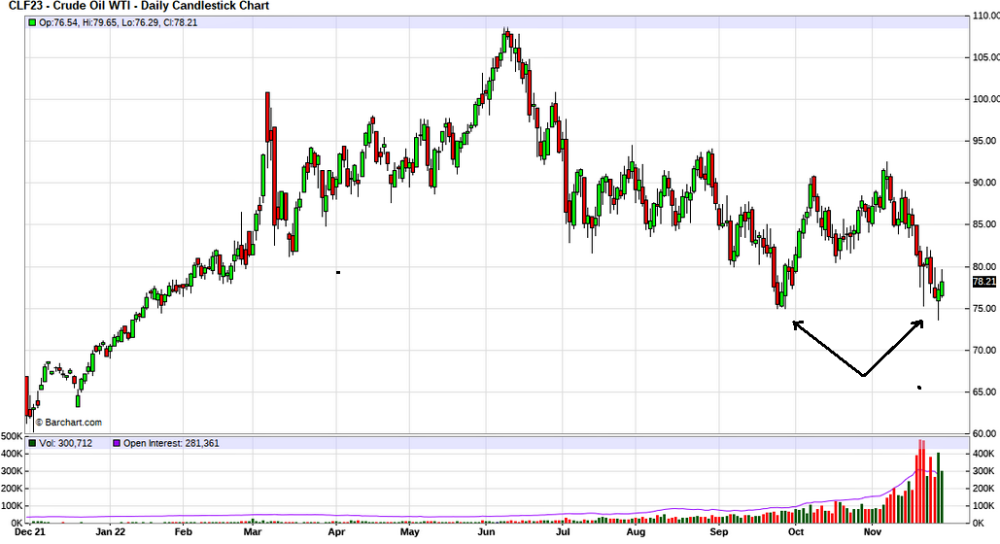
Sentiment in the oil market has been weak, with the China Covid-19 lockdowns causing demand fear.

At the same time, liquidity in the key contracts traded is wafer-thin as last week’s volatility prompted the sell-off of an equivalent of 90 million barrels, with open interest in WTI falling to the lowest since 2015.

Oil dropped under US$40 in 2015, where it bottomed, so this low open interest is likely another bottom with a second test of US$75.
The Emergencies Act

I hate to say I told you so because it is not good news.

Early this year, I commented that invoking the Emergencies Act in Canada caused a bank run and would result in strong capital outflows from Canada.

Capital flows are transactions involving financial assets between international entities.

The Emergencies Act was invoked in February, and you can see the steep plunge since then. The last biggest steep plunge was in the 2008 financial crisis, which saw a plunge from around +6000 to -11,000 (click 25-year chart). This current plunge is much more than that.

Financial assets to be included can be bank deposits, loans, equity securities, debt securities, etc. Capital outflow generally results from economic uncertainty in a country, whereas large amounts of capital inflow indicate a growing economy.

It has been a while now since Trudeau made his ridiculous move, and we have some data.

This is a 10-year chart of Canada Capital flows from Statistics Canada.

You can see that Capital flows were improving with the recovery from the pandemic and high oil prices that in the past have been a big benefit to Canada.

From around 2001 to 2008, Canada had its strongest inflows when oil ran from around US$60 to US$150. Canada was running at the 10,000 mark on the plus side back then.
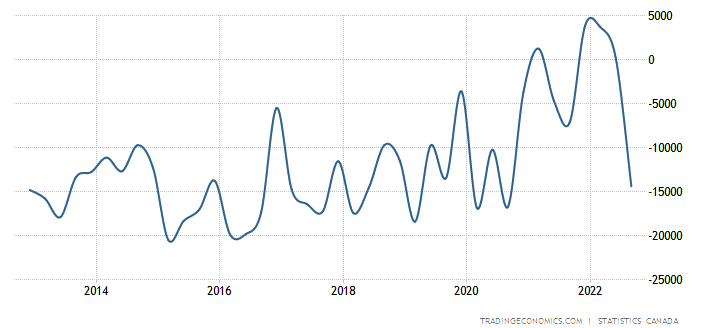
The Emergencies Act was invoked in February, and you can see the steep plunge since then. The last biggest steep plunge was in the 2008 financial crisis, which saw a plunge from around +6000 to -11,000 (click 25-year chart). This current plunge is much more than that, and we have not seen the bottom yet. There is no doubt we are seeing the greatest outflow of money from Canada in its history.

The Emergencies Act in Canada was all about going after the ‘Freedom Convoy’ money. The big Canadian banks admitted just that in the current parliament inquiry underway. I am not going to get into that and the political BS right now, but it is no surprise business confidence is plunging also.

Small business confidence in Canada has hit one of its lowest levels ever, according to the Canadian Federation of Independent Business (CFIB). Meanwhile, the long-term index, based on a 12-month outlook, dropped 1.2 points to 50.0 this month — the lowest recorded since 2009, outside of the 2008/09 and 2020 recessions, the CFIB said.

Right now, markets in Canada and the U.S. are trading on the proverbial ‘soft landing’ that seldom occurs. A severe recession is coming that will get started in Europe this winter as they are forced to shut down industries because of energy shortages.

Putin’s recent attacks on Ukraine’s energy grid will result in more shortages as Ukraine is no longer able to export electricity to Europe.

I hate to say it, but another bad news told-you-so will sadly occur this winter.

From a personal experience, I have an emergency kerosene heater and paid around US$20 for an 18 to 19-liter jug of fuel. A recent discussion prompted me to check prices, and I found out those jugs of fuel are now selling for over US$100. And that is if you can find one.

Struthers Stock Report Disclaimers: 

All forecasts and recommendations are based on opinion. Markets change direction with consensus beliefs, which may change at any time and without notice. The author/publisher of this publication has taken every precaution to provide the most accurate information possible. The information & data were obtained from sources believed to be reliable, but because the information & data source are beyond the author’s control, no representation or guarantee is made that it is complete or accurate.

The reader accepts information on the condition that errors or omissions shall not be made the basis for any claim, demand or cause for action. Because of the ever-changing nature of information & statistics the author/publisher strongly encourages the reader to communicate directly with the company and/or with their personal investment adviser to obtain up to date information.

Past results are not necessarily indicative of future results. Any statements non-factual in nature constitute only current opinions, which are subject to change. The author/publisher may or may not have a position in the securities and/or options relating thereto, & may make purchases and/or sales of these securities relating thereto from time to time in the open market or otherwise. Neither the information, nor opinions expressed, shall be construed as a solicitation to buy or sell any stock, futures or options contract mentioned herein. The author/publisher of this letter is not a qualified financial adviser & is not acting as such in this publication.

Disclosures: 

Charts provided by the author.

1) Ron Struthers: I, or members of my immediate household or family, own shares of the following companies mentioned in this article: Energy Transfer and DHT Holdings. I personally am, or members of my immediate household or family are, paid by the following companies mentioned in this article: None. My company currently has a financial relationship with the following companies mentioned in this article: None. I determined which companies would be included in this article based on my research and understanding of the sector.

2) The following companies mentioned in this article are billboard sponsors of Streetwise Reports: None. Click here for important disclosures about sponsor fees. The information provided above is for informational purposes only and is not a recommendation to buy or sell any security.

3) Statements and opinions expressed are the opinions of the author and not of Streetwise Reports or its officers. The author is wholly responsible for the validity of the statements. The author was not paid by Streetwise Reports for this article. Streetwise Reports was not paid by the author to publish or syndicate this article. Streetwise Reports requires contributing authors to disclose any shareholdings in, or economic relationships with, companies that they write about. Streetwise Reports relies upon the authors to accurately provide this information and Streetwise Reports has no means of verifying its accuracy.

4) This article does not constitute investment advice. Each reader is encouraged to consult with his or her individual financial professional and any action a reader takes as a result of information presented here is his or her own responsibility. By opening this page, each reader accepts and agrees to Streetwise Reports’ terms of use and full legal disclaimer. This article is not a solicitation for investment. Streetwise Reports does not render general or specific investment advice and the information on Streetwise Reports should not be considered a recommendation to buy or sell any security. Streetwise Reports does not endorse or recommend the business, products, services, or securities of any company mentioned on Streetwise Reports.

5) From time to time, Streetwise Reports LLC and its directors, officers, employees, or members of their families, as well as persons interviewed for articles and interviews on the site, may have a long or short position in the securities mentioned. Directors, officers, employees, or members of their immediate families are prohibited from making purchases and/or sales of those securities in the open market or otherwise from the time of the decision to publish an article until three business days after the publication of the article. The foregoing prohibition does not apply to articles that in substance only restate previously published company releases.
 

Crude Oil: Why You Should Look Beyond Supply / Demand

The primary regulator of the rises and falls in oil’s prices is market psychology

By Elliott Wave International

As I write on the morning of Friday, Nov. 18, crude oil is on track for its second weekly decline.

The financial media usually finds “reasons” for a market’s price action that are rooted in “market fundamentals,” and this decline in oil’s price was no exception.

On Thurs., Nov. 17, a CNBC headline noted:

Oil falls on easing geopolitical tension, China demand outlook

The gist of the story was that a rising number of COVID-19 cases in China would contribute to a lower demand for crude oil in the world’s second largest economy; hence, the falling prices.

However, Elliott Wave International has observed over the years that supply and demand doesn’t play as large of a role in oil’s price trend as widely believed. Indeed, all too often, oil’s price moves in the opposite direction from what supply and demand observers expect.

That’s why we would argue — and this may seem like a radical notion — that changes in the supply and demand for oil are far more a result of price fluctuations than a cause of them.

Let me explain. This chart and commentary from Robert Prechter’s Socionomic Theory of Finance provides insight:

Elliott waves of social mood, as reflected in stock prices, regulate feelings of optimism and pessimism among producers, alternately motivating them to overproduce and then underproduce oil relative to contemporaneous consumption. Their optimism makes them believe business will expand, so they produce more; and their pessimism makes them believe business will contract, so they produce less. This depiction of causality accounts quite well for the rises and falls in oil’s production/consumption ratio.

You may be interested in knowing that our crude oil analysis in our monthly Global Market Perspective is also based on Elliott waves of market psychology.

On Nov. 4, when the November Global Market Perspective published (the Global Market Perspective is a monthly Elliott Wave International publication which covers 50-plus global financial markets), Elliott Wave International’s chief energy analyst said:

… at this juncture the intermediate-term outlook remains down.

On the date this forecast was made, WTI Crude Oil (NYMEX) closed at $91.45. As of this writing on the morning of Nov. 18, WTI Crude Oil is at $79.35 a barrel. Note that the Global Market Perspective‘s Nov. 4 forecast didn’t mention a single “geopolitical” or “fundamental” factor. Elliott Wave International’s chief energy analyst relied strictly on the bearish picture of market psychology in crude oil’s price charts.

Do know that Elliott wave analysis does not always work out to a “T;” however, it’s the best forecasting method for oil prices — and other liquid markets — of which Elliott Wave International knows. That’s why Elliott Wave International has relied on it for over 40 years.

If you’d like to delve into the details of Elliott wave analysis, read Elliott Wave Principle: Key to Market Behavior by Frost & Prechter. Here’s a quote from this Wall Street classic:

In the 1930s, Ralph Nelson Elliott discovered that stock market prices trend and reverse in recognizable patterns. The patterns he discerned are repetitive in form but not necessarily in time or amplitude. Elliott isolated five such patterns, or “waves,” that recur in market price data. He named, defined and illustrated these patterns and their variations. He then described how they link together to form larger versions of themselves, how they in turn link to form the same patterns of the next larger size, and so on, producing a structured progression. He called this phenomenon The Wave Principle.

You may be interested in knowing that you can access the entire online version of the book for free once you become a member of Club EWI, the world’s largest Elliott wave educational community.

A Club EWI membership is also free, and members enjoy instant and complimentary access to a variety of Elliott wave resources on financial markets, investing and trading without any obligation.

Join Club EWI now by following this link: Elliott Wave Principle: Key to Market Behaviorget free and unlimited access.

This article was syndicated by Elliott Wave International and was originally published under the headline Crude Oil: Why You Should Look Beyond Supply / Demand. EWI is the world’s largest market forecasting firm. Its staff of full-time analysts led by Chartered Market Technician Robert Prechter provides 24-hour-a-day market analysis to institutional and private investors around the world.

Green Co. Taking Steps To Start Construction of Ecuador Plant

Source: Streetwise Reports  (11/25/22)

BacTech Environmental Corp. is completing an engineering report needed to start construction of its bioleaching plant in Tenguel, Ecuador.

BacTech Environmental Corp. (BAC:CSE;BCCEF:OTCQB;OBT1:FRA) is looking to complete an important engineering report on its bioleaching plant in Tenguel, Ecuador, by the end of the year.

The detailed engineering progress report was about 90% done as of Oct. 31, the company said.

BacTech is building the plant to take advantage of the growing green mining space. Research company Markets and Markets said the sector is expected to grow from an estimated US$9 billion in 2019 to US$12.9 billion by 2024.

Pressures from government and environmental groups are forcing companies to raise their capital and operating expenditures.

“As the countries tighten the environmental regulations and the public concern about the mining industry grows, this increases the pressure on these mining companies to minimize their environmental impacts and pay a higher amount to the occurring local issues,” Markets and Markets wrote.

Chris Temple, editor of The National Investor, has said he believes that process with the community will go smoothly. “This is a great project for the area,” he said.

But BacTech thinks it has a solution. Using naturally occurring bacteria, bioleaching makes it possible for those companies to work with lower-grade ore and recover metals from tailings sites as well as mines.

“Our bugs eat rocks,” the company says. Bacteria chew and oxidize the sulfides in the rock like mortar in a brick wall. Once that mortar is gone, the wall crashes down, President and Chief Executive Officer Ross Orr said.

“We really have no competition as we are pursuing this, which everyone else is running away from,” Orr told Streetwise Reports.

Bioleaching was attempted commercially in South Africa in 1986. There have been more than 20 plants built globally since then.

The Catalyst

BacTech received approval from the Ecuador government for its environmental impact study on the site for the plant last month. All that’s left from a regulatory standpoint is the final community consultation phase before the final environmental permit is issued.

The company will give presentations, hold town halls, and reply to questions from residents.

Chris Temple, editor of The National Investor, has said he believes that process with the community will go smoothly. “This is a great project for the area,” he said.

Procurement Underway

The site’s construction permit was approved in March, and BacTech signed an Investment Protection Agreement (IPA) with the government in May, giving it a 12-year income tax holiday and international arbitration for disputes.

As of the end of October, about 62% of the equipment for the plant had been procured, the company said.

“Procurement will now begin to command greater attention in an effort to lock down key supplier relationships and equipment pricing,” said BacTech Chief Operating Officer David Tingey.

The company said discussions were ongoing with several groups with respect to financing for the project, which will depend on permitting and completion of the detailed engineering report.

The plant will also have a small footprint, as much of the 100 acres of land bought for it will continue to be used by local farmers. BacTech has agreed to let them keep harvesting 80% of the farm’s thousands of cocoa trees.

For the feed going into the plant, there are 90 small mines in the area that produce significant amounts of arsenic with gold in the area. The plant would process about 30,900 ounces gold (Au) per year. There is potential for expansion; the total availability of materials in the area is an estimated 250 tonnes per day.

The plant would have pre-tax earnings of about US$10.9 million and a two-year payback period, according to data from EPCM Consultores.

The company is also opening a pilot facility to treat low-grade nickel in pyrrhotite and recover associated elements like iron and sulfur.

Ownership, Coverage, and Share Structure

BacTech recently started trading on the OTCQB Venture Market in the United States under the ticker symbol BCCEF. It continues to be traded on the Canadian Stock Exchange under BAC.

Nearly half of the company, 49%, is held by insiders, management, and strategic shareholders, the biggest of which is Option Three Advisory Services Ltd., which owns 8.98%, or 15.57 million shares, according to Reuters. That also includes CEO Orr, who owns 3.78% or 6.54 million shares, and Board Director Timothy Lewin, who owns 0.57% or 0.98 million shares.

Currently, BacTech is covered by newsletter writers of clivemaund.com, of 321gold.com, and of The National Investor. Click “See More Live Data” in the data box below to see what they are saying.

The company has 173.4 million shares outstanding, including 149 million free floating. Its market cap is CA$10.32 million, and it trades in a 52-week range of CA$0.165 and CA$0.06.

Disclosures:

1) Steve Sobek wrote this article for Streetwise Reports LLC. He or members of his household own securities of the following companies mentioned in the article: None. He or members of his household are paid by the following companies mentioned in this article: None.

2) The following companies mentioned in this article are billboard sponsors of Streetwise Reports: BacTech Environmental Corp. Click here for important disclosures about sponsor fees. The information provided above is for informational purposes only and is not a recommendation to buy or sell any security. As of the date of this article, an affiliate of Streetwise Reports has a consulting relationship with BacTech Environmental Corp. Please click here for more information.

3) The article does not constitute investment advice. Each reader is encouraged to consult with his or her individual financial professional and any action a reader takes as a result of information presented here is his or her own responsibility. By opening this page, each reader accepts and agrees to Streetwise Reports’ terms of use and full legal disclaimer. This article is not a solicitation for investment. Streetwise Reports does not render general or specific investment advice and the information on Streetwise Reports should not be considered a recommendation to buy or sell any security. Streetwise Reports does not endorse or recommend the business, products, services or securities of any company mentioned on Streetwise Reports.

4) From time to time, Streetwise Reports LLC and its directors, officers, employees or members of their families, as well as persons interviewed for articles and interviews on the site, may have a long or short position in securities mentioned. Directors, officers, employees or members of their immediate families are prohibited from making purchases and/or sales of those securities in the open market or otherwise from the time of the decision to publish an article until three business days after the publication of the article. The foregoing prohibition does not apply to articles that in substance only restate previously published company releases. As of the date of this article, officers and/or employees of Streetwise Reports LLC (including members of their household) own securities of BacTech Environmental Corp., a company mentioned in this article.

Crude Oil Started with Crash

By RoboForex Analytical Department

Crude oil market started the new week with sales. A Brent barrel is falling to 81.40 USD.

The worst of the news comes from China. The Chinese are rebelling against tough anti-coronavirus measures and lockdowns imposed by the government due to many new cases of COVID-19. The situation generates points of uncertainty because it is yet unclear how the Chinese authorities will react and how it all ends.

The issue with the maximum price level for Russian oil also keeps the market nervous.

According to Baker Hughes, the number of active oil rigs in the US increased last week by 4, reaching 627.

On H4, Brent has completed a wave of decline to 81.05. Today a consolidation range may form around it. With an escape upwards, a correction link to 89.09 might form. Then a link of decline to 78.78 and even 78.25 becomes possible. Technically, this scenario is confirmed by the MACD. Its signal line is at the lows, preparing to grow to zero.

On H1, Brent has formed a consolidation range around 85.00. Today with an escape downwards, a local goal of the declining wave has been reached at 81.05. With an escape upwards, a pathway up to 85.00 will open (a test from below). Technically, this scenario is confirmed by the Stochastic oscillator. Its signal line is under 20, headed straight upwards. The indicator is expected to grow to 50.

Disclaimer

Any forecasts contained herein are based on the author’s particular opinion. This analysis may not be treated as trading advice. RoboForex bears no responsibility for trading results based on trading recommendations and reviews contained herein.

Why fixing methane leaks from the oil and gas industry can be a climate game-changer – one that pays for itself

By Jim Krane, Jones Graduate School of Business at Rice University 

What’s the cheapest, quickest way to reduce climate change without roiling the economy? In the United States, it may be by reducing methane emissions from the oil and gas industry.

Methane is the main component of natural gas, and it can leak anywhere along the supply chain, from the wellhead and processing plant, through pipelines and distribution lines, all the way to the burner of your home’s stove or furnace.

Once it reaches the atmosphere, methane’s super heat-trapping properties render it a major agent of warming. Over 20 years, methane causes 85 times more warming than the same amount of carbon dioxide. But methane doesn’t stay in the atmosphere for long, so stopping methane leaks today can have a fast impact on lowering global temperatures.

That’s one reason governments at the 2022 United Nations climate change conference in Egypt focused on methane as an easy win in the climate battle.

So far, 150 countries, including the United States and most of the big oil producers other than Russia, have pledged to reduce methane emissions from oil and gas by at least 30%. China has not signed but has agreed to reduce emissions. If those pledges are met, the result would be equivalent to eliminating the greenhouse gas emissions from all of the world’s cars, trucks, buses and all two- and three-wheeled vehicles, according to the International Energy Agency.

There’s also another reason for the methane focus, and it makes this strategy more likely to succeed: Stopping methane leaks from the oil and gas industry can largely pay for itself and boost the amount of fuel available.

Capturing methane can pay off

Methane is produced by decaying organic material. Natural sources, such as wetlands, account for roughly 40% of today’s global methane emissions. But the majority comes from human activities, such as farms, landfills and wastewater treatment plants – and fuel production. Oil, gas and coal together make up about a third of global methane emissions.

In all, methane is responsible for almost a third of the 1.2 degrees Celsius (2.2 degrees Fahrenheit) that global temperatures have risen since the industrial era.

Unfortunately, methane emissions are still rising. In 2021, atmospheric levels increased to 1,908 parts per billion, the highest levels in at least 800,000 years. Last year’s increase of 18 parts per billion was the biggest on record.

Among the sources, the oil and gas sector is best equipped to stop emitting because it is already configured to sell any methane it can prevent from leaking.

Methane leaks and “venting” in the oil and gas sector have numerous causes. Unintentional leaks can flow from pneumatic devices, valves, compressors and storage tanks, which often are designed to vent methane when pressures build.

Unlit or inefficient flares are another big source. Some companies routinely burn off excess gas that they can’t easily capture or don’t have the pipeline capacity to transport, but that still releases methane and carbon dioxide into the atmosphere.

Nearly all of these emissions can be stopped with new components or regulations that prohibit routine flaring.

Making those repairs can pay off. Global oil and gas operations emitted more methane in 2021 than Canada consumed that entire year, according to IEA estimates. If that gas were captured, at current U.S. prices – $4 per million British thermal unit – that wasted methane would fetch around $17 billion. The IEA determined that a one-time investment of $11 billion would eliminate roughly 75% of methane leaks worldwide, along with an even larger amount of gas that is wasted by “flaring” or burning it off at the wellhead.

The repairs and infrastructure investments would not only reduce warming, but they would also generate profits for producers and provide direly needed natural gas to markets undergoing drastic shortages due to Russia’s invasion of Ukraine.

Getting companies to cut methane emissions

Motivating U.S. producers to act has been the big hurdle.

The Biden administration is aiming for an 87% reduction in methane emissions below 2005 levels by the end of the decade. To get there, it has reimposed and strengthened U.S. methane rules that were dropped by the Trump administration. These include requiring drillers to find and repair leaks at more than 1 million U.S. well sites.

The U.S. Inflation Reduction Act of 2022 further incentivizes methane mitigation, including by levying an emissions tax on large oil and gas producers starting at $900 per ton in 2024, increasing to $1,500 in 2026. That fee, which can be waived by the Environmental Protection Agency and doesn’t affect small producers or leaks below 0.2% of gas produced, is based on the social cost to society from methane’s contribution to climate damage.

Customers are also putting pressure on the industry. Regulatory indifference by the Trump administration to U.S. methane flaring and venting led to cancellation of some European plans to import U.S. liquefied natural gas.

Reducing methane isn’t always straightforward, though, particularly in the U.S., where thousands of oil companies operate with minimal oversight.

A company’s methane emissions aren’t necessarily proportional to its oil and gas production, either. For example, a 2021 study using data from the EPA found Texas-based Hilcorp Energy reporting nearly 50% more methane emissions than ExxonMobil, despite producing less oil and gas. Hilcorp, which specializes in acquiring “late life” assets, says it is working to reduce emissions. Other little-known producers have also reported large emissions.

Investor pressure has pushed several publicly traded companies to reduce their methane emissions, but in practice this sometimes leads them to sell off “dirty” assets to smaller operators with less oversight.

In such a situation, the easiest way to encourage companies to clean up is via a tax. Done right, companies would act before they had to pay.

Using technology to keep emissions in check

Unlike carbon dioxide, which lingers in the atmosphere for a century or more, methane only sticks around for about a dozen years. So, if humans stop replenishing methane stocks in the atmosphere, those levels will decline.

A review of methane leaks in the Permian Basin shows the big impact that some regions can have.

Researchers found that gas and oil operations in the Permian, in west Texas and New Mexico, had a leakage rate estimated at 3.7% in 2018 and 2019, before the pandemic. A 2012 study found that leakage rates above 3.2% make climate damage from using natural gas worse than that from burning coal, which is normally considered the biggest climate threat.

Map showing largest emissions in Russia, the Middle East and the US
Map of methane emissions from oil, gas and coal globally, 2016.
Joshua Stevens/NASA Earth Observatory

Methane leaks used to escape detection because the gas is invisible. Now, the proliferation of satellite-based sensors and infrared cameras makes detection easy.

Companies such as GTI Energy’s Veritas, Project Canary and MiQ have also launched to assist natural gas producers in reducing emissions and then verifying the reductions. At that point, if leaks are less than 0.2%, producers can avoid the federal fee and also market their output as “responsibly sourced” gas.The Conversation

About the Author:

Jim Krane, Fellow for Energy Studies, Baker Institute for Public Policy; Lecturer, Jones Graduate School of Business at Rice University

This article is republished from The Conversation under a Creative Commons license. Read the original article.


How to design clean energy subsidies that work – without wasting money on free riders

By Eric Hittinger, Rochester Institute of Technology; Eric Williams, Rochester Institute of Technology; Qing Miao, Rochester Institute of Technology, and Tiruwork B. Tibebu, Rochester Institute of Technology 

The planet is heating up as greenhouse gas emissions rise, contributing to extreme heat waves and once-unimaginable flooding. Yet despite the risks, countries’ policies are not on track to keep global warming in check.

The problem isn’t a lack of technology. The International Energy Agency recently released a detailed analysis of the clean energy technology needed to lower greenhouse gas emissions to net zero globally by 2050. What’s needed, the IEA says, is significant government support to boost solar and wind power, electric vehicles, heat pumps and a variety of other technologies for a rapid energy transition.

One politically popular tool for providing that government support is the subsidy. The U.S. government’s new Inflation Reduction Act is a multibillion-dollar example, packed with financial incentives to encourage people to buy electric vehicles, solar panels and more.

But just how big do governments’ clean energy subsidies need to be to meet their goals, and how long are they needed?

Our research points to three important answers for any government considering clean energy subsidies – and for citizens keeping an eye on their progress.

Why subsidize at all?

An obvious first question is: Why should governments subsidize clean energy at all?

The most direct answer is that clean energy helps to reduce harmful emissions – both of gases that cause local pollution and of those that warm the planet.

Reducing emissions helps to lower both public health costs and damage from climate change, which justifies government spending. Reports have estimated that the U.S. spends US$820 billion a year just on health costs associated with air pollution and climate change. Globally, the World Health Organization estimated that the costs reached $5.1 trillion in 2018. Taxing and regulating polluting industries can also cut emissions, but carrots are often more politically popular than sticks.

A female scientist holds a solar cell between tweezers
Subsidies helped launch the solar industry. Buyers today can get a 30% tax credit for home solar installations.
Joe DelNero/NREL

A less obvious reason for subsidies is that government support can help a new and initially expensive technology become competitive in the market.

Governments have been central to the development of many technologies that are pervasive today, including microchips, the internet, solar panels and GPS. Microchips were fantastically expensive when first developed in the 1950s. Demand from the U.S. military and NASA, which could pay the high price, fueled the growth of the industry, and costs eventually dropped enough that they’re now found in everything from cars to toasters.

Government support has also helped to bring down the cost of solar power. Rooftop solar system costs fell 64% from 2010 to 2020 in the U.S. because cells became more efficient and higher volumes drove prices down.

How much money?

So, subsidies can work, but what’s the right amount?

Too low, and a subsidy has no effect. Giving everyone a coupon for $1 off an electric car won’t change anyone’s buying plans. But subsidies can also be set too high.

The government doesn’t need to spend money persuading consumers who already plan to buy an electric car and can afford one, yet studies show clean energy subsidies disproportionately go to richer people. When people who would have purchased the item anyway receive subsidies, they’re known as “free riders.”

The ideal subsidy attracts new buyers while avoiding free riders and overspending on people who are already convinced. The subsidy can only work when it convinces a previously uninterested consumer to buy a product.

Chart shows costs falling as solar purchases rise.
Between 2009 and 2017, solar prices fell 50% and solar purchases increased tenfold with the help of subsidies. Lower cost makes a technology more attractive, while a growing solar industry is able to produce panels at lower cost.
Barbose et al., 2021; Solar Market Insight Report/SEIA

How long should subsidies last?

Timing is also important when thinking about the size of subsidies. When a promising technology is new and expensive, free riders are less of an issue. A large subsidy may be needed to attract even a few buyers, build out the emerging market and support the industry’s growth.

Solar power is a good example: In 2005, solar was several times more expensive than traditional electricity sources. Subsidies, like the 30% Investment Tax Credit established that year, helped lower the cost, and today’s solar is about one-tenth the price and cost-competitive with other electricity sources.

Once a clean technology is competitive, subsidies can still play an important role in speeding up the energy transition, but at a lower level than in the past.

In our research on residential solar panels, we estimate that the ideal subsidy for rooftop solar should have been initially higher than the actual federal tax credit but fall more quickly, declining to zero after 14 years from its start date.

By starting the subsidy about 20% higher, our models found that it would have boosted production faster, which would cut costs faster and reduce the need for high future subsidies.

Should subsidies eventually disappear?

It makes sense for subsidies to disappear altogether once a technology is sufficiently cost-competitive. However, even if a technology is competitive, it might be worth further subsidy if the speed of adoption is important.

The argument for continuing a subsidy depends on whether the additional adoption it stimulates is cost-effective in reducing emissions. Wind power is cheaper than fossil fuel power in many parts of the country. Even so, we found that continuing subsidies for wind power would lead to valuable emission benefits.

That said, sometimes subsidies stick around when they shouldn’t.

Fossil fuels have been heavily subsidized for decades, despite their harm to human health, the environment and the climate, all of which raise public costs. Governments globally spent almost $700 billion on fossil fuel subsidies in 2021. The U.S. government, in recent years, has spent more on renewable energy tax credits than fossil fuels, which is a promising transition of government support.

Global impact

While the U.S. was the focus of our solar subsidy research, this way of thinking – balancing the costs and benefits of subsidies – can be applied in other nations to design better subsidies for clean energy technologies.

The subsidy is just one policy tool, but it is an important one for both stimulating early-stage technologies and accelerating deployment of more competitive options. As the world attempts the fastest energy transition in history, today’s energy subsidy decisions will affect its ability to succeed.The Conversation

About the Author:

Eric Hittinger, Associate Professor of Public Policy, Rochester Institute of Technology; Eric Williams, Professor of Sustainability, Rochester Institute of Technology; Qing Miao, Associate Professor of Public Policy, Rochester Institute of Technology, and Tiruwork B. Tibebu, Ph.D. Student, Rochester Institute of Technology

This article is republished from The Conversation under a Creative Commons license. Read the original article.