Archive for Energy – Page 13

With Inked Deal, Oil & Gas Co. To Own 100% of Subsidiary

Source: Bill Newman  (3/3/23)

With the transaction close, the acquirer will also assume total interest in the now jointly owned oil asset, noted a Research Capital Corp. report.

CanAsia Energy Corp. (CEC:TSX.V) agreed to buy Andora Energy’s common shares owned by minority shareholders for US$1.7 million (US$0.044 per share) in cash, reported Research Capital Corp. analyst Bill Newman in a March 2 research note. This will take CanAsia’s ownership of Andora’s common shares to 100% from 88.2%.

The deal is expected to close by this month’s end, noted Newman, and will likely catalyze CanAsia’s stock.

“We view this transaction as positive,” Newman added.

Research Capital maintained its Speculative Buy recommendation and CA$0.50 per share price target on CanAsia, noted Newman. The stock is currently trading at CA$0.22 per share, which implies a significant, or 127%, potential return on investment from here.

Stake in Resource To Change

Newman pointed out that with the transaction, the portion of the Sawn Lake resource net to CanAsia will increase to 100%, according to the updated resource previously prepared by Sproule Associates and effective Dec. 31, 2022.

The risked best estimate contingent resource net to CanAsia will increase to 248,200,000 barrels (248.2 MMbbl) from 218.9 MMbbl.

Accordingly, the after-tax net present value discounted at 15% of this resource will change to CA$198 million (CA$198M), or CA$3.98 per share, previously CA$175M, or CA$3.51 per share.

Disclosures:
1) Doresa Banning wrote this article for Streetwise Reports LLC. She or members of her household own securities of the following companies mentioned in the article: None. She or members of her household are paid by the following companies mentioned in this article: None.

2) The following companies mentioned in this article are billboard sponsors of Streetwise Reports: CanAsia Energy Corp. Click here for important disclosures about sponsor fees. As of the date of this article, an affiliate of Streetwise Reports has a consulting relationship with: None. Please click here for more information.

3) Statements and opinions expressed are the opinions of the author and not of Streetwise Reports or its officers. The author is wholly responsible for the validity of the statements. The author was not paid by Streetwise Reports for this article. Streetwise Reports was not paid by the author to publish or syndicate this article. Streetwise Reports requires contributing authors to disclose any shareholdings in, or economic relationships with, companies that they write about. Streetwise Reports relies upon the authors to accurately provide this information and Streetwise Reports has no means of verifying its accuracy.

4) This article does not constitute investment advice. Each reader is encouraged to consult with his or her individual financial professional and any action a reader takes as a result of information presented here is his or her own responsibility. By opening this page, each reader accepts and agrees to Streetwise Reports’ terms of use and full legal disclaimer. This article is not a solicitation for investment. Streetwise Reports does not render general or specific investment advice and the information on Streetwise Reports should not be considered a recommendation to buy or sell any security. Streetwise Reports does not endorse or recommend the business, products, services or securities of any company mentioned on Streetwise Reports.

5) From time to time, Streetwise Reports LLC and its directors, officers, employees or members of their families, as well as persons interviewed for articles and interviews on the site, may have a long or short position in securities mentioned. Directors, officers, employees or members of their immediate families are prohibited from making purchases and/or sales of those securities in the open market or otherwise from the time of the decision to publish an article until three business days after the publication of the article. The foregoing prohibition does not apply to articles that in substance only restate previously published company releases. As of the date of this article, officers and/or employees of Streetwise Reports LLC (including members of their household) own securities of


Want to be the first to know about interesting Oil & Gas – Exploration & Production investment ideas? Sign up to receive the FREE Streetwise Reports’ newsletter.Subscribe


Disclosures:
1) Doresa Banning wrote this article for Streetwise Reports LLC. She or members of her household own securities of the following companies mentioned in the article: None. She or members of her household are paid by the following companies mentioned in this article: None.

2) The following companies mentioned in this article are billboard sponsors of Streetwise Reports: TAG Oil Ltd. Click here for important disclosures about sponsor fees. As of the date of this article, an affiliate of Streetwise Reports has a consulting relationship with: None. Please click here for more information.

3) Statements and opinions expressed are the opinions of the author and not of Streetwise Reports or its officers. The author is wholly responsible for the validity of the statements. The author was not paid by Streetwise Reports for this article. Streetwise Reports was not paid by the author to publish or syndicate this article. Streetwise Reports requires contributing authors to disclose any shareholdings in, or economic relationships with, companies that they write about. Streetwise Reports relies upon the authors to accurately provide this information and Streetwise Reports has no means of verifying its accuracy.

4) This article does not constitute investment advice. Each reader is encouraged to consult with his or her individual financial professional and any action a reader takes as a result of information presented here is his or her own responsibility. By opening this page, each reader accepts and agrees to Streetwise Reports’ terms of use and full legal disclaimer. This article is not a solicitation for investment. Streetwise Reports does not render general or specific investment advice and the information on Streetwise Reports should not be considered a recommendation to buy or sell any security. Streetwise Reports does not endorse or recommend the business, products, services or securities of any company mentioned on Streetwise Reports.

5) From time to time, Streetwise Reports LLC and its directors, officers, employees or members of their families, as well as persons interviewed for articles and interviews on the site, may have a long or short position in securities mentioned. Directors, officers, employees or members of their immediate families are prohibited from making purchases and/or sales of those securities in the open market or otherwise from the time of the decision to publish an article until three business days after the publication of the article. The foregoing prohibition does not apply to articles that in substance only restate previously published company releases. As of the date of this article, officers and/or employees of Streetwise Reports LLC (including members of their household) own securities of CHECK a company mentioned in this article.

Disclosures for Research Capital Corp., CanAsia Energy Corp., March 2, 2023

Analyst Certification: I, Bill Newman, CFA, certify the views expressed in this report were formed by my review of relevant company data and industry investigation, and accurately reflect my opinion about the investment merits of the securities mentioned in the report. I also certify that my compensation is not related to specific recommendations or views expressed in this report. Research Capital Corporation publishes research and investment recommendations for the use of its clients. Information regarding our categories of recommendations, quarterly summaries of the percentage of our recommendations which fall into each category and our policies regarding the release of our research reports is available at www.researchcapital.com or may be requested by contacting the analyst. Each analyst of Research Capital Corporation whose name appears in this report hereby certifies that (i) the recommendations and opinions expressed in this research report accurately reflect the analyst’s personal views and (ii) no part of the research analyst’s compensation was or will be directly or indirectly related to the specific conclusions or recommendations expressed in this research report.

Relevant Disclosures Applicable to Companies Under Coverage: Relevant disclosures required under IIROC Rule 3400 applicable to companies under coverage discussed in this research report are available on our website at www.researchcapital.ca

General Disclosures: The opinions, estimates and projections contained in all Research Reports published by Research Capital Corporation (“RCC”) are those of RCC as of the date of publication and are subject to change without notice. RCC makes every effort to ensure that the contents have been compiled or derived from sources believed to be reliable and that contain information and opinions that are accurate and complete; RCC makes no representation or warranty, express or implied, in respect thereof, takes no responsibility for any errors and omissions which may be contained therein and accepts no liability whatsoever for any loss arising from any use of or reliance on its Research Reports or its contents. Information may be available to RCC that is not contained therein. Research Reports disseminated by RCC are not a solicitation to buy or sell. All securities not available in all jurisdictions.

Company Specific Disclosures: Within the past 12 months, Research Capital has provided investment banking services to the issuer. The Analyst currently owns or is short shares of the issuer, which represents less than 1% of shares outstanding.

Potential Conflicts of Interest: All Research Capital Corporation (“RCC”) Analysts are compensated based in part on the overall revenues of RCC, a portion of which are generated by investment banking activities. RCC may have had, or seek to have, an investment banking relationship with companies mentioned in this report. RCC and/or its officers, directors and employees may from time to time acquire, hold or sell securities mentioned in our Research Reports as principal or agent. RCC makes every effort possible to avoid conflicts of interest, however readers should assume that a conflict might exist, and therefore not rely solely on this report when evaluating whether or not to buy or sell the securities of subject companies.

RC USA INC.: Information about Research Capital Corporation’s Rating System, the distribution of our research to clients and the percentage of recommendations which are in each of our rating categories is available on our website at www.researchcapital.com. The information contained in this report has been drawn from sources believed to be reliable but its accuracy or completeness is not guaranteed, nor in providing it does Research Capital Corporation assume any responsibility or liability. Research Capital Corporation, its directors, officers and other employees may, from time to time, have positions in the securities mentioned herein. Contents of this report cannot be reproduced in whole or in part without the express permission of Research Capital Corporation. US Institutional Clients – Research Capital USA Inc., a wholly owned subsidiary of Research Capital Corporation, accepts responsibility for the contents of this report subject to the terms and limitations set out above. US firms or institutions receiving this report should effect transactions in securities discussed in the report through Research Capital USA Inc., a Broker – Dealer registered with the Financial Industry Regulatory Authority (FINRA).

Murrey Math Lines 03.03.2023 (Brent, S&P 500)

By RoboForex.com

BRENT

On H4, the quotes have broken through the 200-day Moving Average and are now above it, revealing possible development of an uptrend. The RSI is testing the support level. As a result, we are to expect an upward breakaway of 6/8 (84.38), followed by growth to the resistance level of 8/8 (87.50). The scenario can be cancelled by a downward breakaway of the support level of 5/8 (82.81). In this case, the pair may return to 4/8 (81.25).

BRENTH4
Risk Warning: the result of previous trading operations do not guarantee the same results in the future

On M15, the upper line of VoltyChannel is broken away, which increases the probability of further growth of the price.

BRENT_M15
Risk Warning: the result of previous trading operations do not guarantee the same results in the future

S&P 500

On H4, the quotes are under the 200-day Moving Average, which indicates prevalence of a downtrend. The RSI has pushed off the resistance line. A test of 1/8 (3945.3) is expected, followed by a breakaway and decline to the support level of 0/8 (3906.2). The scenario can be cancelled by rising above the resistance level of 2/8 (3984.4). In this case, the index may rise to 3/8 (4023.4).

S&P 500_H4
Risk Warning: the result of previous trading operations do not guarantee the same results in the future

On M15, the decline can additionally be confirmed by a breakaway of the lower border of VoltyChannel.

S&P 500_M15

Article By RoboForex.com

Attention!
Forecasts presented in this section only reflect the author’s private opinion and should not be considered as guidance for trading. RoboForex LP bears no responsibility for trading results based on trading recommendations described in these analytical reviews.

Crude Oil Couldn’t Care Less About “Fundamentals”

Instead, here’s historic evidence it adheres to Elliott waves

By Elliott Wave International

If there’s one financial market that investors evaluate based on “market fundamentals,” it’s crude oil.

This Feb. 10 Reuters news item provides an example:

Oil may resume its rally in 2023 as Chinese demand recovers after COVID curbs were scrapped and lack of investment limits growth in supply, OPEC country officials told Reuters, with a growing number seeing a possible return to $100 a barrel.

Of course, whether the price of crude oil rises to $100 this year remains to be seen. The point is to show you a typical forecast based on “fundamentals.”

Yet, over the decades, there have been scores of crude oil forecasts based on “fundamentals” which have simply not panned out. Indeed, quite a few times, prices will move in the opposite direction from the consensus of the “fundamentalists.”

However, Elliott Wave International has observed that crude oil tends to follow Elliott wave patterns of investor psychology.

Let’s look at a historical example. Back in 2008, crude hit an all-time high of almost $150 a barrel. Predictably, the mainstream saw more upside; calls for $200 a barrel were common. But here’s a chart from our June 2008 Global Market Perspective with the “5” wave label (indicating an Elliott wave end to oil’s rise). The commentary from that issue is below the chart:

The fifth wave has carried to the upper line, which signals that the rally is nearing an end. Oftentimes, prices will “throw over” the upper channel for a brief period.

As you can see at the bottom of the chart, the Daily Sentiment Index (courtesy trade-futures.com) revealed that 90% of traders were expecting oil’s price to keep rising. Many energy observers were citing “fundamentals” as the reason why. Meanwhile, both Elliott waves and sentiment agreed: A major top was near.

Indeed, a dramatic “throw over” did occur as crude oil topped a little more than month later. Prices then plummeted 78% in just 5 months, as this chart shows:

Mind you, no analytical method can offer a guarantee about a financial market, and that includes the Elliott wave method.

That said, Elliott wave patterns are far preferrable to “fundamentals” as a way of anticipating crude oil’s turns and trends.

If you’d like to learn how the Elliott wave method can help you in your analysis of financial markets, read Elliott Wave Principle: Key to Market Behavior — the Wall Street classic by Frost & Prechter. Here’s a quote from the book:

Although it is the best forecasting tool in existence, the Wave Principle is not primarily a forecasting tool; it is a detailed description of how markets behave. Nevertheless, that description does impart an immense amount of knowledge about the market’s position within the behavioral continuum and therefore about its probable ensuing path. The primary value of the Wave Principle is that it provides a context for market analysis. This context provides both a basis for disciplined thinking and a perspective on the market’s general position and outlook. At times, its accuracy in identifying, and even anticipating, changes in direction is almost unbelievable.

If you’d like to read the entire online version of the book, you may do so for free once you join Club EWI, the world’s largest Elliott wave educational community. A Club EWI membership costs nothing, yet members enjoy complimentary access to a wealth of Elliott wave resources on investing and trading without any obligation.

Become a Club EWI member now and enjoy the benefits, including free access to Elliott Wave Principle: Key to Market Behavior (just follow this highlighted link to get started).

This article was syndicated by Elliott Wave International and was originally published under the headline Crude Oil Couldn’t Care Less About “Fundamentals”. EWI is the world’s largest market forecasting firm. Its staff of full-time analysts led by Chartered Market Technician Robert Prechter provides 24-hour-a-day market analysis to institutional and private investors around the world.

How the west is finally hitting back against China’s dominance of cleantech

By Michael Jacobs, University of Sheffield 

Climate change policy has entered a new era. The growing row between the United States and the European Union over the impacts of the new American green subsidy regime makes that all too clear. Yet in many ways, this story is ultimately about China.

For the last 20 years, developed countries have used three main types of policy to cut their greenhouse gas emissions. Renewable energy mandates have required electricity generators to invest in solar, wind, hydro and geothermal power. Emissions trading schemes for energy and industrial businesses put a price on carbon. And energy efficiency standards have been progressively improved on a whole range of products from vehicles and white goods to homes.

Applied across Europe and North America, this policy toolkit brought notable success. Developed countries’ emissions fell sharply, even with economic growth. Green technologies – from wind and solar to electric vehicles – fell in cost and improved in performance as demand for them rose.

A virtuous circle followed: climate policy increased demand for green technologies, which reduced costs, which allowed policy to be tightened, which stimulated demand and innovation further.

The rub

There were two problems, however. First, much of the economic benefit went to China. From 2010 onwards China rapidly became the world’s primary supplier of wind and solar technology, along with underpinning minerals like lithium, cobalt and rare earths.

China’s dominance reduced everyone’s costs. But it also meant that, as industrial jobs were lost in developed countries, they were not replaced by equivalents in the new energy sectors.

Second, climate policy began to create political opposition. As emissions targets tightened, countries started to see the costs reflected in consumer prices.

The most dramatic response emerged in France in 2018, when a relatively small increase in fuel duty led the so-called gilets jaunes (yellow jacket) protestors to block roads across the country for over a year, even after President Emmanuel Macron withdrew the tax. In the US, congressional opposition stymied President Barack Obama’s plans for a climate bill – including a modest carbon pricing scheme – for the whole of his presidency.

Joe Biden has learned the lesson. His Inflation Reduction Act (IRA), passed in 2022, offers climate carrots instead of sticks – and lots of them.

The act – which despite its name is almost entirely about climate change – offers a mammoth US$369 billion (£306 billion) of tax credits and other subsidies to companies making low-carbon investments and to consumers buying green products. Critically, to take advantage of subsidies, a significant proportion of materials and equipment used must be produced in North America.

The EU position

Orthodox economists deplore the IRA. Subsidies are much less efficient than taxes (not to say more expensive), and protectionism raises costs to consumers.

Yet to any politician, Biden’s approach looks like a no-brainer. Don’t penalise businesses with carbon levies: reward them with tax credits. Don’t allow the employment benefits of climate policy to leak overseas to China: ensure they stay at home. Nearly three-quarters of Americans backed the act, including over half of Republicans.

The EU is alarmed at the likely effects. There are al ready reports of European cleantech companies planning to transfer production to the US, while others may be kept out of US markets. The European Commission has threatened the US with legal action at the World Trade Organization for breaking free trade rules, and has already secured US concessions, including extending tax credits to foreign-made electric vehicles.

Even more significantly, the commission president Ursula von der Leyen has announced a “green deal industrial plan” for the EU. The core will be a Net Zero Industry Act relaxing rules on state aid and providing subsidies for cleantech investment. Meanwhile, a Critical Raw Materials Act will build partnerships with like-minded suppliers to reduce dependence on Chinese imports, mirroring what the recent EU and US chips acts do with semiconductors.

The broader context

Both the EU and US are therefore turning climate policy into industrial and trade strategy. One might ask what took them so long. China’s twelfth five year plan in 2010 first identified seven environmental “strategic industries” on which to focus economic development. It is not a coincidence that China rapidly came to dominate the new low carbon sectors: it was literally the plan.

The EU and US moves are a desperate attempt to catch up, with Japan and South Korea not far behind. And the strategy extends beyond their own continents. The new kids on this block are multi-billion dollar just energy transition partnerships which the EU, US and other western powers have recently negotiated with South Africa, Indonesia and Vietnam.

These “JET-Ps” aim to stimulate investment, not just in the renewables transition but also in domestic industrial capacity. Loans and guarantees provided by western governments aim to leverage much larger flows of private finance. The goal is for these countries to manufacture and export their own green technologies, charting a new path for economic development.

More such partnerships will likely be announced over the coming year. This is not altruism on western countries’ part, but an attempt to offer an alternative to China’s huge investments in the developing world.

What about the UK? These developments leave the British economy in a badly weakened position. The EU was the obvious partner in green industrial policy. On its own the UK is not nearly large enough to compete.

It creates a compelling case for a future UK government to do a green trade deal with the EU. In return for a financial contribution to the EU’s green innovation funds, the UK could rejoin the single market for environment goods and services.

Just a few years ago, climate change was a subset of environmental policy. Today it is a key dimension of both economic strategy and geopolitics. Given the extent of the economic transformation it demands, no-one should be surprised.The Conversation

About the Author:

Michael Jacobs, Professor of Political Economy, University of Sheffield

This article is republished from The Conversation under a Creative Commons license. Read the original article.

EU poised to copy US subsidies for green technology – new evidence from China shows how it could backfire

By Jun Du, Aston University and Holger Görg, Kiel Institute for the World Economy 

The EU is preparing to abandon its longstanding restrictions on state aid to take on US and Chinese subsidies over green technologies. European Commission president Ursula von der Leyen is spearheading a new commitment from EU leaders to “act decisively to ensure its long-term competitiveness, prosperity and role on the global stage”.

She has talked about the need to counter hidden subsidies from the Chinese, both in green tech and in other sectors, though the trigger for the EU’s new approach is really President Joe Biden’s Inflation Reduction Act (IRA). This has committed the US to a record US$369 billion (£305 billion) to green its economy, including using tax breaks and subsidies.

It effectively tears up the international consensus around not using state aid, embracing what the US has railed against for years. The Economist has said that globalisation is no longer about racing, but racing and tripping others.

The EU is now proposing to introduce its own tax credits and subsidies for cleantech companies, as well as fast-tracking regulation in this area.

Meanwhile, the UK has been coming under pressure from the likes of car manufacturers to respond. So far, it has been trying to find exemptions to the US’s general approach of only offering incentives to products made in America, while also claiming the UK has no need to subsidise these kinds of areas because it is already ahead.

The economics of this drift to protectionism are worrying. Our recent research on the effects of state subsidies in China suggest that such policies could do the US and EU economies more harm than good overall.

There’s a reason why the west has long avoided state aid.
Shaun Dakin/Unsplash

What the research says

Since the dawn of the industrial revolution, states have played a significant role in developing their economies. China is the recent prime example, where the use of subsidies to develop particular industries such as electric cars or solar panels has been highly visible.

India seems to be moving in the same direction. The government is paying half of the cost of making computer chips, among a variety of incentives to encourage investment in different sectors.

Equally, in the developed world, government procurement has driven many world-changing innovations. Whole sectors such as biotech and information technology relied on government procurement to get started. America’s Silicon Valley originally grew on the back of military contracts, for instance.

Research in this area does acknowledge a case for subsidising infant industries in which a country wants to specialise. China’s state subsidies in the steel and solar panel industries would be a good example.

Yet there is a price to be paid: the money a government spends means that less will be available for helping its citizens in other ways. For example Brazil’s wheat-industry subsidies in the 1980s were estimated to have produced a net loss of 15% to welfare spending.

Around the same time, it was estimated that if the EU removed the common agricultural policy, the extra money available for government spending could increase real incomes by between 0.3% and 3.5% as a proportion of GDP. Findings like these probably explain why the World Trade Organization has discouraged state aid for decades.

Consequences

The new green subsidies will create winners and losers at different levels. Within the EU, for example, it will un-level the playing field between member states. Those that can afford to spend more on their green tech industries will potentially crowd out those with less.

Even within a country, there’s unlikely to be a win-win. Our research team has recently published a paper about China’s subsidies, using a new approach that makes it possible to estimate the direct and indirect effects on subsidised and non-subsidised firms at the same time.

This is the first time anyone has looked at subsidies in this way. Our project looked at 1998-2007, since those were the years where the necessary data was available.

We found that subsidised firms become relatively more productive, thus making them more competitive. Yet firms that are not subsidised can see their productivity growth reduced.

The determining factor is whether they operate in a geographical cluster alongside subsidised firms. When more than a quarter of firms in a cluster in China were being subsidised, the remainder suffered.

Those losing out were typically foreign-owned firms and those owned by the Chinese state, while private Chinese firms were the beneficiaries.

When we aggregated all the data, it showed that this negative indirect effect tends to dominate. In other words, subsidies produce unintended losers and make the market less competitive and more inefficient as a whole.

The bottom line is, subsidies are not without problems, even for China. In the last decade we have seen what “losers” can do to an economy, or a society – think of movements towards populism and autocracy in many places.

Therefore, there needs to be a more thorough debate about the benefits and costs of subsidies before states apply them, and some carefully designed policies to prepare for the potential losers.The Conversation

About the Authors:

Jun Du, Professor of Economics, Centre Director of Centre for Business Prosperity (CBP), Aston University and Holger Görg, Acting President, Kiel Institute for the World Economy

This article is republished from The Conversation under a Creative Commons license. Read the original article.


The war in Ukraine hasn’t left Europe freezing in the dark, but it has caused energy crises in unexpected places

By Amy Myers Jaffe, New York University 

Through a year of war in Ukraine, the U.S. and most European nations have worked to help counter Russia, in supporting Ukraine both with armaments and in world energy markets. Russia was Europe’s main energy supplier when it invaded Ukraine, and President Vladimir Putin threatened to leave Europeans to freeze “like a wolf’s tail” – a reference to a famous Russian fairy tale – if they imposed sanctions on his country.

But thanks to a combination of preparation and luck, Europe has avoided blackouts and power cutoffs. Instead, less wealthy nations like Pakistan and India have contended with electricity outages on the back of unaffordably high global natural gas prices. As a global energy policy analyst, I see this as the latest evidence that less wealthy nations often suffer the most from globalized oil and gas crises.

I believe more volatility is possible. Russia has said that it will cut its crude oil production starting on March 1, 2023, by 500,000 barrels per day in response to Western energy sanctions. This amount is about 5% of its current crude oil production, or 0.5% of world oil supply. Many analysts expected the move, but it raises concerns about whether more reductions could come in the future.

Europe has avoided an energy crisis in the winter of 2022-2023, but the coming year could be more challenging.

How Europe has kept the lights on

As Russia’s intent toward Ukraine became clear in late 2021 and early 2022, many governments and energy experts feared one result would be an energy crisis in Europe. But one factor that Putin couldn’t control was the weather. Mild temperatures in Europe in recent months, along with proactive conservation policies, have reduced natural gas consumption in key European markets such as Germany, the Netherlands and Belgium by 25%.

With less need for electricity and natural gas, European governments were able to delay drawing on natural gas inventories that they built up over the summer and autumn of 2022. At this point, a continental energy crisis is much less likely than many forecasts predicted.

European natural gas stockpiles are around 67% full, and they will probably still be 50% full at the end of this winter. This will help the continent position itself for next winter as well.

The situation is similar for coal. European utilities stockpiled coal and reactivated 26 coal-fired power plants in 2022, anticipating a possible winter energy crisis. But so far, the continent’s coal use has risen only 7%, and the reactivated coal plants are averaging just 18% of their operating capacity

The U.S. role

Record-high U.S. energy exports in the summer and fall of 2022 also buoyed European energy security. The U.S. exported close to 10 million cubic meters per month of liquefied natural gas in 2022, up 137% from 2021, providing roughly half of all of Europe’s imported LNG.

Although domestic U.S. natural gas production surged to record levels, some producers had the opportunity to export into high-priced global markets. As a result, surpluses of summer natural gas didn’t emerge inside the U.S. market, as might otherwise have happened. Combined with unusually hot summer temperatures, which drove up energy demand for cooling, the export surge socked U.S. consumers with the highest natural gas prices they had experienced since 2008.

Prices also soared at U.S. gas pumps, reaching or exceeding US$5 per gallon in the early summer of 2022 – the highest average ever recorded by the American Automobile Association. The U.S. exported close to 1 million barrels per day of gasoline, mainly to Mexico and Central America, plus some to France, and consolidated its position as a net oil exporter – that is, it exports more oil than it imports.

Much like Europeans, U.S. consumers had to pay high prices to outbid other global consumers for oil and natural gas amid global supply disruptions and competition for available cargoes. High gasoline prices were a political headache for the Biden administration through the spring and summer of 2022.

However, these high prices belied the fact that U.S. domestic gasoline use has stopped growing. Forecasts suggest that it will decline further in 2023 and beyond as the fuel economy of U.S. cars continues to improve and the number of electric vehicles on the road expands.

While energy prices were a burden, especially to lower-income households, European and American consumers have been able to ride out price surges driven by the war in Ukraine and have so far avoided actual outages and the worst recessionary fears. And their governments are offering big economic incentives to switch to clean energy technologies intended to reduce their nations’ need for fossil fuels.

Developing nations priced out

The same can’t be said for consumers in developing nations like Pakistan, Bangladesh and India, who have experienced the energy cutoffs that were feared but didn’t occur in Europe. Notably, Europe’s intensive energy stockpiling in the summer of 2022 caused a huge jump in global prices for liquefied natural gas. In response, many utilities in less developed nations cut their natural gas purchases, creating price-related electricity outages in some regions.

Faced with continuing high global energy prices, countries in the global south – Africa, Asia and Latin America – have had to reevaluate their dependence on foreign imports. Increased use of coal has made headlines, but renewable energy is starting to offer greater advantages, both because it is more affordable and because governments can frame it as more secure and a source of domestic jobs.

India, for example, is doubling down on renewable energy, unveiling plans to produce hydrogen fuel for heavy industry using renewable energy and moving away from imported LNG. Several African countries, such as Ethiopia, are fast-tracking development of hydropower.

Energy prices and climate justice

The energy challenge that the Russia-Ukraine crisis has bred in developing countries has intensified global discussions about climate justice. One less examined impact of giant clean tech stimulus plans enacted in wealthy nations, such as the United States’ Inflation Reduction Act, is that they keep much of the available funding for climate finance at home. As a result, some developing country leaders worry that a clean energy technology knowledge gap will widen, not shrink, as the energy transition gains momentum.

Worsening the problem, members of the G-7 forum of wealthy nations have tightened their monetary policies to control war-driven inflation. This drives up the cost of debt and makes it harder for developing countries to borrow money to invest in clean energy.

The U.S. is supporting a new approach called Just Energy Transition Partnerships, in which wealthy nations provide funding to help developing countries shift away from coal-fired power plants, retain workers and recruit private-sector investors to help finance decarbonization projects. But these solutions are negotiated bilaterally between individual countries, and the pace is slow.

When nations gather in the United Arab Emirates in late 2023 for the next round of global climate talks, wealthy nations – including Middle East oil producers – will face demands for new ways of financing energy security improvements in less wealthy countries. The world’s rich nations pledged in 2009 to direct $100 billion yearly to less wealthy nations by 2020 to help them adapt to climate change and decarbonize their economies, but are far behind on fulfilling this promise.

U.N. Secretary-General Antonio Guterres has called on developed nations to tax fossil fuel companies, which reported record profits in 2022, and use the money to fund climate adaptation in low-income countries. New solutions are needed, because without some kind of major progress, wealthy nations will continue outbidding developing nations for the energy resources that the world’s most vulnerable people desperately need.The Conversation

About the Author:

Amy Myers Jaffe, Director, Energy, Climate Justice, and Sustainability Lab, and Research Professor, New York University

This article is republished from The Conversation under a Creative Commons license. Read the original article.

Oil & Gas Co. With US Assets Has Solid 2022

Source: Stephane Foucaud  (2/16/23)

The 2023 outlook for this energy firm is positive, with production to come from the Williston basin and possibly the Paradox basin, too, noted an Auctus Advisors report.

Zephyr Energy Plc.’s (ZPHRF:OTCMKTS;ZPHR:LSE) full-year 2022 (FY22) production and income were in line with guidance and forecasts, reported Auctus Advisors analyst Stephane Foucaud in a Feb. 15 research note. The oil and gas company is about to start production testing a well in Utah’s Paradox basin.

Potential 228% Return

Auctus has a target price of £0.20 per share on England-based Zephyr. This implies a potential return for investors of 228%, given the energy firm’s current share price is £0.06, noted Foucaud.

“Success in [Cane Creek’s] C-9 reservoir around year-end 2023 could add a further £0.12 per share [to the target price], the analyst added. Cane Creek is in Utah’s Paradox basin.

Strong Production, Revenue

The analyst presented the operational and financial highlights of FY22, all pertaining to work in North Dakota’s Williston basin.

As for Q4/22, Zephyr sold an average of 1,192 barrels of oil equivalent per day (1,192 boe/d). The total average sales volume for FY22 was 1,490 boe/d, which was at the upper end of guidance and met Auctus’ expectations.

“This was achieved despite the fact that [a] number of Zephyr’s existing production wells were temporarily shut in during Q4/22 due to ‘frac-protect’ procedures while new nearby wells were stimulated and completed,” Foucaud explained.

In FY22, Zephyr generated an estimated US$42.9 million (US$42.9M), easily meeting the company’s guidance of US$40–45M. Full-year operating income was as Auctus expected, at US$35.7M.

Work Ahead in Paradox

Looking forward, Zephyr reiterated its guidance for net production in the Williston for 2023, which is 1,550–1,750 boe/d, noted Foucaud.

Also, Zephyr is about to begin production testing of and possibly complete the State 36-2 LNW-CC well in the fractured Cane Creek reservoir interval. The net contingent resource of the part of the reservoir on Zephyr property is 39,250,000 barrels of oil equivalent.

“This is a very important well for the company that could add production and reserves,” commented Foucaud.

Additionally, Auctus expects Cane Creek to generate significant cash flow starting in 2024. The amount will likely equal about 20–40% of Zephyr’s market cap next year and each year thereafter.

Disclosures:
1) Doresa Banning wrote this article for Streetwise Reports LLC and provides services to Streetwise Reports as an independent contractor. She or members of her household own securities of the following companies mentioned in the article: None. She or members of her household are paid by the following companies mentioned in this article: None.

2) The following companies mentioned in this article are billboard sponsors of Streetwise Reports: None. Click here for important disclosures about sponsor fees. The information provided above is for informational purposes only and is not a recommendation to buy or sell any security.

3) Statements and opinions expressed are the opinions of the author and not of Streetwise Reports or its officers. The author is wholly responsible for the validity of the statements. The author was not paid by Streetwise Reports for this article. Streetwise Reports was not paid by the author to publish or syndicate this article. Streetwise Reports requires contributing authors to disclose any shareholdings in, or economic relationships with, companies that they write about. Streetwise Reports relies upon the authors to accurately provide this information and Streetwise Reports has no means of verifying its accuracy.

4) This article does not constitute investment advice. Each reader is encouraged to consult with his or her individual financial professional and any action a reader takes as a result of information presented here is his or her own responsibility. By opening this page, each reader accepts and agrees to Streetwise Reports’ terms of use and full legal disclaimer. This article is not a solicitation for investment. Streetwise Reports does not render general or specific investment advice and the information on Streetwise Reports should not be considered a recommendation to buy or sell any security. Streetwise Reports does not endorse or recommend the business, products, services or securities of any company mentioned on Streetwise Reports.

5) From time to time, Streetwise Reports LLC and its directors, officers, employees or members of their families, as well as persons interviewed for articles and interviews on the site, may have a long or short position in securities mentioned. Directors, officers, employees or members of their immediate families are prohibited from making purchases and/or sales of those securities in the open market or otherwise from the time of the decision to publish an article until three business days after the publication of the article. The foregoing prohibition does not apply to articles that in substance only restate previously published company releases.

Disclosures For Auctus Advisors, Zephyr Energy Plc.,  February 15, 2023

MiFID II Disclosures: This document, being paid for by a corporate issuer, is believed by Auctus to be an ‘acceptable minor non-monetary benefit’ as set out in Article 12 (3) of the Commission Delegated Act C(2016) 2031 which is part of UK law by virtue of the European Union (Withdrawal) Act 2018. It is produced solely in support of our corporate broking and corporate finance business. Auctus does not offer a secondary execution service in the UK. This note is a marketing communication and NOT independent research. As such, it has not been prepared in accordance with legal requirements designed to promote the independence of investment research and this note is NOT subject to the prohibition on dealing ahead of the dissemination of investment research.

Author: The research analyst who prepared this research report was Stephane Foucaud, a partner of Auctus. Not an offer to buy or sell Under no circumstances is this note to be construed to be an offer to buy or sell or deal in any security and/or derivative instruments. It is not an initiation or an inducement to engage in investment activity under section 21 of the Financial Services and Markets Act 2000.

Note prepared in good faith and in reliance on publicly available information: Comments made in this note have been arrived at in good faith and are based, at least in part, on current public information that Auctus considers reliable, but which it does not represent to be accurate or complete, and it should not be relied on as such. The information, opinions, forecasts and estimates contained in this document are current as of the date of this document and are subject to change without prior notification. No representation or warranty either actual or implied is made as to the accuracy, precision, completeness or correctness of the statements, opinions and judgements contained in this document.

Auctus’ and related interests: The persons who produced this note may be partners, employees and/or associates of Auctus. Auctus and/or its employees and/or partners and associates may or may not hold shares, warrants, options, other derivative instruments or other financial interests in the Company and reserve the right to acquire, hold or dispose of such positions in the future and without prior notification to the Company or any other person. Information purposes only

This document is intended to be for background information purposes only and should be treated as such. This note is furnished on the basis and understanding that Auctus is under no responsibility or liability whatsoever in respect thereof, whether to the Company or any other person.

Investment Risk Warning: The value of any potential investment made in relation to companies mentioned in this document may rise or fall and sums realised may be less than those originally invested. Any reference to past performance should not be construed as being a guide to future performance. Investment in small companies, and especially upstream oil & gas companies, carries a high degree of risk and investment in the companies or commodities mentioned in this document may be affected by related currency variations. Changes in the pricing of related currencies and or commodities mentioned in this document may have an adverse effect on the value, price or income of the investment.

Disclaimer: This note has been forwarded to you solely for information purposes only and should not be considered as an offer or solicitation of an offer to sell, buy or subscribe to any securities or any derivative instrument or any other rights pertaining thereto (“financial instruments”). This note is intended for use by professional and business investors only. This note may not be reproduced without the prior written consent of Auctus.

The information and opinions expressed in this note have been compiled from sources believed to be reliable but, neither Auctus, nor any of its partners, officers, or employees accept liability from any loss arising from the use hereof or makes any representations as to its accuracy and completeness. Any opinions, forecasts or estimates herein constitute a judgement as at the date of this note. There can be no assurance that future results or events will be consistent with any such opinions, forecasts or estimates. Past performance should not be taken as an indication or guarantee of future performance, and no representation or warranty, express or implied is made regarding future performance. This information is subject to change without notice, its accuracy is not guaranteed, it may be incomplete or condensed and it may not contain all material information concerning the company and its subsidiaries. Auctus is not agreeing to nor is it required to update the opinions, forecasts or estimates contained herein.

The value of any securities or financial instruments mentioned in this note can fall as well as rise. Foreign currency denominated securities and financial instruments are subject to fluctuations in exchange rates that may have a positive or adverse effect on the value, price or income of such securities or financial instruments. Certain transactions, including those involving futures, options and other derivative instruments, can give rise to substantial risk and are not suitable for all investors. This note does not have regard to the specific instrument objectives, financial situation and the particular needs of any specific person who may receive this note.

Auctus (or its partners, officers or employees) may, to the extent permitted by law, own or have a position in the securities or financial instruments (including derivative instruments or any other rights pertaining thereto) of the Company or any related or other company referred to herein, and may add to or dispose of any such position or may make a market or act as principle in any transaction in such securities or financial instruments. Partners of Auctus may also be directors of the Company or any other of the companies mentioned in this note. Auctus may, from time to time, provide or solicit investment banking or other financial services to, for or from the Company or any other company referred to herein. Auctus (or its partners, officers or employees) may, to the extent permitted by law, act upon or use the information or opinions presented herein, or research or analysis on which they are based prior to the material being published.

Big Oil’s trade group allies outspent clean energy groups by a whopping 27x, with billions in ads and lobbying to keep fossil fuels flowing

By Christian Downie, Australian National University and Robert Brulle, Brown University 

Leer en español.

You’ve probably seen ads promoting gas and oil companies as the solutions to climate change. They’re meant to be inspiring and hopeful, with scenes of a green, clean future.

But shiny ads are not all these companies do to protect their commercial interests in the face of a rapidly heating world. Most also provide financial support to industry groups that are spending hundreds of millions of dollars on political activities, often to thwart polices designed to slow climate change.

For example, The New York Times recently reported on the Propane Education and Research Council’s attempts to derail efforts to electrify homes and buildings in New York, in part by committing nearly US$900,000 to the New York Propane Gas Association, which flooded social media with misleading information about energy-efficient heat pumps.

The American Fuel and Petrochemical Manufacturers, which represents oil refiners and petrochemical firms, has spent millions on public relations campaigns, such as promoting a rollback of federal fuel efficiency standards.

These practices have been going on for decades, and evidence shows that industry groups have played key roles in blocking state and federal climate policies. This matters not just because of the enormous sums the groups are spending, but also because they often act as a command center for political campaigns to kill pro-climate policies.

We study the political activities of industry groups. In a recent research paper, we dug through U.S. tax filings to follow the money trail of trade associations engaged on climate change issues and track the billions they have spent to shape federal policy.

What we found

After NASA scientist James Hansen sounded the alarm on climate change in 1988, three trade associations – the National Association of Manufacturers, the Edison Electric Institute and the American Petroleum Institute – banded together with a couple of electrical utilities to form the Global Climate Coalition, or GCC.

The GCC systematically opposed any international regulation of climate-warming emissions, and successfully prevented the U.S. from ratifying the Kyoto Protocol, a 1997 international agreement to reduce greenhouse gas emissions.

This was the first example of trade associations working together to stall government action on climate change. Similar efforts continue today.

So, how much do trade associations spend on political activities, such as public relations? As not-for-profit organizations under the Internal Revenue Code, trade associations have to report their revenue and spending.

We found that trade associations historically opposed to climate policies spent $2 billion in the decade from 2008 to 2018 on political activities, such as advertising, lobbying and political contributions. Together, they outspent climate-supporting industry groups 27 to 1.

The oil and gas sector was the largest, spending $1.3 billion. Across the 89 trade associations we examined in nine different sectors of the U.S. economy between 2008 and 2018, no other group of trade associations came close.

No. 1 expense: Advertising and promotion

What came as more of a surprise as we were tallying up the data was how much trade associations are spending on advertising and promotion. This can include everything from mainstream media ads promoting the industry to hiring public relations firms to target particular issues before Congress.

For example, until they parted ways last year, Edelman, the world’s largest public relations firm, received close to $30 million from American Fuel and Petrochemical Manufacturers to promote fossil fuels, reporters at the online news site Heated found.

Our study found that trade associations engaged on climate change issues spent a total of $2.2 billion on advertising and promotion between 2008 and 2018, compared with $729 million on lobbying. As 2022 lobbying data shows, their spending continues. While not all of this spending is directly targeting climate policy, climate change is one of the top political issues for many industries in the energy sector.

Media buys are expensive, but these numbers also reflect the specific role trade associations play in protecting the reputation of the firms they represent.

Trade groups run promotional ads for their industries, as well as negative ads.

One reason that groups like the American Petroleum Institute have historically taken the lead running negative public relations campaigns is so that their members, such as BP and Shell, are not tarred with the same brush, as our interviews with industry insiders confirmed.

However, many firms are now coming under pressure to leave trade associations that oppose climate policies. In one example, the oil giant Total quit API in 2021, citing disagreements over climate positions.

Spending on social media in the weeks ahead of the U.S. midterm elections and during the U.N. Climate Conference in November 2022 offers another window into these groups’ operations.

A review by the advocacy group Climate Action Against Disinformation found that 87 fossil-fuel-linked groups spent roughly $3 million to $4 million on more than 3,700 ads through Facebook’s parent company alone in the 12 weeks before and during the conference.

Facebook received millions of dollars to run ads promoting natural gas.

The largest share came from a public relations group representing the American Petroleum Institute and focused heavily on advocating for natural gas and oil and discussing energy security. America’s Plastic Makers spent about $1.1 million on climate-related advertising during the two weeks of the U.N. conference.

Funneling money to think tanks and local groups

Trade associations also spent $394 million on grants to other organizations during the decade we reviewed. For example, they gave money to think tanks, universities, charitable foundations and political organizations like associations of mayors and governors.

While some of these grants may be philanthropic in nature, among the trade associations we spoke to, most have a political purpose in mind. Grants channeled to local community groups, as one example, can help boost an industry’s reputation among key constituent groups, and as a result their social license to operate.

What this means for climate policy

Fossil fuel companies, which reported record profits in 2022, still spend more on political activities than their trade associations do.

But industry groups historically opposed to climate policies are also big spenders, as our research shows. They outspent those that support actions to slow climate change, such as the solar and wind industries, by a whopping $2 billion to $74.5 million over the 10 years we reviewed.

This likely helps to explain why it took Congress almost 35 years after Hansen first warned representatives about the dangers of climate change to pass a major climate bill, the 2022 Inflation Reduction Act.The Conversation

About the Author:

Christian Downie, Associate Professor, Australian National University and Robert Brulle, Professor of Sociology, Brown University

This article is republished from The Conversation under a Creative Commons license. Read the original article.


Brent: One Step Forward, Two Steps Back

By RoboForex Analytical Department

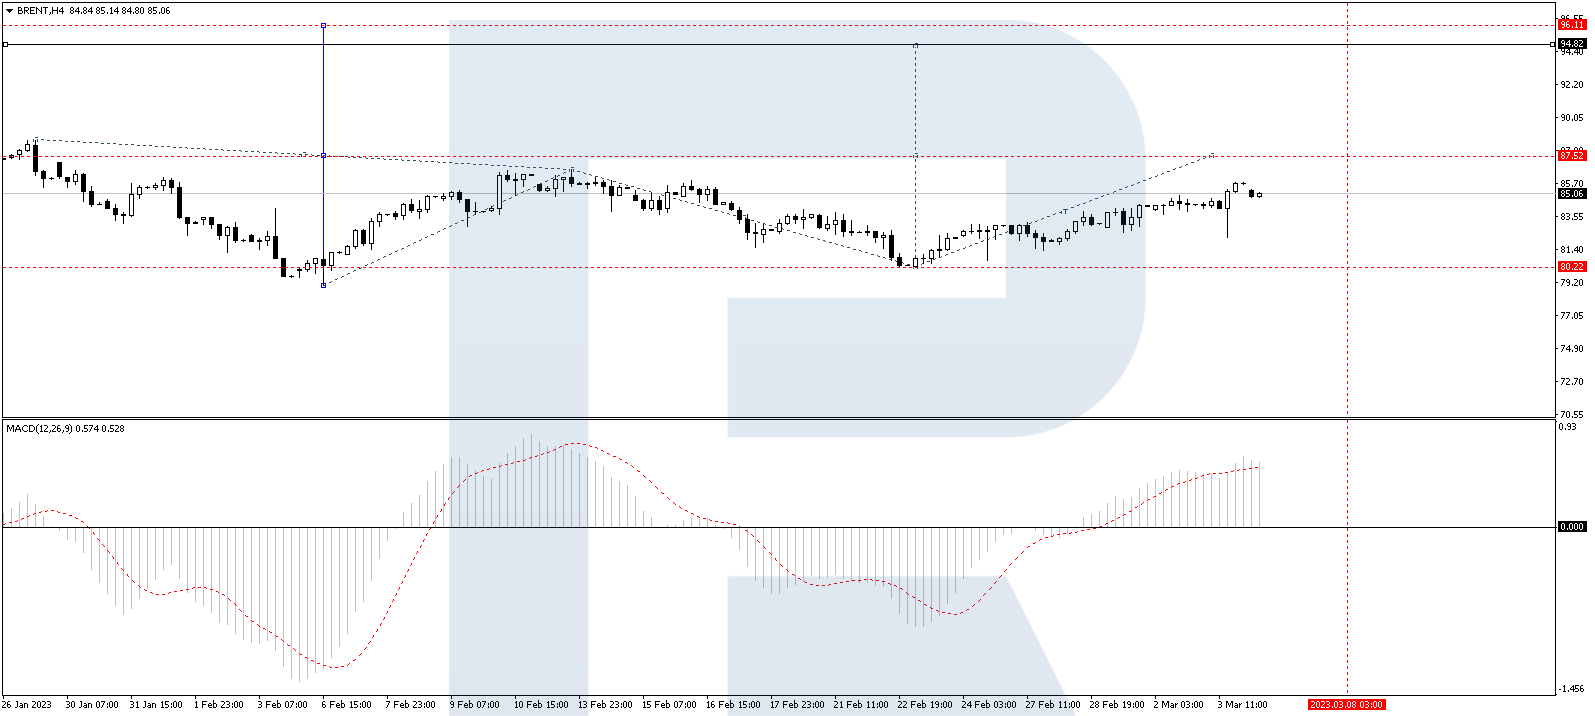
On Monday, a Brent barrel is declining to 85.50 USD.

At the end of last week, crude oil prices grew by almost 2%. This was the market reaction to the decision of the Russian Federation to cut down on oil mining by 0.5 million barrel a day starting March 2023. Decreased production volumes might balance out the supply/demand ratio and will let suppliers wait for the recovery of the Chinese economy without extra emotions.

At the same time, the growth of the USD holds back too obvious growth of oil prices.

Drilling activity in the US has increased. According to Baker Hughes, over a week the number of oil drilling rigs grew by 10 facilities to 609 drilling rigs.

On H4, a wave of growth to 87.60 is continuing. After this level is reached, a correction to the low of 83.30 should become possible, followed by growth to 92.10. The goal is local. Technically, this scenario is confirmed by the MACD. Its signal line is headed strictly upwards to new highs.

On H1, Brent keeps developing the fifth structure of growth to 87.60. After this level is reached, a decline to 82.54 should follow (a test from above), and next – growth to 88.00. Technically, this scenario is confirmed by the Stochastic oscillator. Its signal line is under 20, getting ready to start growing. It should reach 50, break through it and even reach 80.

Disclaimer

Any forecasts contained herein are based on the author’s particular opinion. This analysis may not be treated as trading advice. RoboForex bears no responsibility for trading results based on trading recommendations and reviews contained herein.

Murrey Math Lines 10.02.2023 (Brent, S&P 500)

By RoboForex.com

Brent

On H4, Brent quotes are under the 200-day Moving Average, which indicates prevalence of a downtrend. The RSI is testing the support level. As a result, a bounce off 5/8 (82.81) downwards is expected, followed by falling to the support level of 4/8 (81.25). This scenario can be cancelled by rising over the resistance level of 6/8 (84.38), which might lead to a trend reversal and growth to the resistance level of 7/8 (85.94).

Brent_H4
Risk Warning: the result of previous trading operations do not guarantee the same results in the future

On M15, a new breakaway of the lower border of VoltyChannel will increase the probability of falling on H4.

Brent_M15
Risk Warning: the result of previous trading operations do not guarantee the same results in the future

S&P 500

On H4, the quotes of the index are above the 200-day Moving Average, which reveals prevalence of an uptrend. The RSI is nearing the oversold area. As a result, a test of 4/8 (4062.5) should be expected, followed by growth to the resistance level of 5/8 (4140.6). The scenario can be cancelled by a downward breakaway of the support level of 4/8 (4062.2). In this case, falling may continue, and the quotes may drop to 3/8 (3984.4).

S&P500_H4
Risk Warning: the result of previous trading operations do not guarantee the same results in the future

On M15, the upper line of VoltyChannel is too far away from the current price, so growth will be indicated by a bounce off 4/8 (4062.2) on H4.

S&P500_M15

Article By RoboForex.com

Attention!
Forecasts presented in this section only reflect the author’s private opinion and should not be considered as guidance for trading. RoboForex LP bears no responsibility for trading results based on trading recommendations described in these analytical reviews.