By JustMarkets
At the close of Wednesday, the Dow Jones Index (US30) declined by -0.09%. The S&P 500 (US500) shed -0.53%. The technology-heavy Nasdaq (US100) closed lower by -1.00%. The US stock markets continued their decline on Wednesday, retreating from recent record highs amid mixed corporate reports, conflicting macro data, and rising geopolitical tensions. The technology sector faced the most significant pressure: semiconductor stocks faced a sell-off following reports of restrictions from China, which notably soured overall market sentiment. Macroeconomic statistics failed to pivot the market: moderate inflation and stable consumption only confirmed expectations that the Fed’s current policy will remain unchanged, failing to offset the impact of corporate and political factors. Wells Fargo shares fell by -3.9% after the company missed profit and revenue forecasts. Bank of America shares declined -3.6% despite beating expectations, while Citigroup dropped -0.3% after posting stronger-than-expected earnings and revenue figures. JPMorgan shares fell -0.3%, extending a -4.1% slide from the previous session following disappointing quarterly results.
European equity markets traded without a unified trend on Wednesday. The German DAX (DE40) fell -0.53%, the French CAC 40 (FR40) closed down -0.19%, the Spanish IBEX 35 (ES35) rose by +0.05%, and the British FTSE 100 (UK100) finished Wednesday up +0.46%.
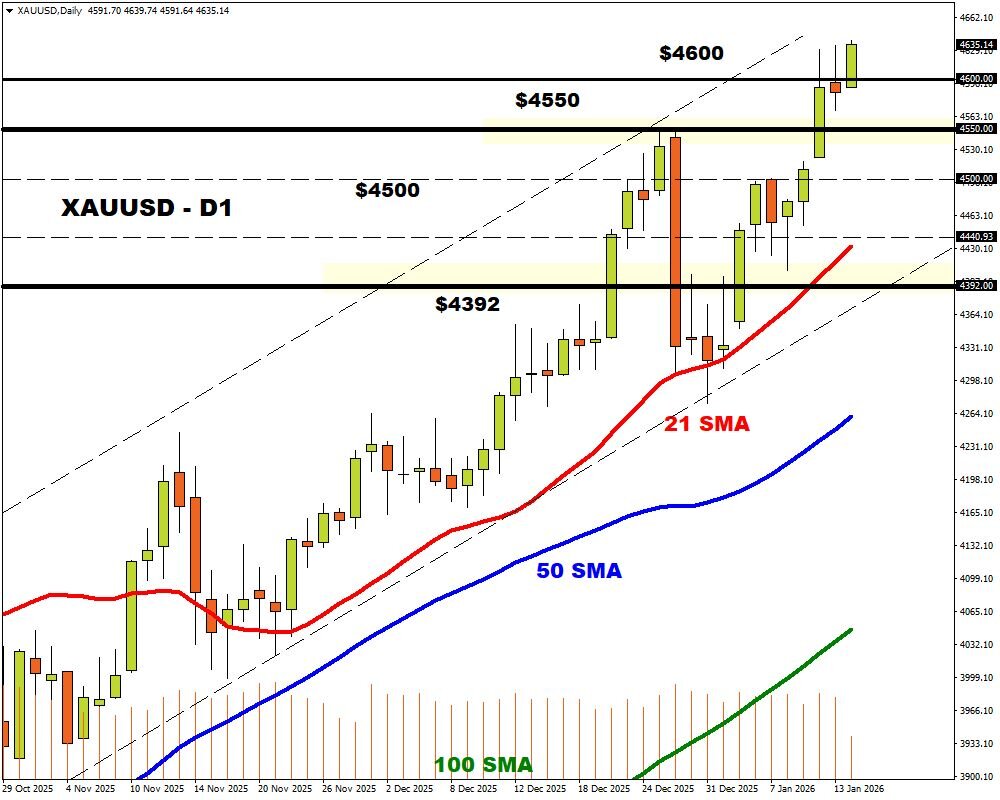
On Thursday, silver prices (XAG) dropped sharply by approximately -6%, falling below $88 per ounce and retreating from recently reached all-time highs. Pressure on prices emerged after US President Donald Trump delayed the introduction of new import duties on critical minerals, reducing short-term geopolitical and trade risks. An additional factor in the decline was the weakened appeal of precious metals as safe-haven assets. Demand waned following Trump’s statements that he had received assurances regarding the cessation of executions of protesters in Iran, which eased fears of potential US military intervention and regional escalation.
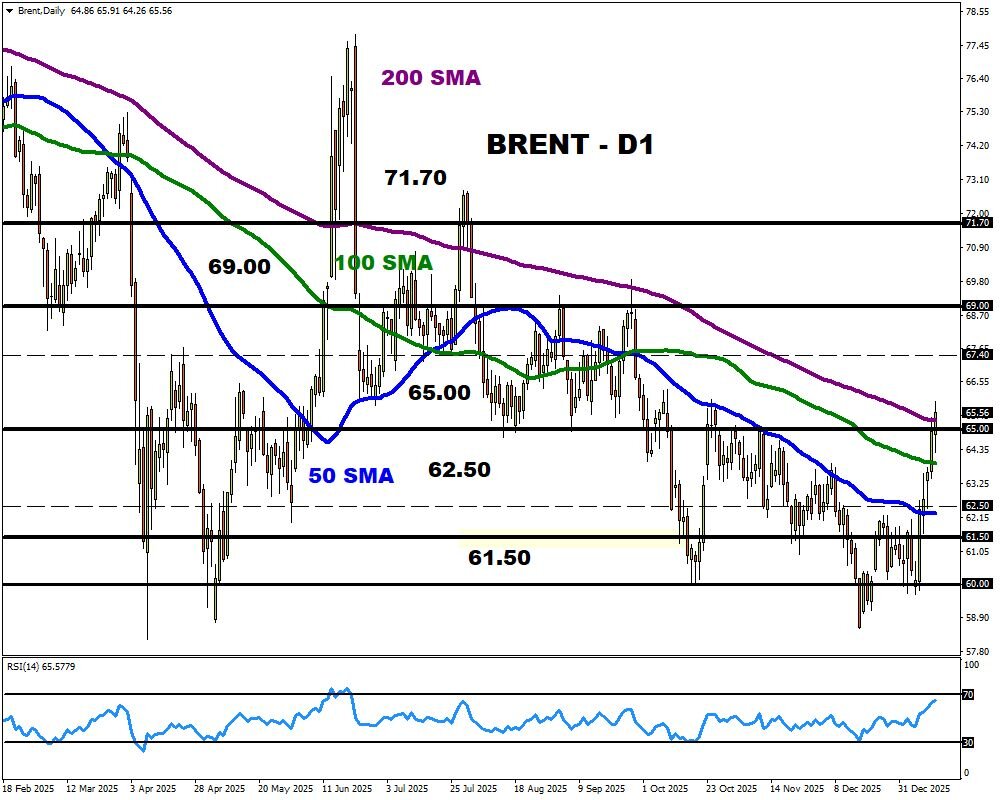
WTI crude oil prices declined by approximately -3% on Thursday to around $60 per barrel, snapping a five-session winning streak. The correction was triggered by easing geopolitical tensions following comments from US President Donald Trump, which lowered expectations of an imminent military strike on Iran. Additional pressure came from EIA data showing a rise in US crude oil and gasoline inventories last week, although distillate stocks decreased. Together, these factors intensified profit-taking and accelerated the reversal of quotes after a prolonged rally.
US natural gas prices (XNG) plunged by -10%, approaching their lowest levels since October 17, due to a reduction in gas flows to LNG export facilities. Gas deliveries to LNG plants on Wednesday dropped to a two-month low of 17.4 billion cubic feet per day (bcfd) due to reduced supplies to Cheniere Energy’s Corpus Christi plant and the Freeport LNG plant.
Asian markets mostly rose yesterday. The Japanese Nikkei 225 (JP225) gained +1.48%, the Chinese FTSE China A50 (CHA50) fell by -1.04%, Hong Kong’s Hang Seng (HK50) climbed +0.56%, and the Australian ASX 200 (AU200) posted a positive result of +0.14% yesterday. On Wednesday, PRC regulators raised minimum margin requirements for stock transactions from 80% to 100%, effectively restricting leverage and highlighting Beijing’s commitment to curbing excessive speculation and systemic risks in capital markets.
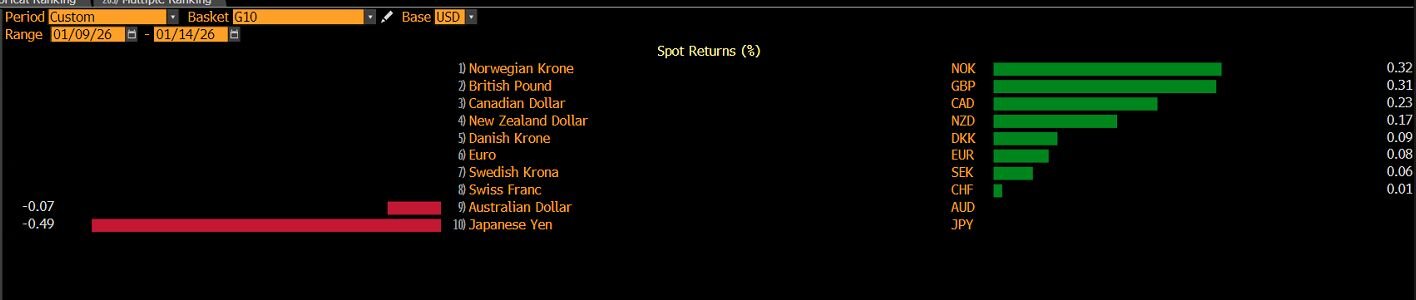
On Thursday, the Australian dollar (AUD) traded virtually unchanged near $0.668, holding close to a two-week low. Australian consumer inflation expectations remained at a high level of 4.6% in January, virtually unchanged from December, indicating persistent concerns over rising prices. Nevertheless, markets remain skeptical of imminent policy tightening: the probability of a Reserve Bank of Australia rate hike in February is estimated at approximately 27%, while it rises to about 76% by May.
S&P 500 (US500) 6,926.60 −37.14 (−0.53%)
Dow Jones (US30) 49,149.63 −42.36 (−0.09%)
DAX (DE40) 25,286.24 −134.42 (−0.53%)
FTSE 100 10,184.35 +47.00 (+0.46%)
USD Index 99.10 (−0.04%)
News feed for: 2026.01.15
- Japan Producer Price Index (m/m) at 01:50 (GMT+2); – JPY (MED)
- UK GDP (m/m) at 09:00 (GMT+2); – GBP (HIGH)
- UK Industrial Production (m/m) at 09:00 (GMT+2); – GBP (MED)
- UK Trade Balance (m/m) at 09:00 (GMT+2); – GBP (MED)
- Eurozone Industrial Production (m/m) at 12:00 (GMT+2); – EUR (LOW)
- Eurozone Trade Balance (m/m) at 12:00 (GMT+2); – EUR (MED)
- US Initial Jobless Claims (w/w) at 15:30 (GMT+2); – USD (MED)
- US Natural Gas Storage (w/w) at 17:30 (GMT+2). – XNG (HIGH)
By JustMarkets
This article reflects a personal opinion and should not be interpreted as an investment advice, and/or offer, and/or a persistent request for carrying out financial transactions, and/or a guarantee, and/or a forecast of future events.