Archive for Economics & Fundamentals – Page 127

Investors are waiting for tech giants’ reports. Indices are rising on lower inflationary pressures around the world

By JustMarkets

The US indices closed higher on Monday as shares of major technology companies and chipmakers were on the upside ahead of reports from tech giants. At Monday’s close, the Dow Jones Index (US30) increased by 0.73%, and the S&P 500 Index (US500) added 1.19%. NASDAQ Technology Index (US100) gained 2.01% yesterday.

Barclays Bank upgraded AMD (AMD), Qualcomm Incorporated (QCOM), and NVIDIA Corporation (NVDA) forecasts, raising shares by more than 9%, 6%, and 7%, respectively.

The Federal Reserve’s slowdown in interest rate hikes is becoming obvious. According to the latest Federal Reserve CME data, the US Federal Reserve is set to raise interest rates by 25 basis points at the FOMC meeting on February 1 and another 25 basis points at its next meeting in March. The US central bank will then hold rates until the fourth quarter. Investors also expect a US rate cut of about 50 basis points at the end of the year.

Stock markets in Europe mostly rose Monday. Germany’s DAX (DE30) gained 0.46%, France’s CAC 40 (FR40) added 0.52%, Spain’s IBEX 35 Index (ES35) jumped by 0.29%, Britain’s FTSE 100 (UK100) closed up by 0.18% yesterday.

According to Governing Council spokesman Klaas Knot, the European Central Bank should continue to raise interest rates by 0.5% at its next two meetings, and the time for slowing the pace of increases is “still a long way off.” The hawkish head of the Dutch central bank had already argued last week for the ECB to continue tightening policy, arguing that core inflation is still rising, even though the basic indicator is slowing.

China has been setting the trend for oil prices lately. The reopening of China’s economy has led to an increase in demand, which at the current supply level has given an impulse to oil prices. This week is a holiday week in China, so oil quotes will depend on the current demand/supply and the dynamics of the dollar index. Analysts expect a spike in COVID-19 cases after the holidays as the Chinese travel freely for the first time in three years.

Asian markets mostly rose yesterday. Japan’s Nikkei 225 (JP225) added 1.33%, and China’s FTSE China A50 (CHA50) was not trading and will not trade for the rest of the week due to the holiday. Hong Kong’s Hang Seng (HK50) was also not trading yesterday, India’s NIFTY 50 (IND50) increased by 0.50%, and Australia’s S&P/ASX 200 (AU200) ended the day up by 0.07%.

In Australia, the manufacturing PMI index dipped below the 50 mark for the first time. The index fell from 50.2 to 49.8. The service sector PMI rose from 47.3 to 48.3. Tomorrow’s quarterly CPI data will be scrutinized for clues to the Reserve Bank of Australia’s interest rate decision. A survey of economists suggests that the overall Consumer Price Index will rise from 7.6% to 7.8% year-over-year. Rising inflation will undoubtedly force the RBA to act more aggressively.

S&P 500 (F) (US500) 4,019.65 +47.04 (+1.18%)

Dow Jones (US30) 33,628.84 +253.35 (+0.76%)

DAX (DE40) 15,102.95 +69.39 (+0.46%)

FTSE 100 (UK100) 7,784.67 +14.08 (+0.18%)

USD Index 102.07 +0.06 (+0.06%)

Important events for today:
  • – Australia Manufacturing PMI (m/m) at 00:00 (GMT+2);
  • – Australia Services PMI (m/m) at 00:00 (GMT+2);
  • – Japan Manufacturing PMI (m/m) at 02:30 (GMT+2);
  • – Japan Services PMI (m/m) at 02:30 (GMT+2);
  • – French Manufacturing PMI (m/m) at 10:15 (GMT+2);
  • – French Services PMI (m/m) at 10:15 (GMT+2);
  • – Germany Manufacturing PMI (m/m) at 10:30 (GMT+2);
  • – Germany Services PMI (m/m) at 10:30 (GMT+2);
  • – Eurozone Manufacturing PMI (m/m) at 11:00 (GMT+2);
  • – Eurozone Services PMI (m/m) at 11:00 (GMT+2);
  • – UK Manufacturing PMI (m/m) at 11:30 (GMT+2);
  • – UK Services PMI (m/m) at 11:30 (GMT+2);
  • – Eurozone ECB President Lagarde Speaks at 11:45 (GMT+2);
  • – US Manufacturing PMI (m/m) at 16:45 (GMT+2);
  • – US Services PMI (m/m) at 16:45 (GMT+2);
  • – New Zealand Consumer Price Index (q/q) at 23:45 (GMT+2).

By JustMarkets


This article reflects a personal opinion and should not be interpreted as an investment advice, and/or offer, and/or a persistent request for carrying out financial transactions, and/or a guarantee, and/or a forecast of future events.

Positive US Rate Outlook Boosts Risk Sentiment

By ForexTime

Asian shares rose on Tuesday, following the positive cues from Wall Street overnight as growth stocks looked enticing ahead of major tech earnings. Mounting expectations over a less aggressive Federal Reserve stimulated appetite for risk, magnetising investors towards the equity space. However, markets in mainland China and Taiwan remain closed for the Lunar New Year holiday and reopen for trading on January 30. European futures are pointing to a positive open this morning after finishing higher in the previous session, and this could trickle back down to Wall Street later today.

In the currency space, the dollar ticked lower while the euro is lingering below 1.09 after yesterday’s attempted breakout. Oil bulls seem to be drawing strength from rising demand hopes as China’s economy reopens, while gold remains supported by US recession fears and bets of slower rate hikes in 2023.

The next few days promise to be eventful for equity markets thanks to corporate earnings, with Microsoft reporting its results after the bell today and Tesla releasing its earnings late Wednesday. It is also a data-heavy week with economic reports from Europe and the United States in sharp focus, including PMI surveys today and US fourth quarter GDP on Thursday. Regarding central bank meetings, all eyes will be on the Bank of Canada rate decision tomorrow which is expected to conclude with a 25-basis point rate hike.

EURUSD gearing up for a breakout?

This could be a volatile week for EURUSD thanks to key economic data and speeches from financial heavyweights.

The discussions around monetary policy among officials at the Federal Reserve and European Central Bank continue, with focus increasingly drawn to their policy meetings next week. On one side of the coin, the euro continues to draw strength from a weaker dollar, high inflation in the Eurozone, and a hawkish ECB. On the other side, repeated signs of easing inflation in the US have fueled speculation around a less aggressive Fed. The narrowing monetary policy divergence between the Fed and ECB could translate to further upside for the already bullish EURUSD.

Much attention will be directed towards not only the pending Eurozone and US January PMIs today, but also ECB President Lagarde’s speech which may influence the currency pair. Regarding the technical picture, prices remain bullish on the daily charts with resistance found at 1.09. A solid breakout and daily close above this point could signal a move toward the next key level of interest at 1.12.

Currency spotlight – GBPUSD

Yesterday was a choppy affair for the GBPUSD as prices bounced within a range just below 1.24. Nevertheless, the outlook remains bullish on the daily charts due to the recent series of consistent higher highs and higher lows. There could be some action on the GBPUSD this morning thanks to the UK and US January PMIs. However, bulls remain in a position of power with support found just above 1.23. If the currency pair has the strength to advance decisively beyond  1.24, an incline toward the 1.26 region could become reality. Should the upside lose steam and dip below 1.23, prices could sink back towards 1.2170.

Commodity spotlight – Gold

Gold bulls continue to draw confidence from US recession fears and expectations around a less aggressive Federal Reserve. The precious metal certainly remains on a roll, securing five consecutive weekly gains, and could push higher if the fundamental drivers remain unchanged. A weaker dollar and soft US economic data could further sweeten appetite for gold over the next few days. Looking at the technical picture, prices remain bullish making fresh 9-month highs this morning and could test $1950 and beyond.


Forex-Time-LogoArticle by ForexTime

ForexTime Ltd (FXTM) is an award winning international online forex broker regulated by CySEC 185/12 www.forextime.com

Inflation hasn’t increased US food insecurity overall, according to our new tracker

By Sam Polzin, Purdue University and Jayson Lusk, Purdue University 

Grocery prices soared by 11.8% in 2022 – the swiftest pace since the early 1980s. Rapid inflation is, naturally, leading to concerns that it’s getting harder for Americans to put food on the table.

Indeed, Feeding America, a nonprofit that supports and connects roughly 60,000 food banks and pantries nationwide, has said that at least half of its members are seeing more demand for their services. And many journalists are reporting about struggling parents waiting in long lines for free food.

We are experts on food and agricultural economics. Together we have created a new data dashboard that tracks U.S. food insecurity – the technical term for having trouble getting enough nutritious food – based on publicly available information.

The data we’re collecting ourselves, as well as the information that we’ve compiled from other sources, including the Census Bureau, isn’t yet reflecting a sharp uptick in households without enough to eat. U.S. food insecurity has remained at troubling and yet relatively flat levels.

Based on all the data we’ve included in our dashboard, we estimate that over the course of 2022 somewhere between 11% and 15% of those living in the U.S. struggled with securing their next meal.

This range relies, in part, on internet-based surveys that can often produce food insecurity estimates that are higher than official government data. Because it is expensive to reach a true random sample of Americans, cheaper online surveys are commonly unrepresentative of the U.S. population but still prove to be a key tool for measuring changes compared with previous online surveys.

Official estimates are delayed and possibly low

Food insecurity is officially assessed based on a series of survey questions developed by the U.S. Department of Agriculture Economic Research Service. Every December, the federal government uses this measure to assess food insecurity for the past year. Following extensive analysis, it releases that data in September of the next year.

The official food insecurity rate hovered around 10.5% from 2019 to 2021, according to the USDA.

During those same three years, however, other researchers detected both lower and much higher rates. Our average of these surveys suggests that national levels may have peaked at nearly 19% in the months following the onset of the COVID-19 pandemic the U.S. in March 2020.

Within about six months, food insecurity returned to the 10%-11% range, based on our average of available data.

A mismatch between the facts and the coverage

Why are reports of long lines at food banks and increased demand for free food apparently at odds with the relative stability in the national food insecurity rate?

One reason could be that food insecurity rates, which generally overlap with social and economic inequality, can differ sharply.

For example, Nassau County, which spans many of New York City’s largely affluent Long Island suburbs, had a food insecurity rate of 5.7% in 2020. In nearby Bronx County, New York state’s lowest-income county, the food insecurity rate was more than three times that, at 19.7%, according to Feeding America’s Map the Meal Gap study.

As a result, food security can get worse or better in particular communities without affecting the national rate.

Another explanation could be that government programs and nonprofits that help people get enough food are succeeding. The number of people getting Supplemental Nutrition Assistance Program benefits, sometimes referred to as “food stamps” and generally just called SNAP, increased by 2.8% from January to October 2022, to 42.3 million.

In some states, SNAP benefits remain at the elevated levels instituted when the COVID-19 pandemic began.

Survey data from our Consumer Food Insights reports also shows that the average length of time households receive SNAP benefits increased from 9.5 months to 12.4 months in 2022.

Nearly 7% of households were visiting food pantries in December 2022, according to the Census Bureau, up from 4.4% in 2019. At the same time, the USDA announced an additional US$2 billion in funding to emergency food providers to deal with elevated food costs.

The charitable food system is decentralized, making it hard if not impossible to determine whether the amount of food donated to Americans overall has changed. As Feeding America reports, the 2.5 billion meals that its network provided in the first half of 2022 came from a range of donors, with its corporate partners playing a big role.

The data further suggests that, while consumer confidence about the overall economy is at a historically low level, fears of an economic downturn don’t reflect the fact that many people still have more money saved up than they did before 2020. Similarly, unemployment, which dipped to 3.5% in December 2022, is at the historically low levels last seen before the COVID-19 pandemic.

Finally, researchers have found that incomes over time and accumulated savings are more closely tied to whether families will experience food insecurity than what their breadwinners currently earn. Because the disposable incomes of many Americans rose in 2020 and 2021, it will probably take a deeper economic shock than the nearly 12% increase in grocery prices registered between December 2021 and December 2022 to make food insecurity soar.

Getting clearer pictures

To be clear, we do not mean to suggest that food insecurity is not a serious issue or that having more than 1 in 10 Americans struggle to get enough to eat is acceptable.

Rather, we noticed that policy and research interest in food insecurity spiked in the year following COVID-19 shutdowns, resulting in much more data on the topic before dwindling in 2021. Today, the public is paying more attention to the topic again.

Food banks and SNAP benefits collectively have provided around $130 billion in annual economic relief for low-income Americans in recent years, a number that includes a sharp increase in benefits. We believe that these efforts are vital.

We propose that conducting and releasing more frequent high-quality surveys would help bring sustained attention to the issue, clarify trends and allow experts like us to make better predictions.

And because all food insecurity surveys are subject to sampling errors and offer only a snapshot regarding a single time frame, we believe that pooling the multiple surveys featured in our data dashboard can better inform policymakers and charities that seek to address food insecurity and rapidly respond when levels spike.The Conversation

About the Author:

Sam Polzin, Food and Agriculture Survey Scientist, Purdue University and Jayson Lusk, Professor of Agricultural Economics, Purdue University

This article is republished from The Conversation under a Creative Commons license. Read the original article.


Mass layoffs have begun in the United States. The Bank of Japan to continue its soft monetary policy

By JustMarkets

At the close of the stock market on Friday, Dow Jones (US30) gained 1.00% (-2.05% for the week), and S&P 500 (US500) increased by 1.89% (+0.30% for the week). The NASDAQ Technology Index (US100) jumped by 2.66% on Friday (+2.15% for the week).

The US government reached its $31.4 trillion borrowing limit on Thursday amid a spat between uncompromising Republicans and Democrats over raising the nation’s debt ceiling. But traders can be sure the politicians will eventually agree because they have no choice. It happens every year, and this time is no exception.

This week, investors will be treated to a wave of reports from major technology companies. Microsoft (MSFT), the second largest US company by market value, reports on Tuesday, followed by Tesla (TSLA) on Wednesday and Intel (INTC) on Thursday. The reporting season started sluggishly. According to Refinitiv, S&P 500 companies are expected to record a 2.9% drop in fourth-quarter earnings overall compared with the previous year.

Alphabet (GOOGL) said Friday that it is cutting about 12,000 jobs or 6% of its workforce. Last week, Microsoft on Wednesday said it would cut 10,000 jobs, while Amazon (AMZN) began notifying employees that it would cut 18,000 jobs. Apparently, the US job market is starting to fall, which will undoubtedly show up in the next labor market reports. For regular people losing their jobs is a serious blow. But for the stock market, it will be a boost as the US Federal Reserve will hold off on raising rates so as not to hurt the economy even more.

Stock markets in Europe were mostly up on Friday. German DAX (DE30) gained 0.76% (-0.52% for the week), French CAC 40 (FR 40) added 0.63% (-0.58% for the week), Spanish IBEX 35 (ES35) jumped by 1.38% (+0.13% for the week), British FTSE 100 (UK100) increased by 0.30% (-0.94% for the week).

In Canada, a federal government law designed to help the fossil fuel workforce transition to a greener economy has caused unions to be unhappy. The government of Alberta, Canada’s main oil-producing province, says the law will eliminate the oil and gas industry, which accounts for 5% of Canada’s GDP. Canada’s oil and gas sector employs about 185,000 people, and the bill could lead to significant job cuts.

The European Central Bank (ECB) is currently leading the charge against the US Federal Reserve. Last week, support for the euro was largely due to a sell-off in the dollar and a firm stance by ECB President Christine Lagarde on fighting inflation. The ECB head expressed concern that China’s opening will lead to higher energy prices in 2023, and the ECB will continue to raise interest rates to bring inflation down to 2%.

British Finance Minister Jeremy Hunt plans to extend the 5 pence reduction in gasoline prices for another year. On the one hand, this is good news because it will help reduce the cost of gasoline at gas stations. On the other hand, untargeted government spending may keep inflation high for longer, which will only make it harder for the Bank of England, which needs to keep raising rates while the economy is already in recession.

Inflation in Switzerland may have peaked, but it’s too soon to swear off new interest rate hikes, Swiss National Bank President Thomas Jordan said.

Asian markets mostly rose last week. Japan’s Nikkei 225 (JP225) gained 2.77% over the week, China’s FTSE China A50 (CHA50) gained 0.73%, Hong Kong’s Hang Seng (HK50) gained 1.04% over the week, India’s NIFTY 50 (IND50) added 0.16%, and Australia’s S&P/ASX 200 (AU200) was positive 1.69% over the week.

Bank of Japan Governor Haruhiko Kuroda on Friday defended the central bank’s decision to expand its trading range under its yield curve control program and pledged to continue the Bank of Japan’s soft monetary policy. Speaking at the World Economic Forum in Davos, Switzerland, Kuroda said it was “not wrong” for the BOJ’s board to widen its tolerance range for the yield on its 10-year government bond from 25 basis points to 50 basis points last month.

In the commodities market, cotton futures (+5.46%), gasoline (+4.23%), Brent crude oil (+2.79%), and WTI crude oil (+2.29%) showed the biggest gains last week. Futures on natural gas (-8.34%), palladium (-3.21%), cocoa (-2.94%), and platinum (-1.92%) showed the biggest drop.

S&P 500 (F) (US500) 3,972.61 +73.76 (+1.89%)

Dow Jones (US30) 33,375.49 +330.93 (+1.00%)

DAX (DE40) 15,033.56 +113.20 (+0.76%)

FTSE 100 (UK100) 7,770.59 +23.30 (+0.30%)

USD Index 101.99 -0.07 (-0.06%)

Important events for today:
  • – Japan Monetary Policy Meeting Minutes at 01:50 (GMT+2);
  • – Eurozone ECB President Lagarde Speaks at 19:45 (GMT+2).

By JustMarkets


This article reflects a personal opinion and should not be interpreted as an investment advice, and/or offer, and/or a persistent request for carrying out financial transactions, and/or a guarantee, and/or a forecast of future events.

Week Ahead: Hawkish Bank of Canada may drag USDCAD lower

By ForexTime

The Canadian Dollar has the smallest year-to-date gain out of all G10 currencies against the US dollar.

Only the Norwegian Krone, another oil-linked currency, has had it worse so far in 2023, with a 0.86% percent year-to-date decline versus the greenback at the time of writing.


CAD traders will be paying close attention to the Bank of Canada’s rate decision due in the coming week, alongside these major economic data releases and events:


Monday, January 23

  • JPY: Bank of Japan December meeting minutes
  • EUR: Eurozone January consumer confidence; ECB President Christine Lagarde speech

Tuesday, January 24

  • AUD: Australia January PMIs, December business confidence
  • EUR: Eurozone January PMIs
  • GBP: UK January PMIs
  • USD: US January PMIs
  • Microsoft earnings

Wednesday, January 25

  • NZD: New Zealand 4Q CPI
  • AUD: Australia 4Q CPI
  • JPY: Bank of Japan to announce amount of outright purchases of government securities
  • EUR: Germany January IFO business climate
  • CAD: Bank of Canada rate decision
  • S&P 500: Earnings from Tesla, NextEra Energy, IBM

Thursday, January 26

  • USD: US 4Q GDP; weekly initial jobless claims
  • S&P 500: Earnings from Intel, American Airlines, Southwest Airlines, Mastercard, Visa

Friday, January 27

  • NZD: New Zealand January business confidence
  • JPY: Japan Tokyo CPI
  • USD: US December PCE deflator, personal income and spending; January consumer sentiment


The Bank of Canada (BoC) is expected to hike its benchmark rate by another 25 basis points (bps), with markets allocating a 74% chance of such an event occurring this Wednesday.


Alternative scenarios:

  • If the BoC surprises with a larger-than-expected 50bps hike, that could send the Canadian dollar soaring, which would drag USDCAD lower.
  • If the BoC surprises by pressing pause on its rate hikes, given that Canada’s inflation has been easing lower, that could pull the loonie lower while boosting USDCAD.


USDCAD: Key levels

RESISTANCE

  • 1.35 area – where this pair’s 50-day and 100-day simple moving averages are currently converging alongside the 23.6% Fibonacci level from USDCAD’s runup between June 2021 – October 2022.
  • 1.36 area – upper boundary of the downward slope from October’s high
  • 1.37043 – mid-December high, though the path up to these levels could be choppy, given that it features varying price action throughout last month.

SUPPORT

  • 1.332 – previous cycle low
  • 1.322 – November low/38.2 Fibonacci level from USDCAD’s June 2021 – October 2022 runup
  • 1.320 psychologically-important region – 200-day SMA/early-September cycle highs


At the time of writing, markets are giving a slight edge for a downside move rather than an upside move for USDCAD.

Here are some forecasts for the next one-week period (from levels at the time of writing):

  • 39% chance that USDCAD may touch 1.332 previous cycle low for support
  • 35% chance that USDCAD will touch 1.360 resistance at upper boundary of downtrend


USDCAD: Fundamental analysis

Next week’s BoC hike is expected to be the final such move in its policy tightening cycle.

The central bank’s rate hikes have already sent its overnight lending rate soaring by a cumulative 4 percentage points throughout all of last year, with this policy tightening campaign also featuring that gargantuan 100 basis point hike last July.

Why was the BoC been hiking rates so aggressively?

Those aggressive hikes were done to quell a near 40-year high in inflation back in the summer of 2022. Canada’s recent bout of red-hot inflation peaked at 8.1% in June, which marked its highest print since January 1983!

However, since then, the consumer price index (CPI) has cooled down to 6.3% year-on-year for December 2022. On a month-on-month basis (comparing the Dec’22 figure with that of Nov’22), the CPI actually fell by 0.6% – its biggest drop since April 2020, at the onset of the pandemic.

BoC forecasted to pause after January hike

Although CPI still remains far above the central bank’s 2% target, moderating inflation may soon bring the curtains down on the Bank of Canada’s rate-hike campaign.

And such dovish expectations have dampened the Canadian dollar’s performance, as cited at the top of this article.

After all, markets are forward-looking in nature. That means today’s prices for USDCAD are reflecting market expectations for what the respective central banks may or may not do in the future.

Also focus on the USD side of the USDCAD equation

The US dollar is set to continue reacting to expectations surrounding the US Federal Reserve’s own rate decision due February 1st, exactly one week after the BoC’s rate decision.
As that keenly-awaited FOMC meeting looms closer, keep a close watch on:

  1. PCE Deflator – the Fed’s preferred inflation gauge – due Friday.

    If the December PCE deflator does not ease lower from November’s prints, pointing to stubborn inflation in the world’s largest economy, that could force the Fed to persist with a bigger rate hike than the mere 25bps liftoff currently priced in by the markets.

  2. Other key US economic data due in the coming week: US GDP, weekly initial jobless claims, and consumer income/spending/sentiment.

    Further signs of waning US economic growth momentum should weigh on the US Dollar, and drag USDCAD lower.


How do market expectations surrounding Fed vs. BoC impact USDCAD?

And as an oversimplified breakdown:

  • Fed to keep hiking rates while BoC slows down/pauses

    = stronger US dollar + weaker Canadian dollar

    = USDCAD to move higher

  • Bank of Canada to keep hiking rates while Fed slows down/pauses

    = stronger Canadian dollar + weaker US dollar

    = USDCAD to move lower


For added reference, here are two other markets that have a major bearing on USDCAD:

  1. The difference in yields between US and Canadian 2-year bonds
    (Rising US vs. Canada spreads = weaker CAD = rising USDCAD; and vice versa)
  2. Brent oil
    (Lower oil prices = weaker CAD = rising USDCAD; and vice versa)

Here’s a look back at how these markets have moved largely in tandem over the past 20 years:


Forex-Time-LogoArticle by ForexTime

ForexTime Ltd (FXTM) is an award winning international online forex broker regulated by CySEC 185/12 www.forextime.com

Quarterly results are still below expectations. Many important decisions on Ukraine will be made in Ramstein (Germany) today

By JustMarkets

The US stock indices continued their decline yesterday. Quarterly results fell short of estimates, with increasing negativity that the Federal Reserve will remain hawkish for a long time as the labor market shows little sign of easing. As the stock market closed yesterday, the Dow Jones Index (US30) decreased by 0.76%, and the S&P 500 Index (US500) fell by 0.76%. The NASDAQ Technology Index (US100) was down by 0.96% on Thursday.

About 190,000 people filed for unemployment claims in the US last week, well below economists’ forecast of 214,000. The strong labor market leaves the US Federal Reserve with room to raise rates further.

Fed spokeswoman Lael Brainard said Thursday that the Fed intends to stay the course on tightening monetary policy and will keep rates fairly restrictive for some time to ensure inflation returns to the Central Bank’s 2% target.

Netflix (NFLX) reported fourth-quarter results that fell short of net income expectations, but the number of new subscribers exceeded expectations. The company added 7.66 million subscribers, well above the 4.6 million expected. The company’s stock jumped by 7% after the report was released in the evening session.

Tesla (TSLA) decreased by 1% yesterday as investors worry that the electric carmaker’s quarterly results may not meet expectations amid slowing demand and production disruptions in China.

Norwegian Cruise Line (NCLH) shares are down more than 4%. The cruise company warned that it expects to report net losses for the quarter and a full year.

Stock markets in Europe were mostly down yesterday. Germany’s DAX (DE30) decreased by 1.72%, France’s CAC 40 (FR40) fell by 1.86%, Spain’s IBEX 35 Index (ES35) lost -1.60%, and the British FTSE 100 (UK100) closed down by 1.07%.

ECB head Christine Lagarde said yesterday that the labor market in Europe has never been as vibrant as it is now, and the economic outlook is much more positive. Given the latest Eurozone inflation data, analysts are leaning towards the ECB raising rates by 50 basis points in February and March and then by another 25 basis points in May, after which Europe’s central bank will take a pause for a few months.

Consumer sentiment in the UK has fallen to a nearly 50-year low. GfK research shows that fears about the economy and a sharp rise in the cost of living have added pressure to household finances. Energy bills and food prices have risen rapidly in recent months, eating away at households’ disposable income. Treasury Secretary Jeremy Hunt and Prime Minister Rishi Sunak cut a two-year household energy scheme that would have kept annual bills at £2,500.

The situation in Ukraine is heating up. According to foreign intelligence, Russia is preparing a new major offensive against Ukraine in the coming weeks. This is the reason the Western allies have become more active in providing weapons, including tanks. Today there will be an important meeting in Ramstein at the NATO base, where it will be decided how much and what weapons to give Ukraine to defend its territories. The front line has largely frozen over the past two months, and neither side has made much progress, despite heavy losses in positional fighting.

Oil prices rose about 1% on Thursday, even as inventories rose. The Energy Information Administration, or EIA, said in its weekly report that US crude inventories rose by 8.408 million barrels for the week. The main trigger for the rise is optimism about China’s opening. Oil demand in China is up nearly 1 million BPD from the previous month. The International Energy Agency said Wednesday that global oil demand could reach an all-time high in 2023 as China lifts blockages and restrictions.

Natural gas closed yesterday at June 2021 lows. A warm winter in Europe led to a sharp drop in gas consumption, which at current supply levels puts downward pressure on quotes. But the main weather forecast models, the Global Forecast System (GFS) and the European ECMWF model expect colder short-term temperature forecasts by the last week of January. This could cause a short-term rise in prices.

Asian markets traded yesterday without a single dynamic. Japan’s Nikkei 225 (JP225) decreased by 1.44% on Thursday, China’s FTSE China A50 (CHA50) added 0.15%, Hong Kong’s Hang Seng (HK50) ended the day down by 0.12%, India’s NIFTY 50 (IND50) fell by 0.32%, and Australia’s S&P/ASXv200v(AU200) ended the day up by 0.57%.

Japan’s nationwide core CPI rose from 3.7% to 4.0% year-over-year, a 41-year high. Rising inflation in Japan adds to the likelihood that the central bank will reverse the policy to tighten the cycle in the spring.

S&P 500 (F) (US500) 3,898.85 −30.01 (−0.76%)

Dow Jones (US30) 33,044.56 −252.40 (−0.76%)

DAX (DE40) 14,920.36 −261.44 (−1.72%)

FTSE 100 (UK100) 7,747.29 −83.41 (−1.07%)

USD Index 102.07 −0.29 (−0.29%)

Important events for today:
  • – Japan National Core Consumer Price Index at 01:30 (GMT+2);
  • – US FOMC Member Williams Speaks at 01:35 (GMT+2);
  • – UK Retail Sales (m/m) at 09:00 (GMT+2);
  • – World Economic Forum Annual Meetings at 10:00 (GMT+2);
  • – Switzerland SNB Chairman Jordan Speaks at 10:00 (GMT+2);
  • – Eurozone ECB President Lagarde Speaks at 12:00 (GMT+2);
  • – Canada Retail Sales (m/m) at 15:30 (GMT+2);
  • – US FOMC Member Harker Speaks at 16:00 (GMT+2);
  • – US Existing Home Sales (m/m) at 17:00 (GMT+2);
  • – US FOMC Member Waller Speaks at 20:00 (GMT+2).

By JustMarkets


This article reflects a personal opinion and should not be interpreted as an investment advice, and/or offer, and/or a persistent request for carrying out financial transactions, and/or a guarantee, and/or a forecast of future events.

China now publishes more high-quality science than any other nation – should the US be worried?

By Caroline Wagner, The Ohio State University 

By at least one measure, China now leads the world in producing high-quality science. My research shows that Chinese scholars now publish a larger fraction of the top 1% most cited scientific papers globally than scientists from any other country.

I am a policy expert and analyst who studies how governmental investment in science, technology and innovation improves social welfare. While a country’s scientific prowess is somewhat difficult to quantify, I’d argue that the amount of money spent on scientific research, the number of scholarly papers published and the quality of those papers are good stand-in measures.

China is not the only nation to drastically improve its science capacity in recent years, but China’s rise has been particularly dramatic. This has left U.S. policy experts and government officials worried about how China’s scientific supremacy will shift the global balance of power. China’s recent ascendancy results from years of governmental policy aiming to be tops in science and technology. The country has taken explicit steps to get where it is today, and the U.S. now has a choice to make about how to respond to a scientifically competitive China.

Growth across decades

In 1977, Chinese leader Deng Xiaoping introduced the Four Modernizations, one of which was strengthening China’s science sector and technological progress. As recently as 2000, the U.S. produced many times the number of scientific papers as China annually. However, over the past three decades or so, China has invested funds to grow domestic research capabilities, to send students and researchers abroad to study, and to encourage Chinese businesses to shift to manufacturing high-tech products.

Since 2000, China has sent an estimated 5.2 million students and scholars to study abroad. The majority of them studied science or engineering. Many of these students remained where they studied, but an increasing number return to China to work in well-resourced laboratories and high-tech companies.

Today, China is second only to the U.S. in how much it spends on science and technology. Chinese universities now produce the largest number of engineering Ph.D.s in the world, and the quality of Chinese universities has dramatically improved in recent years.

Producing more and better science

Thanks to all this investment and a growing, capable workforce, China’s scientific output – as measured by the number of total published papers – has increased steadily over the years. In 2017, Chinese scholars published more scientific papers than U.S. researchers for the first time.

Quantity does not necessarily mean quality though. For many years, researchers in the West wrote off Chinese research as low quality and often as simply imitating research from the U.S. and Europe. During the 2000s and 2010s, much of the work coming from China did not receive significant attention from the global scientific community.

But as China has continued to invest in science, I began to wonder whether the explosion in the quantity of research was accompanied by improving quality.

To quantify China’s scientific strength, my colleagues and I looked at citations. A citation is when an academic paper is referenced – or cited – by another paper. We considered that the more times a paper has been cited, the higher quality and more influential the work. Given that logic, the top 1% most cited papers should represent the upper echelon of high-quality science.

My colleagues and I counted how many papers published by a country were in the top 1% of science as measured by the number of citations in various disciplines. Going year by year from 2015 to 2019, we then compared different countries. We were surprised to find that in 2019, Chinese authors published a greater percentage of the most influential papers, with China claiming 8,422 articles in the top category, while the U.S had 7,959 and the European Union had 6,074. In just one recent example, we found that in 2022, Chinese researchers published three times as many papers on artificial intelligence as U.S. researchers; in the top 1% most cited AI research, Chinese papers outnumbered U.S. papers by a 2-to-1 ratio. Similar patterns can be seen with China leading in the top 1% most cited papers in nanoscience, chemistry and transportation.

Our research also found that Chinese research was surprisingly novel and creative – and not simply copying western researchers. To measure this, we looked at the mix of disciplines referenced in scientific papers. The more diverse and varied the referenced research was in a single paper, the more interdisciplinary and novel we considered the work. We found Chinese research to be as innovative as other top performing countries.

Taken together, these measures suggest that China is now no longer an imitator nor producer of only low-quality science. China is now a scientific power on par with the U.S. and Europe, both in quantity and in quality.

Fear or collaboration?

Scientific capability is intricately tied to both military and economic power. Because of this relationship, many in the U.S. – from politicians to policy experts – have expressed concern that China’s scientific rise is a threat to the U.S., and the government has taken steps to slow China’s growth. The recent Chips and Science Act of 2022 explicitly limits cooperation with China in some areas of research and manufacturing. In October 2022, the Biden administration put restrictions in place to limit China’s access to key technologies with military applications.

A number of scholars, including me, see these fears and policy responses as rooted in a nationalistic view that doesn’t wholly map onto the global endeavor of science.

Academic research in the modern world is in large part driven by the exchange of ideas and information. The results are published in publicly available journals that anyone can read. Science is also becoming ever more international and collaborative, with researchers around the world depending on each other to push their fields forward. Recent collaborative research on cancer, COVID-19 and agriculture are just a few of many examples. My own work has also shown that when researchers from China and the U.S. collaborate, they produce higher quality science than either one alone.

China has joined the ranks of top scientific and technological nations, and some of the concerns over shifts of power are reasonable in my view. But the U.S. can also benefit from China’s scientific rise. With many global issues facing the planet – like climate change, to name just one – there may be wisdom in looking at this new situation as not only a threat, but also an opportunity.The Conversation

About the Author:

Caroline Wagner, Milton & Roslyn Wolf Chair in International Affairs, The Ohio State University

This article is republished from The Conversation under a Creative Commons license. Read the original article.


Weak US economic data raises the possibility of a recession

By JustMarkets

The US Producer Price Index (PPI) fell more than expected in December. This data shows the rate of inflation between factories and plants. The lower PPI puts more pressure on the Fed to slow the pace of interest rate hikes. But despite the easing of inflationary pressures, the US indices declined yesterday. At the close of the stock market yesterday, the Dow Jones Index (US30) decreased by 1.81%, and the S&P 500 Index (US500) fell by 1.56%. The NASDAQ Technology Index (US100) lost 1.24% on Wednesday.

The latest economic data indicates that December was a tough month for consumers. This is evidenced by retail sales data, which decreased by 1.1% from the previous month. Early in the fourth quarter reporting season, major US banks increased their cash reserves in anticipation of more credit losses due to the tough economy. On the one hand, lower inflation is boosting stocks as potentially softer economic conditions create a more favorable trading environment for companies. On the other hand, amid weak retail sales, a sharp drop in industrial production, and news of new layoffs, fears that the US may already be in a recession are growing. This is the third consecutive month of declining industrial activity, with the decline in production looking widespread. The chief economist at RSM US believes that the current trajectory of the economy suggests a “soft recession” in 2023.

Fed spokesman Bullard thinks a 0.5% point rate hike at the next meeting is appropriate, even though inflationary pressures in the US are declining. Another Fed official, Barkin, is of the same opinion. But others are in favor of a 0.25% rate hike at the February 1 meeting. A 0.25% hike in February is considered the most likely (92%) scenario today.

Shares of Microsoft Corporation (MSFT) fell by 1.9% after the company reported cutting 10,000 jobs and receiving a $1.2 billion fine. Moderna, Inc. (MRNA) shares rose by 3.3% after the maker of the COVID-19 vaccine said it was successful in a trial of its experimental vaccine against RSV (contagious respiratory virus) in older adults.

Stock markets in Europe traded without a single trend. German DAX (DE30) decreased by 0.03%, French CAC 40 (FR40) gained 0.09%, Spanish IBEX 35 (ES35) added 0.40%, and British FTSE 100 (UK100) closed yesterday down by 0.26%.

The UK inflation rate fell from 10.7% to 10.5% year-on-year. Core inflation (excluding food and energy prices) remained at 6.3%. The underlying factor behind the decline in inflation is the December decline in energy prices. Money markets are highly confident in favor of a 50 basis point gain at the Bank of England’s February meeting.

Oil prices retreated from Wednesday’s highs amid a Chinese economic opening as US industrial, and retail trade data failed to meet economists’ expectations.

Asian markets were mostly up yesterday. Japan’s Nikkei 225 (JP225) gained 2.5% on Wednesday, China’s FTSE China A50 (CHA50) decreased by 0.36%, Hong Kong’s Hang Seng (HK50) ended the day up by 0.47%, India’s NIFTY 50 (IND50) increased by 0.62%, and Australia’s S&P/ASX 200 (AU200) ended the day up by 0.10%.

Columbia University academic Takatoshi Ito, who is considered a candidate for governor of the Bank of Japan, said Thursday that higher-than-expected inflation could eventually push Japan’s central bank to extend the range of benchmark bond yields this year. It’s a step toward normalizing monetary policy. Japan’s consumer inflation data will be released this Friday and is expected to be 4%.

Australian labor market data indicates that the labor market is starting to cool off. Over the past month, the employment rate fell by 14.6k jobs, with an expected 58.3k growth. If this trend continues, it will give the Reserve Bank less economic room to raise interest rates.

S&P 500 (F) (US500) 3,928.86 −62.11 (−1.56%)

Dow Jones (US30) 33,296.96 −613.89 (−1.81%)

DAX (DE40) 15,181.80 −5.27 (−0.035%)

FTSE 100 (UK100) 7,830.70 −20.33 (−0.26%)

USD Index 102.40 +0.01 (+0.01%)

Important events for today:
  • – Australia Unemployment Rate (m/m) at 02:30 (GMT+2);
  • – World Economic Forum Annual Meetings at 10:00 (GMT+2);
  • – Eurozone ECB President Lagarde Speaks at 12:30 (GMT+2);
  • – Eurozone ECB Monetary Policy Meeting Accounts at 14:30 (GMT+2);
  • – US Building Permits (m/m) at 15:30 (GMT+2);
  • – US Initial Jobless Claims (w/w) at 15:30 (GMT+2);
  • – US Philadelphia Fed Manufacturing Index (m/m) at 15:30 (GMT+2);
  • – US Natural Gas Storage (w/w) at 17:30 (GMT+2);
  • – US Crude Oil Reserves (w/w) at 18:00 (GMT+2);
  • – US FOMC Member Brainard Speaks at 20:15 (GMT+2).

By JustMarkets


This article reflects a personal opinion and should not be interpreted as an investment advice, and/or offer, and/or a persistent request for carrying out financial transactions, and/or a guarantee, and/or a forecast of future events.

Something Breaks in 2023

Source: Ron Struthers  (1/17/23)

Ron Struthers believes that specifically, the debt market could break. The U.S. ran about a US$1.4 trillion deficit in 2022 (ended September) that Struthers believes will swell to US$2.5 trillion in 2023. 

Key Points

  • US Deficit to double.
  • The election of House Leader McCarthy will have a huge impact.
  • Fed forced to pivot for the wrong reason.
  • Market narrative wrong again.
  • Inflation back up and interest rates higher.
  • Energy to go higher in 2023.
  • A huge gold rally takes hold.

Specifically, the debt market could break. The U.S. ran about a US$1.4 trillion deficit in 2022 (ended September) that will swell to US$2.5 trillion in 2023. For some round numbers, Interest on the debt is going up with higher rates adding about US$200 billion.

In 2022 about US$600 billion in capital gains tax got paid and that won’t happen in 2023. There was an 8.7% increase in social security etc. that adds about US$120 billion. Then you have student loan forgiveness and Ukraine aid so we can easily go to a US$2.5 trillion deficit. And if a recession sets in, tax receipts will go down too.

McCarthy

Most people don’t understand the implications of the election of new house leader Kevin McCarthy over the majority Republican House. Most media focused on the 15 rounds of voting it took. Republicans divided and it was the evil, extreme far right that forced the situation.

McCarthy made concessions that will weaken his power, make it easier for lawmakers to oust him, and give the right-wing rank-and-file greater input in legislation and in lawmakers’ assignments to committees. Bigger consequences will unfold months from now if these ultraconservatives again withhold their votes until they have their way on looming spending bills and the debt ceiling. One of their main goals is to shrink the size of the government.

If you don’t stop spending money that we don’t have to fund the bureaucracy that is undermining the American people, we cannot win,” said Chip Roy, a Republican who voted against McCarthy in 11 ballots.

They want an end to massive spending bills moved forward with little time to read the legislation. They want a minimum 72-hour review period and a reduction of massive omnibus bills, to allow members and the public to better understand what is being passed.

The market narrative currently is along the lines that inflation will continue downward, the Fed will stop raising rates, and soon start easing. I will try to explain why this is wrong again.

The concessions reportedly include “open rules” on all major rules bills, such as appropriations, to allow lawmakers to offer amendments on the floor. It would restore an amendment process that was gutted in recent sessions, benefiting both parties. They would reinstate “Calendar Wednesday,” which permits committee chairs to bring reported bills directly to the House floor.

Massive bills are a way to hide personal perks and pork projects under fraudulent packaging like the “Inflation Reduction Act” which had little to do with inflation. The omnibus bill recently pushed through the House and Senate is an example of this abusive, opaque process. It was a collection of 7,200 earmarks and pork projects, including tens of millions for libraries for the papers of a couple of retiring senators; five senators grabbed half a billion dollars for their favorite colleges. You had to swallow it whole or kill the whole spending bill.

Fed Forced to Pivot

There is only so much supply the bond market can take, and it won’t like a U.S. debt default scare. So the Fed could be forced to pivot, not because inflation comes down but because the bond market breaks. Most people believe the Fed is bigger than the market and so does the Fed but at times reality sets in. How long will investors and other countries buy bonds yielding 3.5% when inflation is 6% or 7%?

Perhaps the Fed can hold the bond market together this year, but it certainly can’t continue until 2024; something is going to break.

I say it is a good thing that the so-called far-right Republicans will have influence, government spending has to get back to some control and restraint, it has totally gone bonkers in the U.S. and Canada too. This could also cause problems in the bond market, and the first test of this will be passing legislation to extend the debt ceiling. This could drag out a long time, and these Republicans will demand spending cuts. It is probably a good thing in the long run, but the short term could cause market turmoil, raising longer-term interest rates.

The market narrative currently is along the lines that inflation will continue downward, the Fed will stop raising rates, and soon start easing. I will try to explain why this is wrong again.

I made the comment numerous times, such as in June 2022 that the inflation problem was created by Covid-19 policies, specifically all the money printing. In previous QE, after the 2008 financial crash, it was all money created in banking reserves, but that does not mean the money gets into the economy but certainly helps the bank. My point with Covid-19 money printing, a lot was going right to consumers. I highlighted the high personal savings rate and swelling Robinhood stock accounts.

The Fed has now quantified how much Covid-19 stimulus went directly into bank accounts. A friend sent me an excellent video that analysis the Fed’s numbers in the report. This chart from the Fed report shows a strong move above baseline growth.
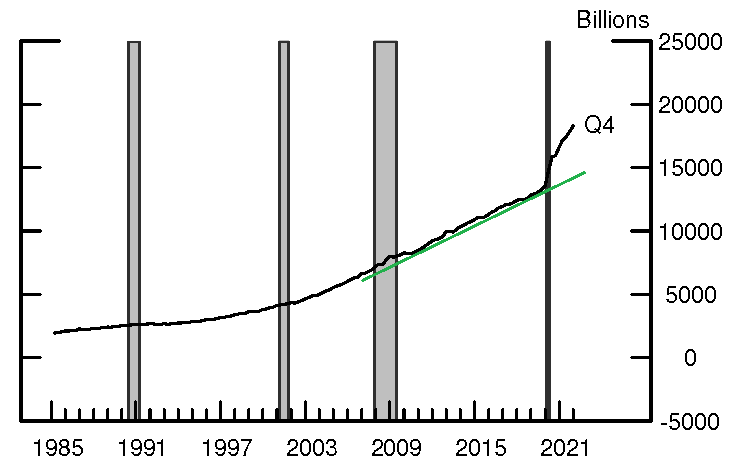
Bank deposits grew by over US$5 trillion, and that is shown better in the next table below.
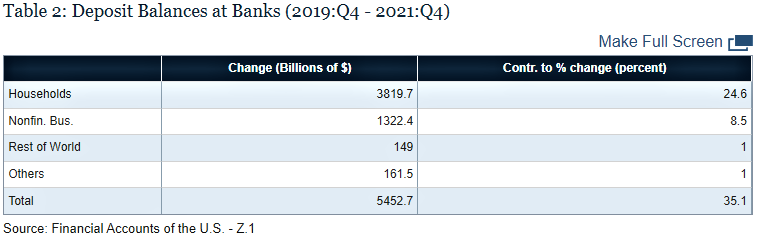
The Fed report concludes that “Data from the U.S. Financial Accounts, shown in Table 2 broadly confirm the evidence, specifically, household deposit balances at banks (the sum of checkable, time, and savings deposits) rose by substantially more than deposits held by nonfinancial businesses between 2019:Q4 and 2021:Q4, accounting for nearly two-thirds of the overall increase in aggregate deposits. “

Households got US$3.8 trillion, and that is a huge number. There is your smoking gun that caused the current inflation and now that inflation has become entrenched. The QE from the Fed went mostly to banks that ended up inflating bubbles in stocks, bonds, and somewhat crypto.

Households got US$3.8 trillion, and that is a huge number. There is your smoking gun that caused the current inflation and now that inflation has become entrenched.

About 10% of the Fed’s QE bought nonbank financial assets highlighted in the video, and this is something new and significant from past QE. Households added significantly to stock, crypto, and housing bubbles, but also, a lot of the funds went into the economy, spiking demand for goods at a time of shortages from Covid-19 policies, thus the high inflation.

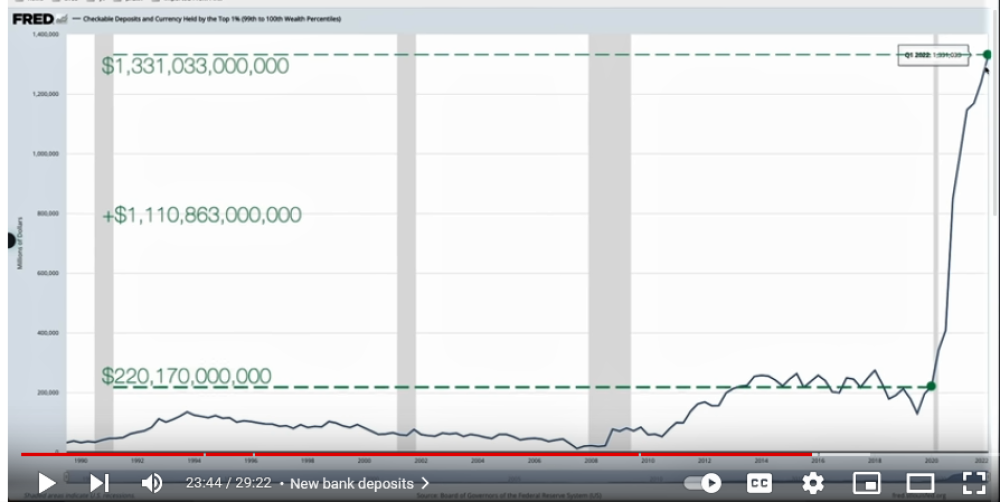
Some interesting numbers in the video, by wealth, the bottom 50% saw bank deposits increase an additional US$167 billion. The 50% to 90% group saw an increase of US$784.5 billion. Now the bottom 9% of the top 10% or you could say the 90% to 99% group saw an additional US$1.1 trillion, and the wealthiest, the top 1%, also had an increase of US$1.1 trillion.

I took a screenshot of the screen in the video showing this increase. You get a better perspective on how large the increase was relative to pre Covid-19. As always the wealthy get the most, and a lot of this could be related to Covid-19 wage subsidies and loans that went to business owners.
The Fed cannot remove the stimulus already out there, and they cannot control the Biden Administration’s inflationary fiscal policy, although the Republican house might be able to curtail it.

As I mentioned, we probably have a temporary reprieve with energy inflation, but most important for 2023 is a continued labor shortage and tight labor market. This is highlighted by all the problems you see at medical facilities and airlines, and that is because you cannot quickly train new pilots, aircraft mechanics, doctors, nurses, etc. These services affect our day-to-day lives, so another reason there is lots of press coverage. There are three main factors at work here.

1 – The shot mandates for workers in many sectors caused them to quit or be fired. Although ongoing court rulings are allowing them to come back, in many cases, the mandates were enough to tip the scale to an earlier-than-planned retirement. This affected between 10% and 20% of the workforce in some sectors.

2 – Spike in sickness and death post Covid-19 shots along with Covid-19 sickness leave policy. I know this is controversial, and you can argue the cause, but you cannot argue the factual data. In Canada, 80 young doctors have died suddenly or unexpectedly. We need those 80 doctors. As of December 23, 2022, the U.S. Vaccine Adverse Events Reporting System (VAERS) had received 33,334 reports of post-jab deaths, 26,045 cases of myocarditis, and 15,970 heart attacks. Only a small fraction of vaccine problems get officially reported, but it is easy to see it has gone through the roof since the mRNA shots.
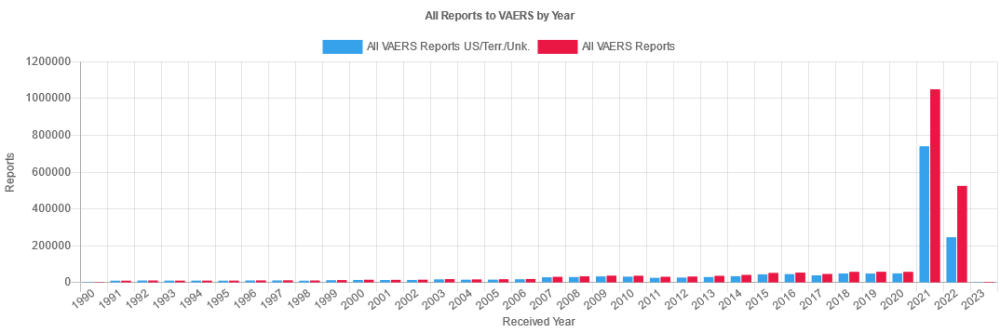
The U.S. government suspiciously has data only up to March or June 2020, but more recently, for example, from January 1, 2022, to December 31, 2022, California required most employers to provide workers up to 80 hours of supplemental paid sick leave for COVID-19 reasons. I think sick leave is a bigger factor for businesses trying to cope with worker shortages.

With oil, the key level to watch is US$82. If oil breaks above that, it would be a higher high and break the downtrend channel.

From a US Census Bureau survey in June 2022, they estimated around 16 million working-age Americans had long Covid (3 months and longer).

3 – Boomers are leaving the workforce. In 2019, just before the pandemic, 57% of Americans in their early 60s were still working, compared with 46% of that age group two decades earlier. The outsize importance of the boomers is the result of the generation’s size: Some 76 million Americans were born between 1946 and 1964. By comparison, just 47 million people were born into the so-called silent generation that preceded the boomers and 55 million into Generation X.

Labor Shortage

Although the Covid-19 factors are significant, the boomers’ retirement is the biggest factor, and Covid-19 caused many to retire perhaps a few years ahead of plans. This is a chart from a NY Times article that illustrates well this big group moving into retirement years.
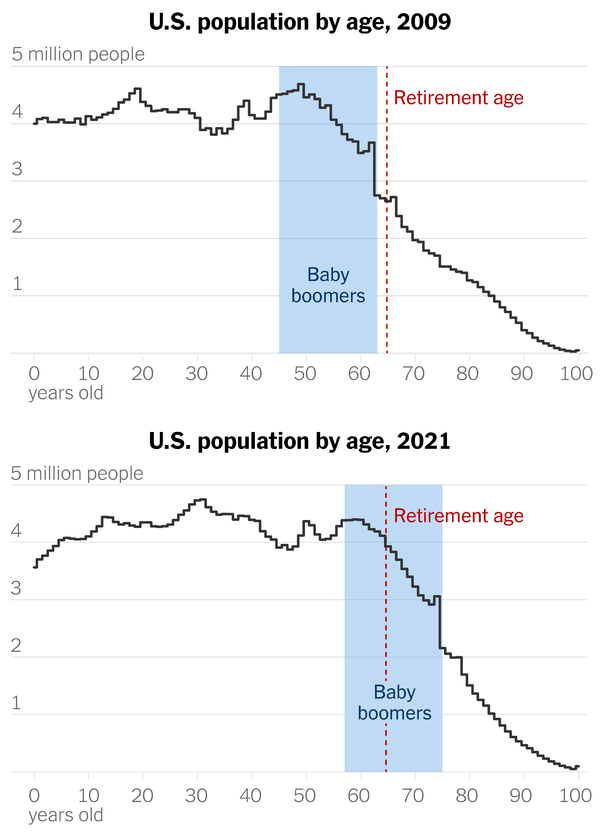
The country has a “structural labor shortage” that is unlikely to be resolved anytime soon, Jerome Powell, the Federal Reserve chair, said last month.

Last Friday’s job report showed that 2022 was the second-best year on record in terms of raw job growth, behind only 2021. The tight labor market is going to continue upward pressure on inflation with higher wages.

Food inflation will likely get worse. Few are talking about the effect of fertilizer shortages and prices because of the Ukraine war. “This could be the end of an era of cheap food. While almost everyone will feel the effects of that on their weekly shop, it’s the poorest people in society, who may already struggle to afford enough healthy food, who will be hit hardest,” said Dr. Peter Alexander, citing a study led by the University of Edinburgh’s School of GeoSciences.

Using computer model simulations, the research team estimated that the combined effect of elevated fertilizer prices, rising energy costs, and export restrictions could push up food costs by 81% in 2023 when compared to 2021.

Nutrien Ltd. (NTR:NYSE) ($74) would be a good stock; it mainly produces from fertilizers from six mines in Canada.

Markets are in for a nasty surprise in 2023 as high inflation, and interest rates prove very sticky. In fact, there is a substantial risk that we even see inflation go back up. As mentioned, food prices will probably rise, and energy markets are still very tight.

Oil and Gas

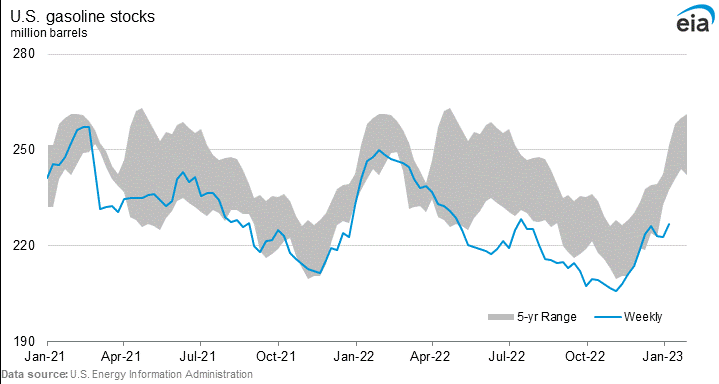
So far, a milder winter has helped, but there is lots of time for cold spells. Gasoline inventories normally build in the winter before the summer driving season, but after a decent start, it is not looking as good. Gasoline futures bottomed in December just above US$2.00 and now moved up to US$2.50.
Wars are uncertain. Russia is or will soon be launching a winter offensive. How successful will either side be? In a prolonged war, can the West keep providing for Ukraine?

Navy Secretary Carlos Del Toro acknowledged before a naval warfare conference in Arlington, Virginia, last Wednesday that the U.S., within the next six months, could face a decision of whether to arm itself or Ukraine due to rapidly depleting stockpiles due to supplying Ukraine.

Will the sanctions with price caps take much oil off the market? The West has pulled out of Russia, and specifically, BP ran one of the largest oil fields.

Will the Russians be able to keep production going? War in itself is a big consumer of energy, so demand is increasing some here. In a few months’ time, we might have a more clear picture of the war, but there is plenty of uncertainty in oil markets, particularly regarding the timing of China’s demand recovery as it moves away from its zero-Covid policy.

There are no more releases from the SPR, and China demand will gradually recover post-zero-Covid policy. Oil and gas companies are focused on shareholder returns, so we won’t have much new supply either. Energy inventories in all forms are around or below 5-year averages, so there is no buffer to any disruptions. The fundamentals support oil going back above US$100 in 2023

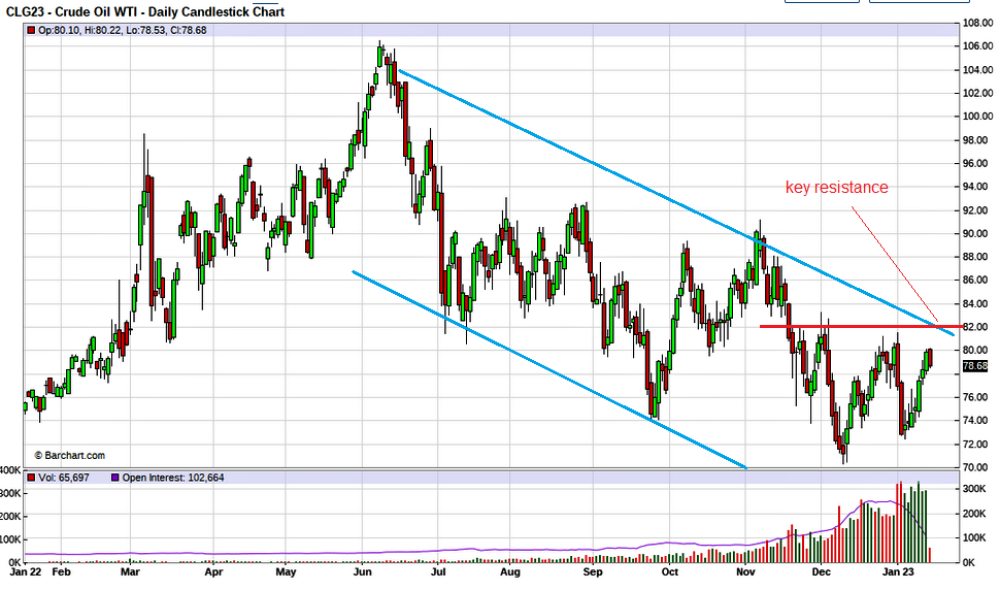
With oil, the key level to watch is US$82. If oil breaks above that, it would be a higher high and break the downtrend channel. On the downside, it would be very bearish if oil dropped below US$70 or new lows in this recent trend.
The Recession Is the End Game

I believe it will take a significant recession and weak jobs market to get inflation under control, and we are headed in that direction. The World Bank has slashed its 2023 global growth forecast by almost half — from 3% to 1.7% — as elevated inflation, higher interest rates, reduced investment, and Russia’s invasion of Ukraine constrain economic activity.

If that wasn’t enough, the Washington-based lender warned that any new adverse shocks could push the global economy into recession, which would mark the first time in more than 80 years that two global recessions occurred within the same decade.

Over in the U.S., the economy is expected to experience 0.5% growth in 2023, 1.9 percentage points below previous forecasts and the weakest performance outside of official recessions since 1970.

Currently, we are not near a recession. In my experience, what is unusual is the huge spread between mainstream analysts at a median of around 1% and the Atlanta Fed at 4%. Usually, the Atlanta Fed has a lower forecast than the mainstream. I expect this is optimism from the mainstream for slower growth and a Fed pivot. 

The market is pricing in a Fed pivot and soft landing. Part of the pivot is when the Fed stops raising rates, but as I mentioned above, bond markets could push long rates higher no matter what the Fed does. I think Powel wants to be a Volcker, and he will drive the economy into the ground to do so.

Unfortunately, that is what it will take. Near term, if inflation keeps easing, the Fed slows or stops the rate increases, and it could be viewed very positively. However, before long, the inflation decreases will stop and remand stubbornly high, and there is considerable risk inflation heads back up. The Fed will keep tightening and force a recession and hard landing. And if they cause a bad recession, it may be difficult to stimulate back out of it. The Fed is walking a tightrope and usually falls.

On the recession watch — In a recession, housing goes, then cars, and then jobs.

Existing home sales are down to 2020 lows. Sales plunged 35.4% from November last year. Excluding the steep sales downturn that occurred in May 2020 at the start of the pandemic, sales are now at the slowest annual pace since November 2010, when the housing market was mired in the aftermath of the foreclosure crisis of 2007/08.

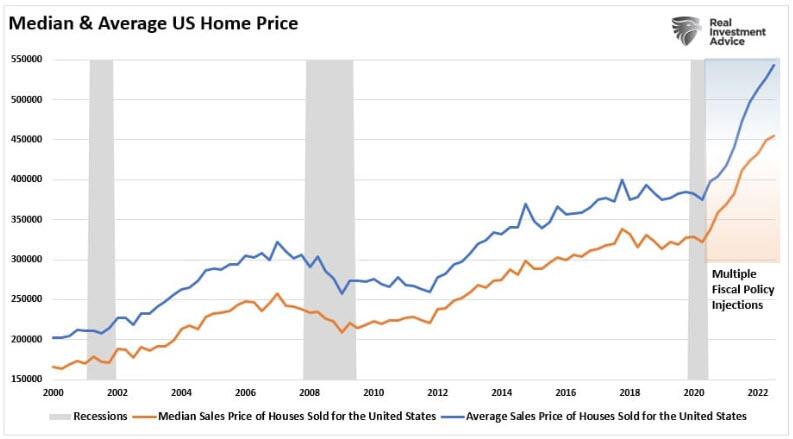
I have focused mostly on the Canadian housing bubble as it is more overpriced in the U.S., but the bubble in the U.S. is no slouch either. Prices went too far with the easy Covid-19 money, so they have a long way to pull back.
U.S. Auto Sales

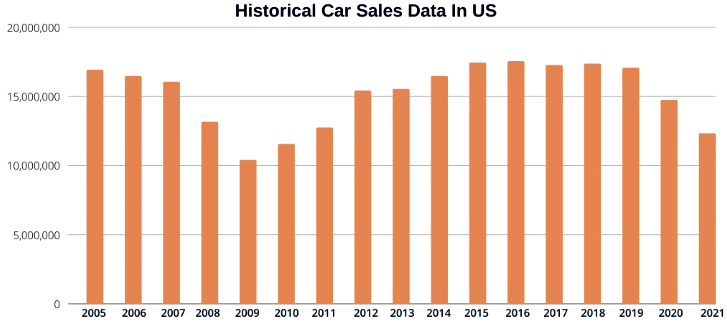
U.S. auto sales were negatively impacted in 2020/21 by Covid-19 lockdowns and restrictions and then by chip shortages in 2021 and 2022.

Sales dropped another -7.4% in 2022 to 13,899,871. Most analysts now expect a rebound because we have moved from a chip shortage to a surplus. I expect a rebound too, but new car financing will be tougher, and if we are or do go into recession, this will be a negative for Auto sales. I will be watching this closely this year.
Workforce Cuts

The latest:  Salesforce Inc. (CRM:NYSE) is cutting 10% of its workforce and is closing some offices, leading to US$1.4B-$2.1B in charges for the company and around 8,000 layoffs.

Amazon.com Inc. (AMZN:NASDAQ) is also slashing its headcount — by over double that figure.

The retail behemoth has confirmed that 18,000 employees will get the axe, with the bulk of the roles due for elimination concentrated in the firm’s e-commerce and human resources.

According to the tracking website “layoffs.fyi,” more than 150K tech workers were fired in 2022, and that number is poised to grow this year. However, there are growth and labor shortages in many other sectors that are offsetting this resulting in continued job growth and rising wages.

The tech sector is basically shedding excess, and they have further to go. The days of easy debt and equity financing are over that tech companies used to grow. In Canada, Bay Street is full of junior bankers who were not even alive the last time Canadian capital markets had a year as slow as 2022. The Globe’s Jameson Berkow writes that the total value of new stock issued by companies last year fell 73% to US$14.4-billion from US$52.7-billion in 2021. It was much worse in the U.S. as IPO deals plummeted 94%, according to Ernst&Young.

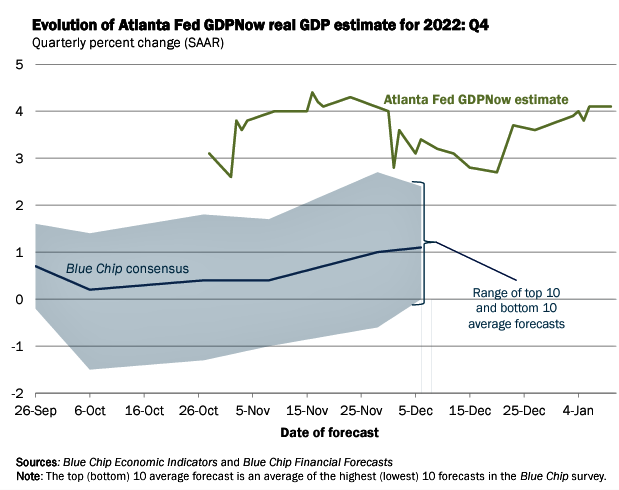
The U.S. economy grew an annualized 3.2% per quarter in Q3 2022, better than 2.9% in the second estimate and rebounding from two straight quarters of contraction. I watch the Atlanta GDP now forecasts, and they are way up at 4% growth for Q4 2022.

Currently, we are not near a recession. In my experience, what is unusual is the huge spread between mainstream analysts at a median of around 1% and the Atlanta Fed at 4%. Usually, the Atlanta Fed has a lower forecast than the mainstream. I expect this is optimism from the mainstream for slower growth and a Fed pivot. Again, a surprise on inflation resilience is around the corner.
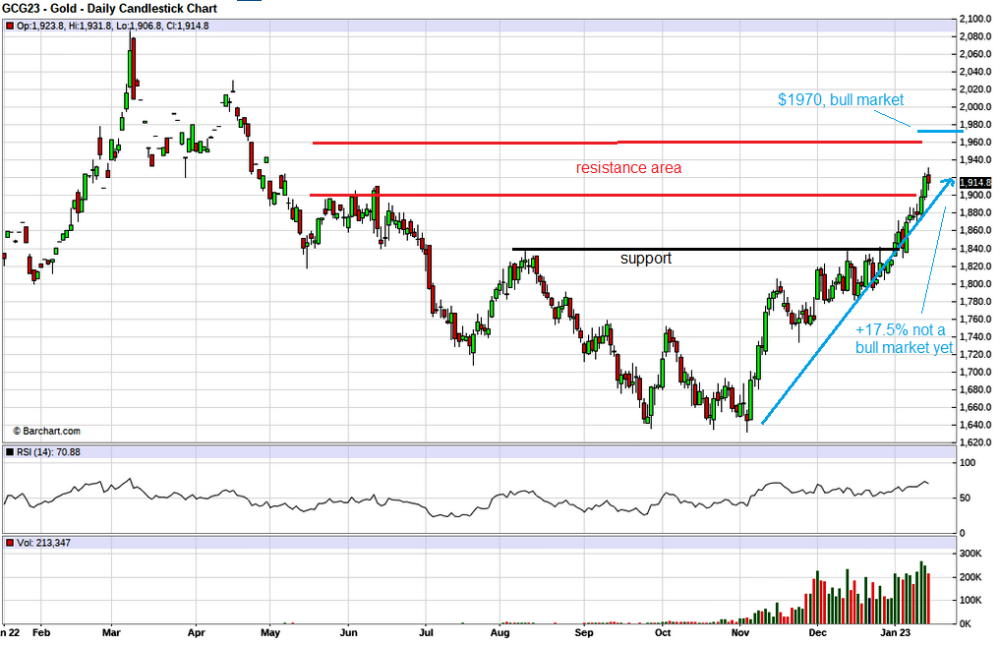
Gold has moved strongly from the November bottom and is now around the middle of my resistance area. I am expecting some consolidation and/or a pullback.

On the bullish side, the US$1970 price signifying a new bull market, may act as a magnet. Gold might also be pricing in a Fed slowdown in rate increases and a pivot.

As noted above, I am skeptical about this.
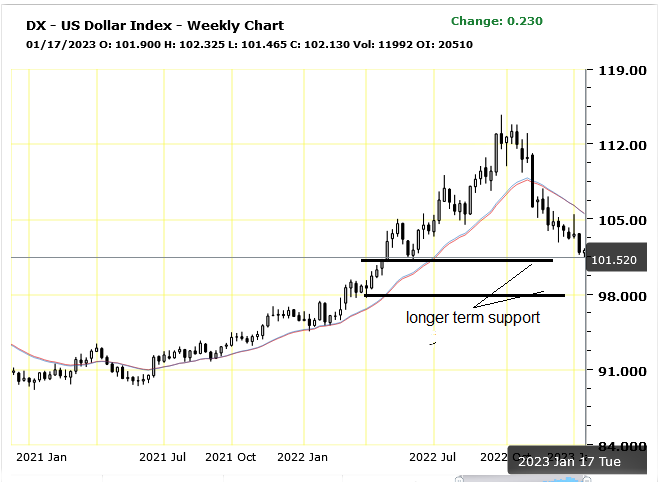
Short term, it is the fall in the U.S. dollar index that has been a significant bullish factor for gold. The U.S. dollar index is nearing a long-term support area, so I do not expect much more weakness in 2023.
 

In Summary From Above

The market is pricing in a Fed pivot and soft landing. Part of the pivot is when the Fed stops raising rates, but as I mentioned, bond markets could push long rates higher no matter what the Fed does. I think Powel wants to be a Volcker, and he will drive the economy into the ground to do so.

Unfortunately, that is what it will take. Near term, if inflation keeps easing, the Fed slows or stops the rate increases, it could be viewed very positively. However, before long, the inflation decreases will stop and remand stubbornly high and there is considerable risk inflation heads back up. The Fed will keep tightening and force a recession and hard landing. And if they cause a bad recession, it may be difficult to stimulate back out of it.

The Fed is walking a tightrope and usually falls.

Struthers Stock Report Disclaimers: 

All forecasts and recommendations are based on opinion. Markets change direction with consensus beliefs, which may change at any time and without notice. The author/publisher of this publication has taken every precaution to provide the most accurate information possible. The information & data were obtained from sources believed to be reliable, but because the information & data source are beyond the author’s control, no representation or guarantee is made that it is complete or accurate.

The reader accepts information on the condition that errors or omissions shall not be made the basis for any claim, demand or cause for action. Because of the ever-changing nature of information & statistics the author/publisher strongly encourages the reader to communicate directly with the company and/or with their personal investment adviser to obtain up to date information.

Past results are not necessarily indicative of future results. Any statements non-factual in nature constitute only current opinions, which are subject to change. The author/publisher may or may not have a position in the securities and/or options relating thereto, & may make purchases and/or sales of these securities relating thereto from time to time in the open market or otherwise. Neither the information, nor opinions expressed, shall be construed as a solicitation to buy or sell any stock, futures or options contract mentioned herein. The author/publisher of this letter is not a qualified financial adviser & is not acting as such in this publication.

Disclosures: 

Charts provided by the author.

1) Ron Struthers: I, or members of my immediate household or family, own shares of the following companies mentioned in this article: None. I personally am, or members of my immediate household or family are, paid by the following companies mentioned in this article: None. My company currently has a financial relationship with the following companies mentioned in this article: None. I determined which companies would be included in this article based on my research and understanding of the sector.

2) The following companies mentioned in this article are billboard sponsors of Streetwise Reports: None. Click here for important disclosures about sponsor fees. The information provided above is for informational purposes only and is not a recommendation to buy or sell any security.

3) Statements and opinions expressed are the opinions of the author and not of Streetwise Reports or its officers. The author is wholly responsible for the validity of the statements. The author was not paid by Streetwise Reports for this article. Streetwise Reports was not paid by the author to publish or syndicate this article. Streetwise Reports requires contributing authors to disclose any shareholdings in, or economic relationships with, companies that they write about. Streetwise Reports relies upon the authors to accurately provide this information and Streetwise Reports has no means of verifying its accuracy.

4) This article does not constitute investment advice. Each reader is encouraged to consult with his or her individual financial professional and any action a reader takes as a result of information presented here is his or her own responsibility. By opening this page, each reader accepts and agrees to Streetwise Reports’ terms of use and full legal disclaimer. This article is not a solicitation for investment. Streetwise Reports does not render general or specific investment advice and the information on Streetwise Reports should not be considered a recommendation to buy or sell any security. Streetwise Reports does not endorse or recommend the business, products, services, or securities of any company mentioned on Streetwise Reports.

5) From time to time, Streetwise Reports LLC and its directors, officers, employees, or members of their families, as well as persons interviewed for articles and interviews on the site, may have a long or short position in the securities mentioned. Directors, officers, employees, or members of their immediate families are prohibited from making purchases and/or sales of those securities in the open market or otherwise from the time of the decision to publish an article until three business days after the publication of the article. The foregoing prohibition does not apply to articles that in substance only restate previously published company releases.


Bringing manufacturing back to the US requires political will, but success hinges on training American workers

By Amitrajeet A. Batabyal, Rochester Institute of Technology 

Supply chain disruptions during COVID-19 brought to light how interdependent nations are when it comes to manufacturing. The inability of the U.S. to produce such needed goods as test kits and personal protective equipment during the pandemic revealed our vulnerabilities as a nation.
China’s rise as a global production superpower has further underscored the weaknesses of American manufacturing.

In addition to fixing supply chain disruptions, bringing manufacturing back to the U.S. will benefit national security. Advanced computer chips, for example, are disproportionately made by a single firm, the Taiwan Semiconductor Manufacturing Co. These microchips are critical to smartphones, medical devices and self-driving cars, as well as military technology. TSMC, from a U.S. national security perspective, is located too close to China. Taiwan’s proximity to China makes it vulnerable because the Chinese government threatens to use force to unify Taiwan with the mainland.

Workers wearing blue clean suits in a manufacturing plant.
Chip technology makes production more efficient, reducing the need for people and jobs.
Glsun Mall for Unsplash, CC BY-SA

My research and that of others examines how the lack of manufacturing competitiveness in the U.S. leaves the U.S. vulnerable to shortages of critical goods during times of geopolitical disruption and global competition. The strategies the U.S. employs in bringing back manufacturing, along with innovative practices, will be key to ensure national security.

Strengthening national security

President Joe Biden has signed two bills that propose to rebuild American manufacturing. The CHIPS and Science Act of 2022 will provide US$52.7 billion for American semiconductor research, development, manufacturing and workforce development.

The Inflation Reduction Act of 2022 will invest $369 billion to promote a clean energy economy, in part by offering generous incentives for U.S.-made electric cars.

A computer chip with a black square surrounded by metal dots and lines on a green board.
Taiwan leads the world in computer chip manufacturing.
alerkiv for Unsplash, CC BY-SA

Training workers for new advanced manufacturing is another key factor in strengthening a sector that has become increasingly reliant on technology. In fact, while the number of jobs in American manufacturing fell by 25% after 2000, manufacturing output did not decline. Still, American manufacturing is facing a massive shortage of labor, especially among those workers with skills needed to power a new generation of manufacturing.

This need to train a new group of skilled workers explains why federal funds in the CHIPS Act are set aside for workforce development. Complementing federal legislation are programs such as America’s Cutting Edge, a national initiative that provides free online and in-person training designed to meet the growing need in the U.S. machining and machine tool industry for skilled operators, engineers and designers.

The power of innovation

It is impractical to bring all manufacturing back to the U.S. Offshoring is often less expensive. But research shows that certain types of in-country manufacturing can not only help secure national security but also spark innovation.

When research and development are conducted close to where the goods are physically made, this proximity can increase the likelihood of collaboration between these two activities. Collaboration can lead to greater efficiencies.

Product development can benefit as well. New research demonstrates that U.S. firms that located their manufacturing and R&D physically close to each other generated more patents than firms that did not.

Even so, the contribution of U.S. manufacturing firms to innovation declined greatly between 1977 and 2016. That’s because the benefits of locating manufacturing and R&D close to each other depends on the nature of the manufacturing itself, researchers have found.

For instance, the design of new drugs often requires manufacturing facilities to be located nearby. In that respect, co-locating manufacturing and research and development makes sense. This can be true for semiconductors as well. World-class chip manufacturers in Taiwan, such as TSMC, are located alongside a growing chip design industry, which permits designers to prototype and test new ideas quickly.

The U.S. and other countries are betting on the same potential benefits from co-location. For instance, to minimize the dependence on TSMC and, more generally, on foreign sources for chips, the European Union is spending 43 billion euros, while Japan is encouraging chip manufacturing at home with a $6.8 billion investment.

People are the bottom line

In a 2011 op-ed, I argued that while federal legislation to promote U.S. manufacturing could succeed in bringing more manufacturing back to the U.S., there was no guarantee that large numbers of jobs would be created – a key point made by those seeking to promote manufacturing.

Governments are generally poor at picking winning technologies and industries. Governmental mistakes in picking supposedly winning industries or sectors have, generally, led to a great deal of waste of taxpayer dollars.

Tiny figures stand on the open pages of a stamped passport.
Immigration policies designed to encourage highly skilled workers to come to the U.S. may be key to a stronger American manufacturing base.
mana5280 for Unsplash, CC BY-SA

In fact, market forces and informed company decisions should, I believe, play a larger role picking winners than federal investment. Where that investment comes from, what it supports and how much money is needed are critical questions.

If firms choose to relocate their companies to benefit from the synergy of R&D, then they must be able to attract the best human resource talent available. This is where U.S. investment can help build a more skilled workforce.

As pointed out by the economist Gary Pisano, many policymakers in the U.S. have long believed that manufacturing is an attractive sector for people with less education and training. Therefore, as a nation, we have not devoted many resources to train people with specialized skills in manufacturing.

This approach stands in stark contrast to the approach followed in Germany. There, practical work is valued by employers and employees and hence apprenticeship programs are routinely used to train workers who are well qualified to work in the manufacturing sector. While the U.S. approach is changing with recently announced investment by the White House through the CHIPS and the Inflation Reduction acts, more is needed.

Geopolitics is a significant consideration in the manufacture of computer chips.
Michael Dziedzic for Unsplash, CC BY-ND

It is my belief that if the U.S. is to remain an economic powerhouse, then corporations should not separate their workforce, sending cost-saving manufacturing offshore while retaining the innovators. Corporations like Apple have sent nearly all of their production offshore, retaining only the most skilled parts of the supply chain involving activities like R&D.

Instead, the U.S. needs to financially support firms wishing to bring manufacturing back by making it easier for such firms to find qualified manufacturing workers at home – and close to innovators when practical. This effort will bolster the U.S.‘s ability to be self-sufficient, innovative and secure in times of geopolitical conflicts.The Conversation

About the Authors:

Amitrajeet A. Batabyal, Distinguished Professor, Arthur J. Gosnell Professor of Economics, & Interim Head, Department of Sustainability, Rochester Institute of Technology

This article is republished from The Conversation under a Creative Commons license. Read the original article.