
By RoboForex Analytical Department
The EUR/USD pair has experienced a significant decline, stabilising around 1.0745 by Thursday. This movement follows the US releasing inflation data that exceeded expectations, underscoring the ongoing battle against inflation. The March consumer price index (CPI) increased by 0.4% month-on-month, matching February’s rise but surpassing the anticipated 0.3%. The annual inflation rate intensified to 3.5% from 3.2%, signalling persistent inflationary pressures.
Core inflation, which excludes volatile food and energy prices, also climbed by 0.4% in March, maintaining a year-on-year core 3.8% core CPI. Such elevated inflation levels suggest that the Federal Reserve might delay interest rate cuts, a sentiment reflected in the CME’s FedWatch tool. The likelihood of a rate reduction in June sharply declined to 18% post-CPI announcement, representing a significant drop from the 50% probability seen before the data release. Expectations now lean towards September for potential Federal Reserve actions.
Market predictions have adjusted to foresee a 43-45 basis point rate cut by the Fed within this year, a sharp decline from the 75 basis points expected at the week’s start and the 150 basis points anticipated at the year’s beginning. The minutes from the Federal Reserve’s recent meeting further solidified concerns, revealing policymakers’ dissatisfaction with inflation trends even before the latest price statistics.
This series of developments has bolstered the US dollar’s strength in the currency market.
EUR/USD technical analysis
Free Reports:
 Get our Weekly Commitment of Traders Reports - See where the biggest traders (Hedge Funds and Commercial Hedgers) are positioned in the futures markets on a weekly basis.
 Download Our Metatrader 4 Indicators – Put Our Free MetaTrader 4 Custom Indicators on your charts when you join our Weekly Newsletter
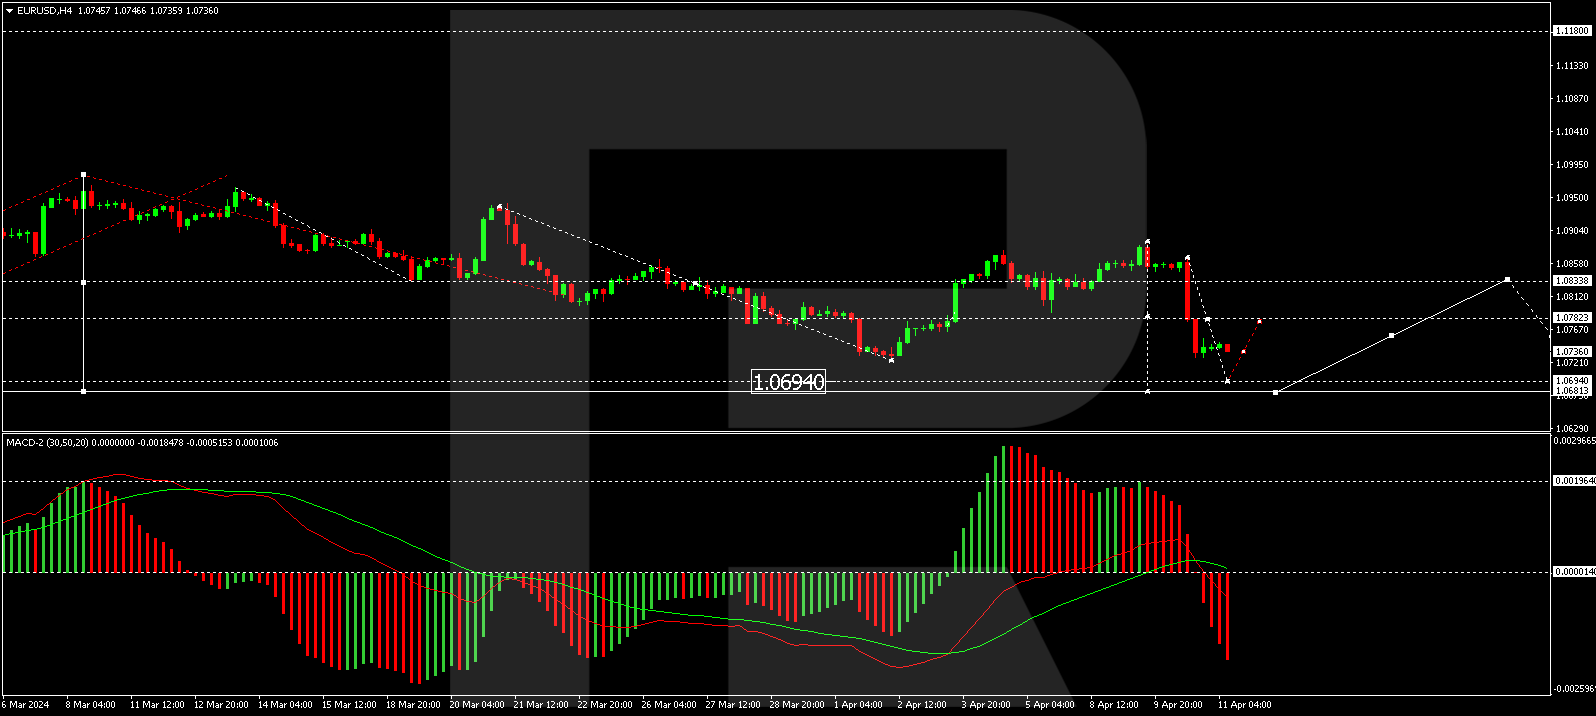
The H4 chart analysis for EUR/USD shows a correction to 1.0883, followed by a downturn to 1.0728 on the back of the recent news. A consolidation range has currently formed around this level, with a potential rise to 1.0784. A downward breakout from this range could lead to a decrease towards 1.0700. The MACD indicator, positioned below zero and trending downward, supports this potential scenario.
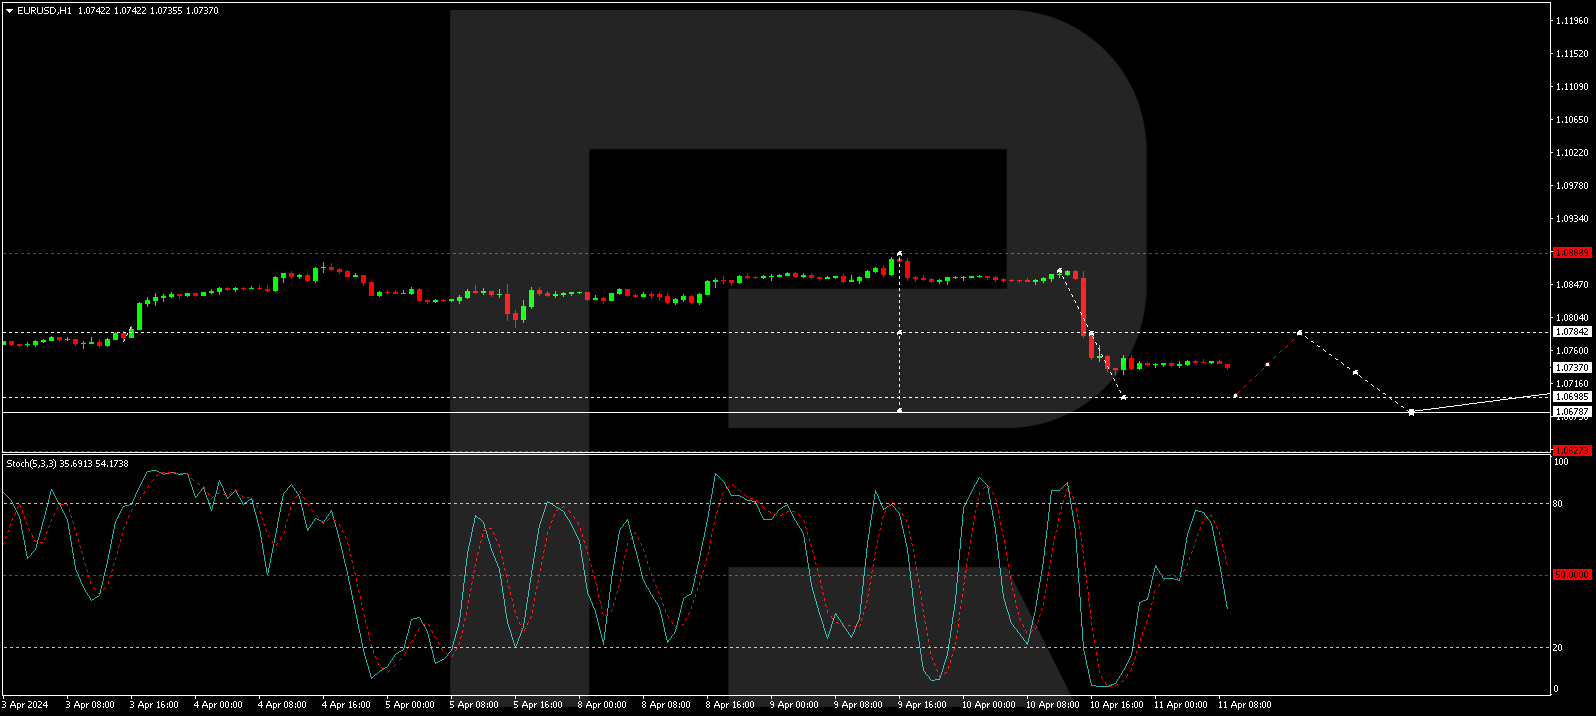
On the H1 chart, the downward trend towards 1.0700 continues, with a possible correction to 1.0780 expected. This may be followed by a further drop to 1.0680, representing an initial phase of a broader downtrend. The Stochastic oscillator, currently below 80, anticipates a continued decline towards 20, reinforcing the bearish outlook for the EUR/USD pair.
Disclaimer
Any forecasts contained herein are based on the author’s particular opinion. This analysis may not be treated as trading advice. RoboForex bears no responsibility for trading results based on trading recommendations and reviews contained herein.

- Oil prices fall back to pre‑war levels. Silver drops to a 7‑month low Jun 25, 2026
- Gold Falls to an Eight-Month Low: This May Not Be the Bottom Jun 25, 2026
- Stock indices came under heavy selling pressure amid growing skepticism about AI investments Jun 24, 2026
- The Pound Is Pressured Not by Politics, but by a Strong US Dollar Jun 24, 2026
- Global crude oil prices continued to decline. The AUD/USD exchange rate hit an 11‑week low Jun 23, 2026
- EUR/USD Remains Under Sellers’ Control as the Dollar Stays Strong Jun 23, 2026
- Gold Falls for the Third Consecutive Week: Is There Still Upside Potential? Jun 22, 2026
- Bank Indonesia raised its interest rate. Norges Bank and the SNB left rates unchanged Jun 19, 2026
- EUR/USD Loses Ground as Market Sentiment Favours the US Dollar Jun 19, 2026
- GBPUSD Awaits Bank of England Meeting Near April Lows Jun 18, 2026