
By RoboForex Analytical Department
The Japanese yen is experiencing a notable decline against the US dollar, with the USD/JPY pair currently hovering around 151.88 on Tuesday. Despite the US dollar’s instability, driven primarily by fluctuations in Treasury bond yields, the yen faces significant downward pressure.
Market participants remain cautious, particularly as the USD/JPY pair approaches levels that had previously triggered currency interventions by Japanese authorities. Despite aggressive verbal measures from Japan aimed at bolstering the yen, these efforts have shown limited success. Finance Minister Shunichi Suzuki has reiterated Japan’s commitment to addressing the yen’s excessive depreciation, echoing his earlier statements about readiness to intervene against further declines in its value.
However, the prospect of intervention, although a genuine threat, has thus far prevented the yen from breaching the 152.00 mark.
This substantial interest rate differential between the US Federal Reserve and the Bank of Japan (BoJ) is a critical factor contributing to the yen’s weakness. While the BoJ has only recently moved away from its negative interest rate policy, setting its lending rate back to zero, the Federal Reserve maintains a fund rate of 5.5% per annum, with no cuts implemented thus far.
Technical analysis of USD/JPY
Free Reports:
 Sign Up for Our Stock Market Newsletter – Get updated on News, Charts & Rankings of Public Companies when you join our Stocks Newsletter
 Get our Weekly Commitment of Traders Reports - See where the biggest traders (Hedge Funds and Commercial Hedgers) are positioned in the futures markets on a weekly basis.
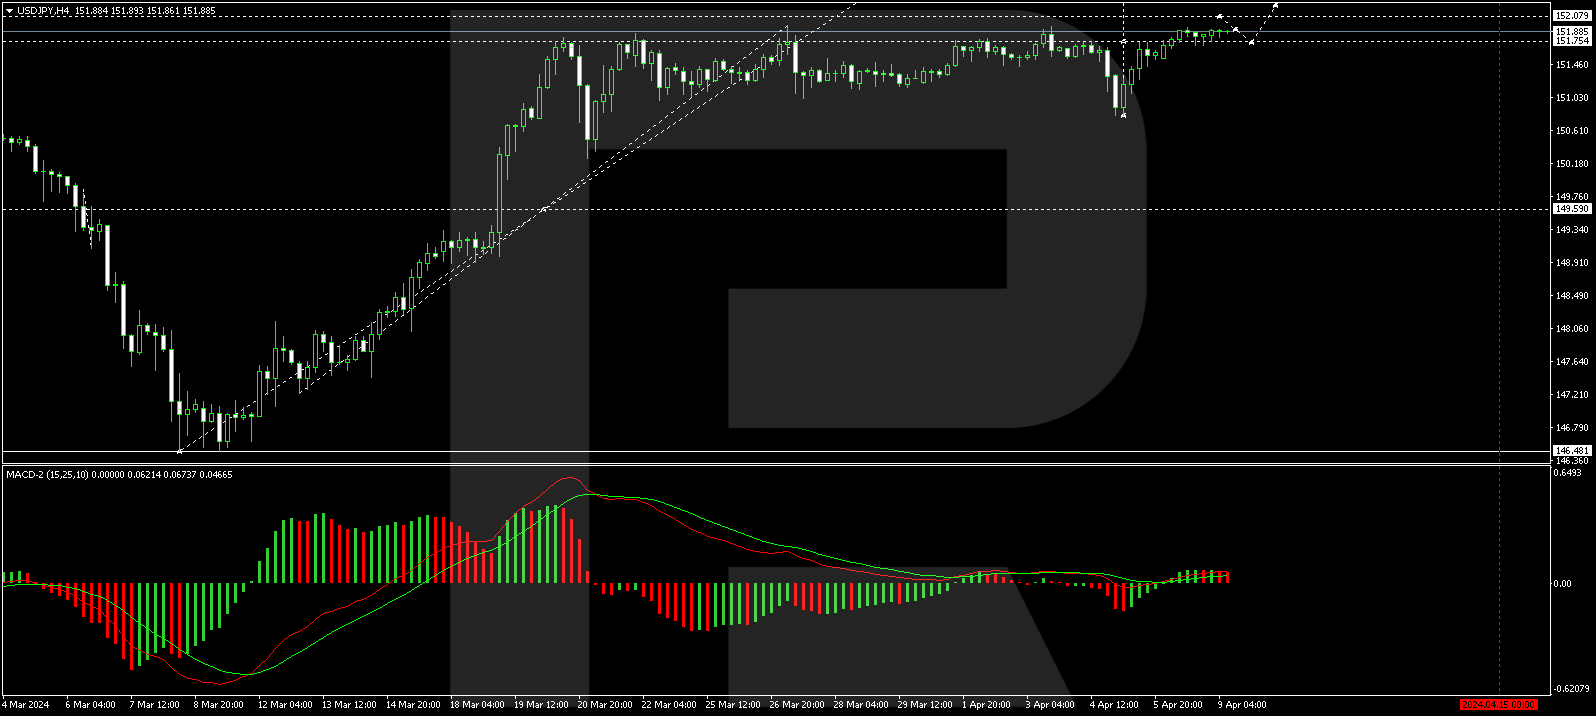
On the H4 chart, the USD/JPY pair has completed a growth wave to 151.75 and corrected to the 150.80 level. Another growth wave to 151.75 has been observed today, with the market forming a consolidation range around this level. An upward breakout from this range could lead to a rise to 152.07. After reaching this level, a correction to 151.75 (testing from above) may occur, followed by an increase to 152.70. This scenario is supported by the MACD oscillator, with its signal line above zero and poised to reach new highs.
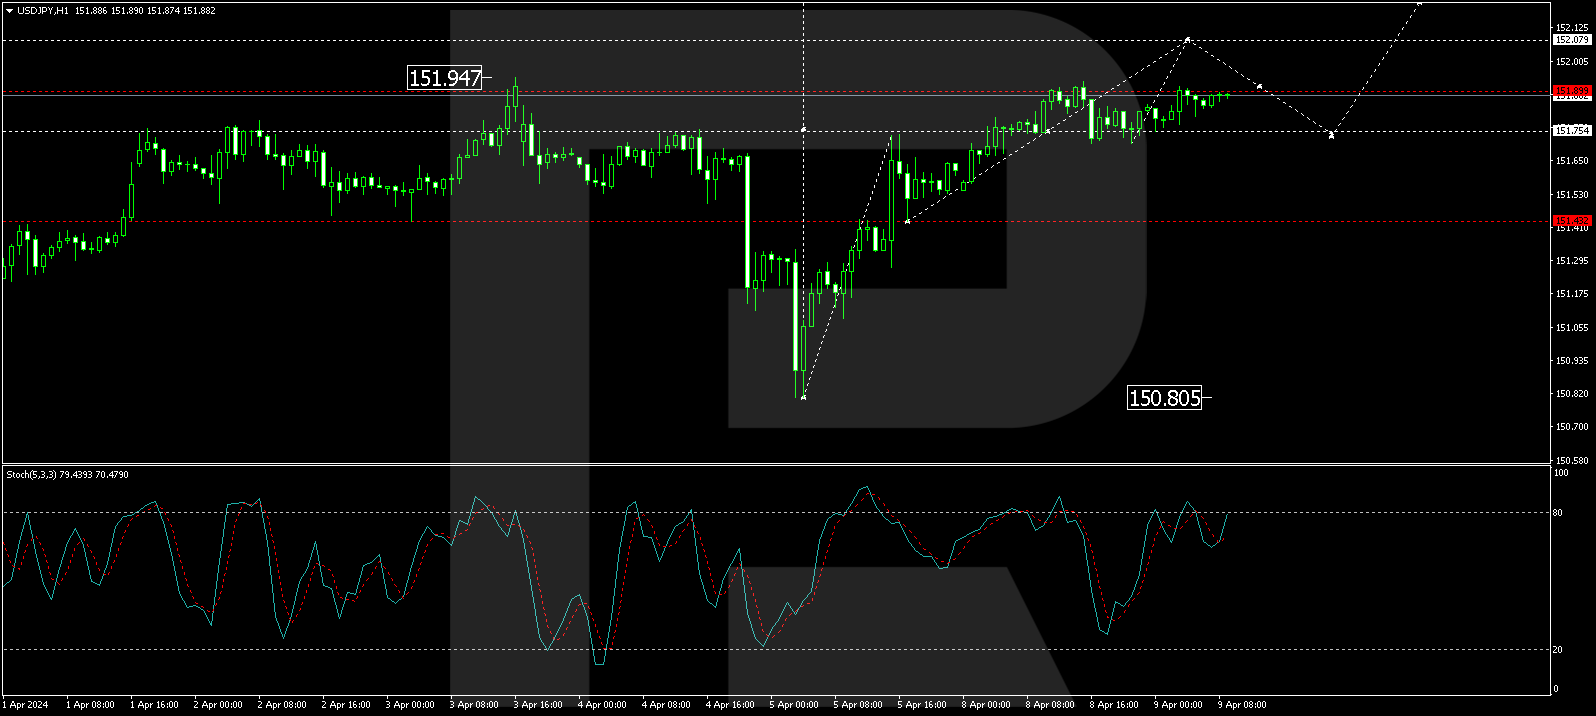
On the H1 chart, support at 151.75 has bolstered the development of a growth structure to 152.07. After achieving this target, a correction to 151.75 may be seen, potentially leading to further growth towards 152.70, the main target of the growth wave. The Stochastic oscillator confirms this analysis with its signal line above 50 and preparing to ascend to 80.
Disclaimer
Any forecasts contained herein are based on the author’s particular opinion. This analysis may not be treated as trading advice. RoboForex bears no responsibility for trading results based on trading recommendations and reviews contained herein.

- Oil prices fall back to pre‑war levels. Silver drops to a 7‑month low Jun 25, 2026
- Gold Falls to an Eight-Month Low: This May Not Be the Bottom Jun 25, 2026
- Stock indices came under heavy selling pressure amid growing skepticism about AI investments Jun 24, 2026
- The Pound Is Pressured Not by Politics, but by a Strong US Dollar Jun 24, 2026
- Global crude oil prices continued to decline. The AUD/USD exchange rate hit an 11‑week low Jun 23, 2026
- EUR/USD Remains Under Sellers’ Control as the Dollar Stays Strong Jun 23, 2026
- Gold Falls for the Third Consecutive Week: Is There Still Upside Potential? Jun 22, 2026
- Bank Indonesia raised its interest rate. Norges Bank and the SNB left rates unchanged Jun 19, 2026
- EUR/USD Loses Ground as Market Sentiment Favours the US Dollar Jun 19, 2026
- GBPUSD Awaits Bank of England Meeting Near April Lows Jun 18, 2026