
By RoboForex Analytical Department
On Friday, the price of gold reached an unprecedented peak, soaring above 2,230 USD. The global capital market experienced low activity due to the observance of Good Friday in many Catholic countries, leading to abrupt movements by investors.
The surge in gold prices is primarily attributed to anticipations that global financial regulators will lower lending costs within the year. Furthermore, escalating geopolitical tensions have bolstered gold’s appeal as a safe-haven asset.
March saw gold’s price increase by over 9%, marking a significant uptick for what is typically considered a conservative investment. Several key developments support this rally:
- US Federal Reserve’s rate cut intentions: in its March meeting, the Fed outlined plans to reduce interest rates three times over the year.
- Bank of Japan’s policy shift: this month, the Bank of Japan abandoned its negative interest rate policy.
- Swiss National Bank’s rate adjustment: in an unexpected move, the Swiss National Bank lowered its interest rate, sparking speculation that other financial authorities might take similar actions.
Gold’s status as a safe asset has been reinforced amidst a market climate favouring risk aversion, driven by ongoing geopolitical instability, especially in the Middle East.
Technical analysis of XAU/USD
Free Reports:
 Sign Up for Our Stock Market Newsletter – Get updated on News, Charts & Rankings of Public Companies when you join our Stocks Newsletter
 Get our Weekly Commitment of Traders Reports - See where the biggest traders (Hedge Funds and Commercial Hedgers) are positioned in the futures markets on a weekly basis.
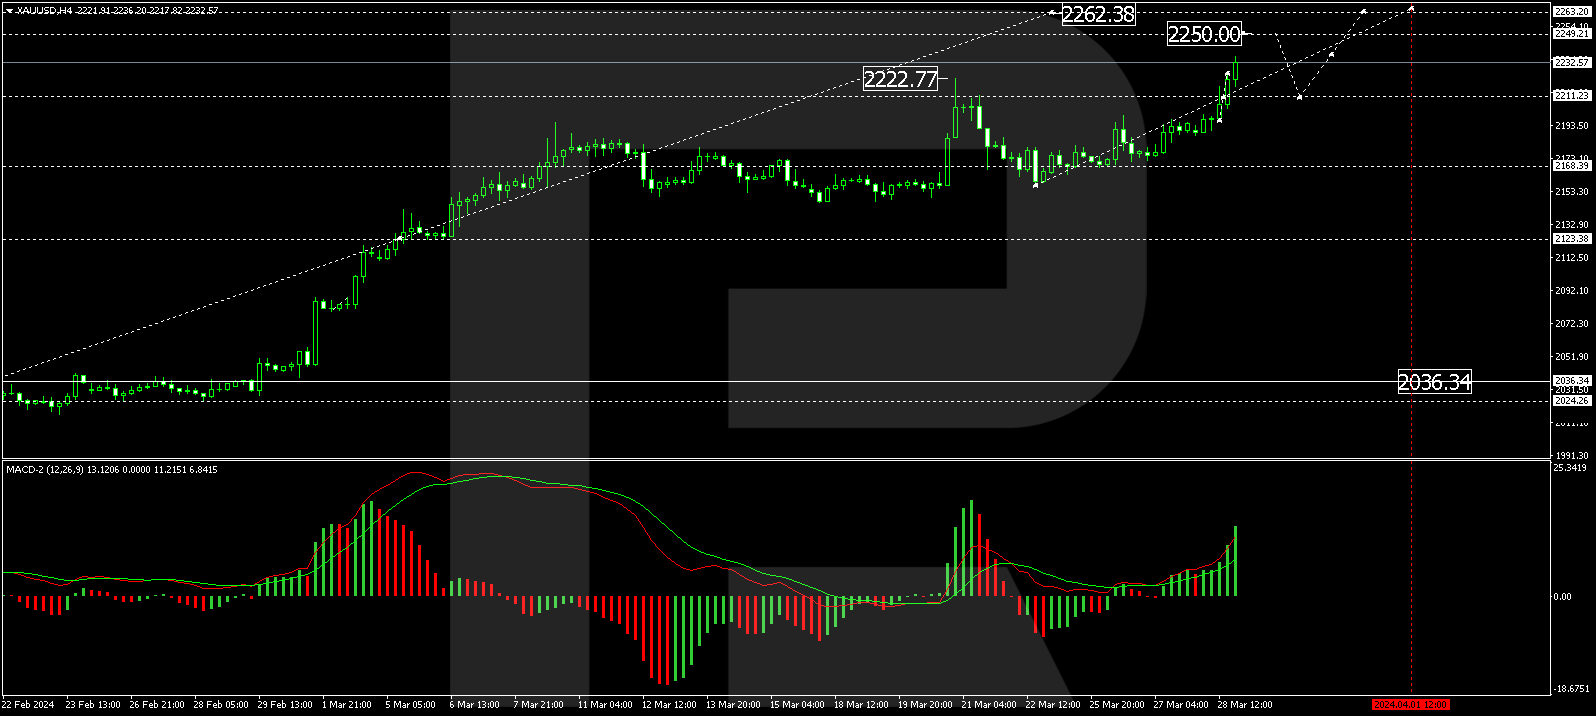
H4 chart analysis: The H4 chart reveals that XAU/USD prices have broken out of their consolidation range, embarking on the fifth wave of growth. An upward movement towards 2,250 USD is currently forming. Following this, a corrective movement to 2,211.11 USD may occur, potentially leading to a new growth phase targeting 2,262.38 USD. This scenario is supported by the MACD indicator, with the signal line positioned above zero and trending upwards.
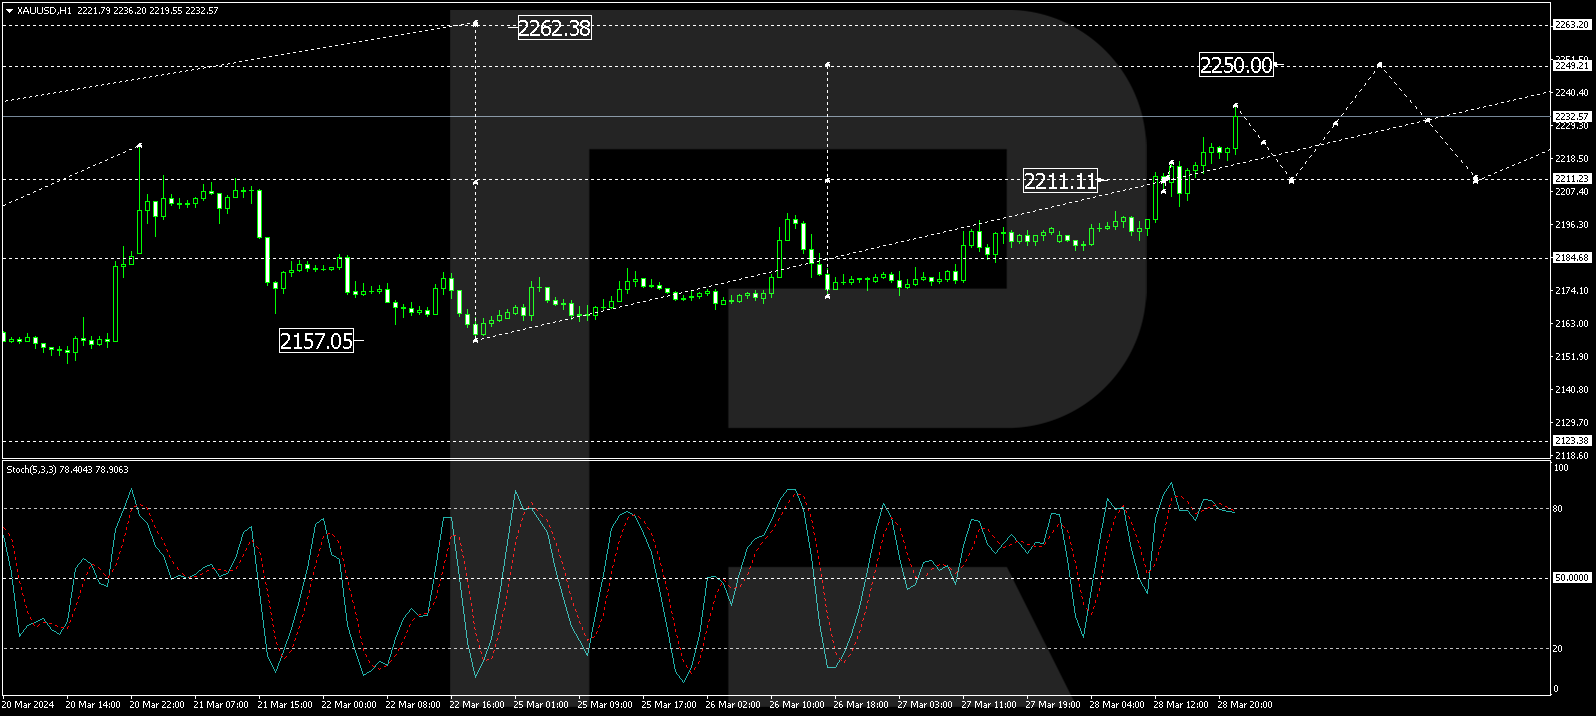
H1 chart analysis: On the H1 chart, XAU/USD established a consolidation range of around 2,211.11 USD. An upward breakout from this range could set the stage for a rise towards 2,250 USD. After achieving this level, a correction towards 2,222.50 USD may unfold before considering a further ascent to 2,262.38 USD and a pullback to 2,180.60 USD. The Stochastic oscillator, currently above 80, indicates a forthcoming decline to 20, aligning with this analysis.
Disclaimer
Any forecasts contained herein are based on the author’s particular opinion. This analysis may not be treated as trading advice. RoboForex bears no responsibility for trading results based on trading recommendations and reviews contained herein.

- Stock indices came under heavy selling pressure amid growing skepticism about AI investments Jun 24, 2026
- The Pound Is Pressured Not by Politics, but by a Strong US Dollar Jun 24, 2026
- Global crude oil prices continued to decline. The AUD/USD exchange rate hit an 11‑week low Jun 23, 2026
- EUR/USD Remains Under Sellers’ Control as the Dollar Stays Strong Jun 23, 2026
- Gold Falls for the Third Consecutive Week: Is There Still Upside Potential? Jun 22, 2026
- Bank Indonesia raised its interest rate. Norges Bank and the SNB left rates unchanged Jun 19, 2026
- EUR/USD Loses Ground as Market Sentiment Favours the US Dollar Jun 19, 2026
- GBPUSD Awaits Bank of England Meeting Near April Lows Jun 18, 2026
- Markets disliked the results of the FOMC meeting. HKMA followed the Fed and kept its rate unchanged. Jun 18, 2026
- Gold Surges 2% Since Week Opening Amid Geopolitical Shifts and Fed Expectations Jun 17, 2026