
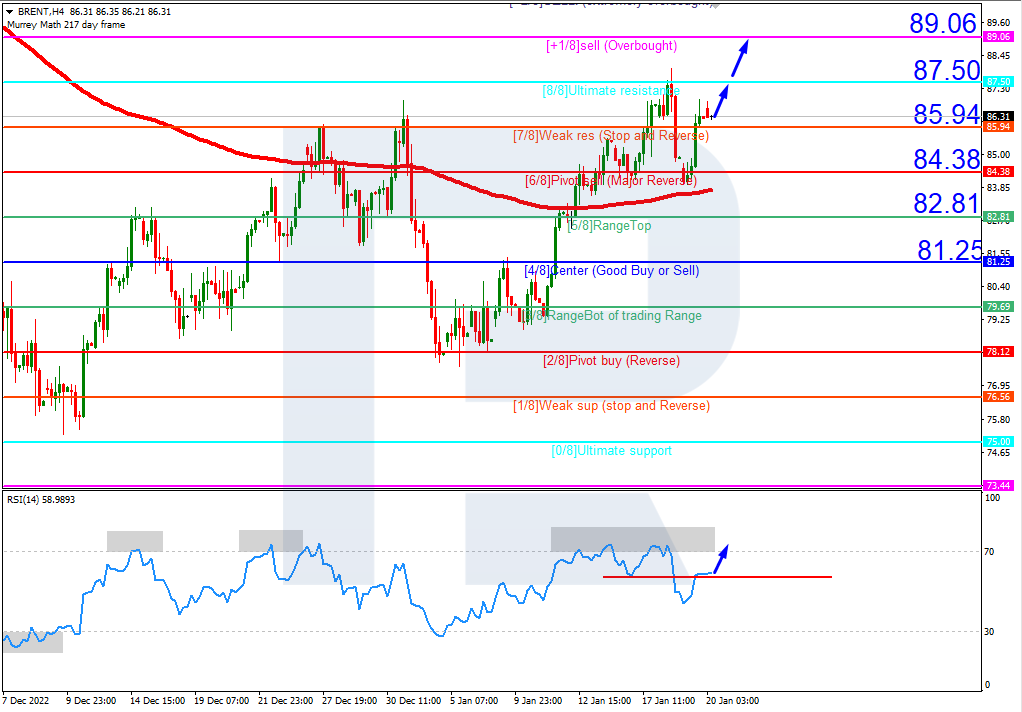
Brent
On H4, the quotes are above the 200-day Moving Average, implying an uptrend. The RSI has risen above the resistance line. A breakaway of 8/8 (87.50) upwards should be expected, followed by growth to the resistance line of +1/8 (89.06). The scenario can be cancelled by a downward breakaway of the support level at 6/8 (84.38), which might lead to a trend reversal and falling to 4/8 (81.25).

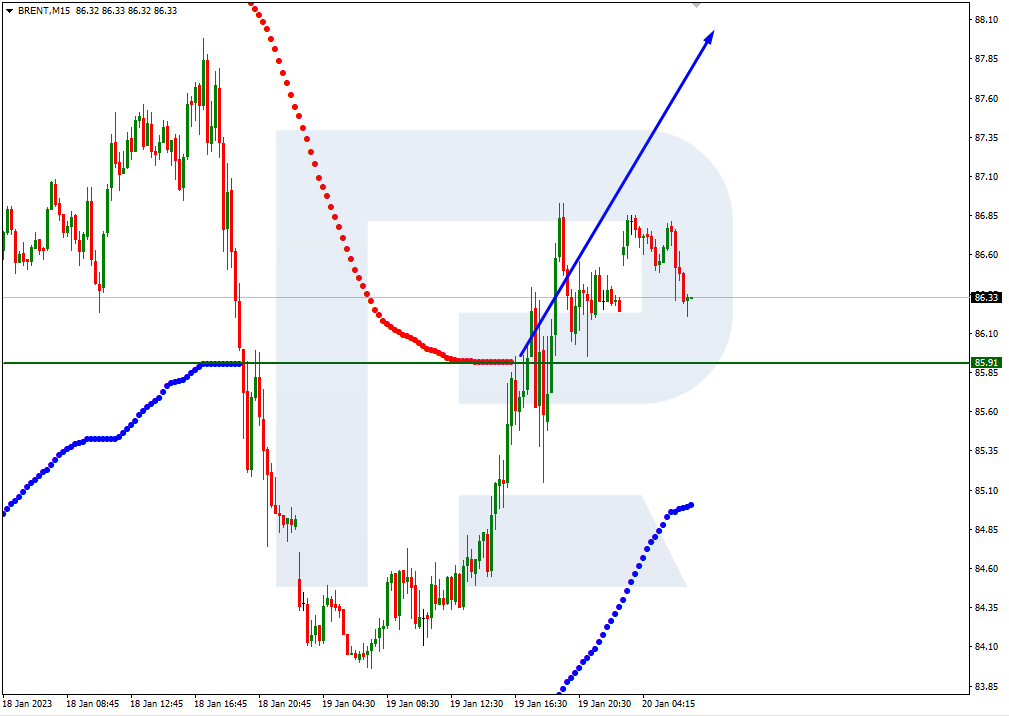
On M15, the upper line of VoltyChannel is broken away, which indicates an uptrend and increases the probability of further growth.
Free Reports:
 Get our Weekly Commitment of Traders Reports - See where the biggest traders (Hedge Funds and Commercial Hedgers) are positioned in the futures markets on a weekly basis.
 Download Our Metatrader 4 Indicators – Put Our Free MetaTrader 4 Custom Indicators on your charts when you join our Weekly Newsletter
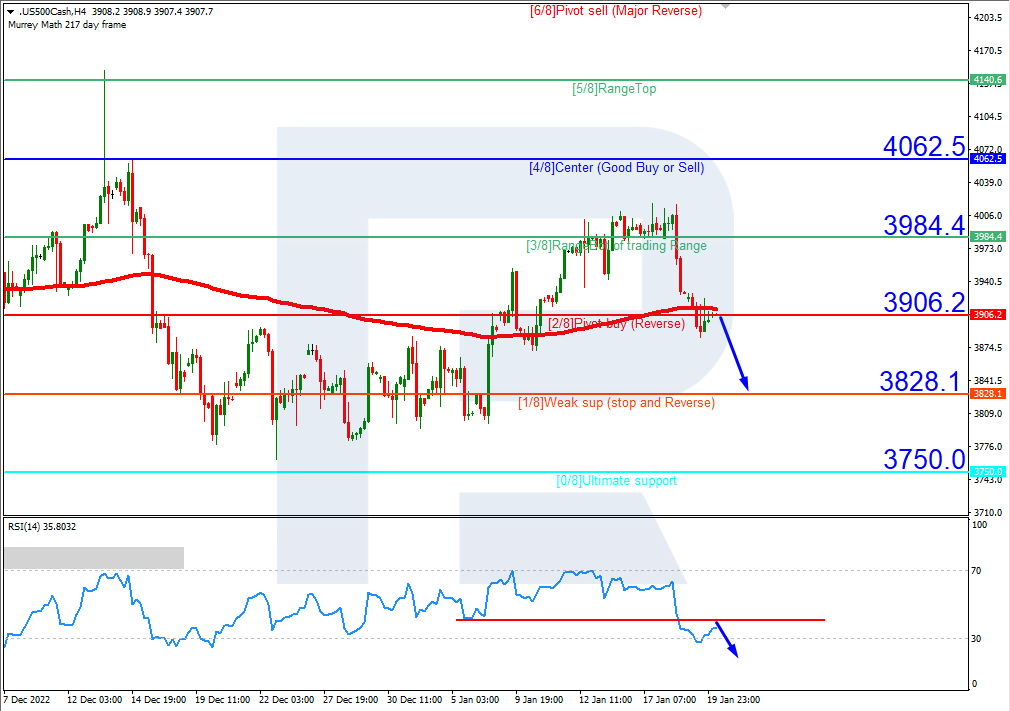
S&P 500
On H4, the S&P 500 index quotes has broken through the 200-day Moving Average and are now under it, which indicates probable development of a downtrend. The RSI is nearing the resistance level. As a result, a bounce off 2/8 (3906.2) should be expected, followed by falling to the support level of 1/8 (3828.1). The scenario can be cancelled by rising over 3/8 (3984.4). In this case, the quotes might rise to the resistance level of 4/8 (4062.5).
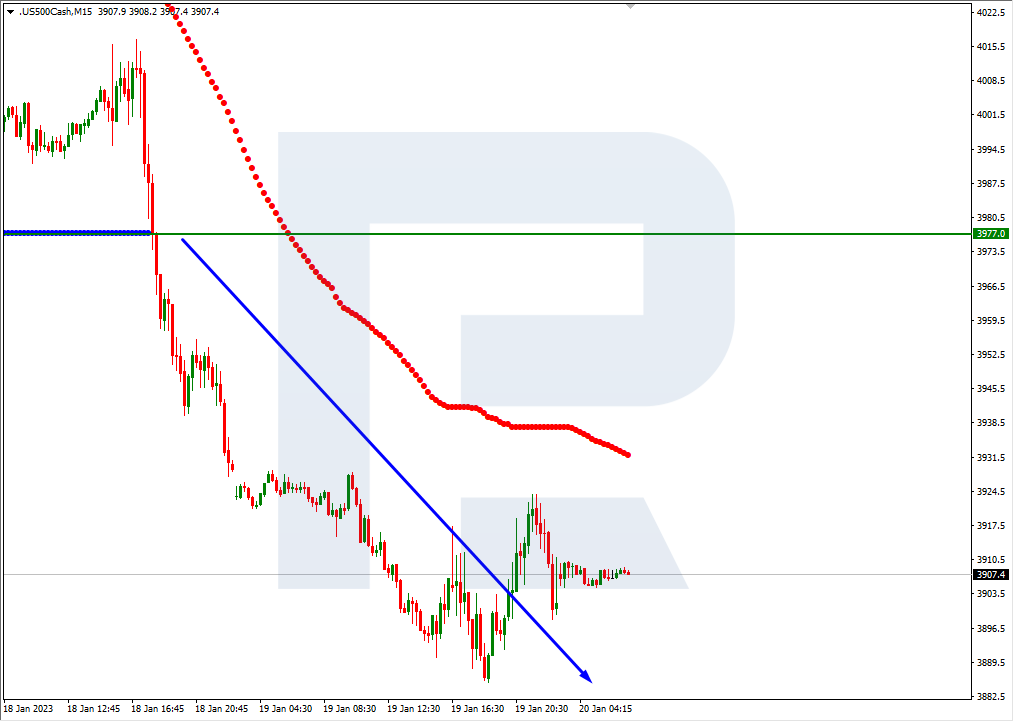
On M15, the lower line of VoltyChannel is broken, which increases the probability of further falling of the price.
Article By RoboForex.com
Attention!
Forecasts presented in this section only reflect the author’s private opinion and should not be considered as guidance for trading. RoboForex LP bears no responsibility for trading results based on trading recommendations described in these analytical reviews.

- COT Metals Charts: Weekly Speculator Changes led by Copper Jul 26, 2026
- COT Bonds Charts: Speculator Bets led by SOFR 3-Months & 5-Year Bonds Jul 26, 2026
- COT Energy Charts: Weekly Speculator Bets led by WTI Crude & Natural Gas Jul 26, 2026
- COT Soft Commodities Charts: Weekly Speculator Bets led by Corn & Soybeans Jul 26, 2026
- The US introduces new import tariffs for 60 countries. Brent crude surpasses $100 per barrel Jul 24, 2026
- USD/JPY Breaks Records: Nothing Slows the Yen’s Decline Jul 24, 2026
- Oil prices reached a 6‑week high. The AUD strengthened on the back of a strong labor‑market report Jul 23, 2026
- EUR/USD Recovers as Dollar Weakens Jul 23, 2026
- Bitcoin rose to $66,000. The New Zealand dollar continues to strengthen Jul 22, 2026
- Inflationary pressure is easing in Canada. In New Zealand, on the contrary, inflation is rising Jul 21, 2026