
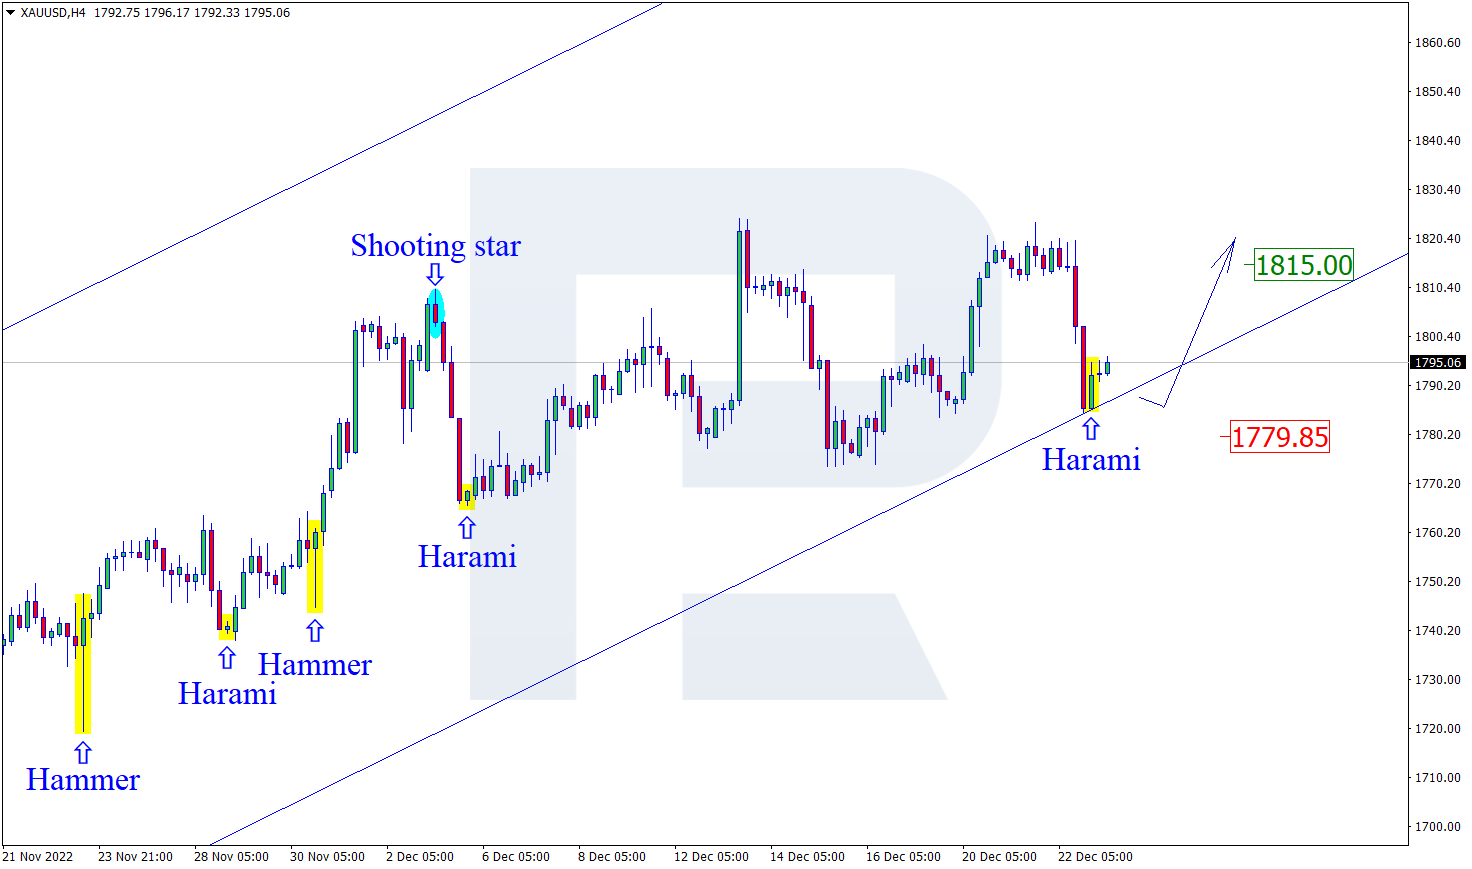
XAUUSD, “Gold vs US Dollar”
At the support level, gold has formed a Harami reversal pattern. Currently, the pair is going by the pattern in an ascending wave. The goal of the growth might be 1815.00. Upon testing the resistance level, the pair will get the chance to break through it and continue the uptrend. However, the quotes may pull back to 1779.85 before further growth.

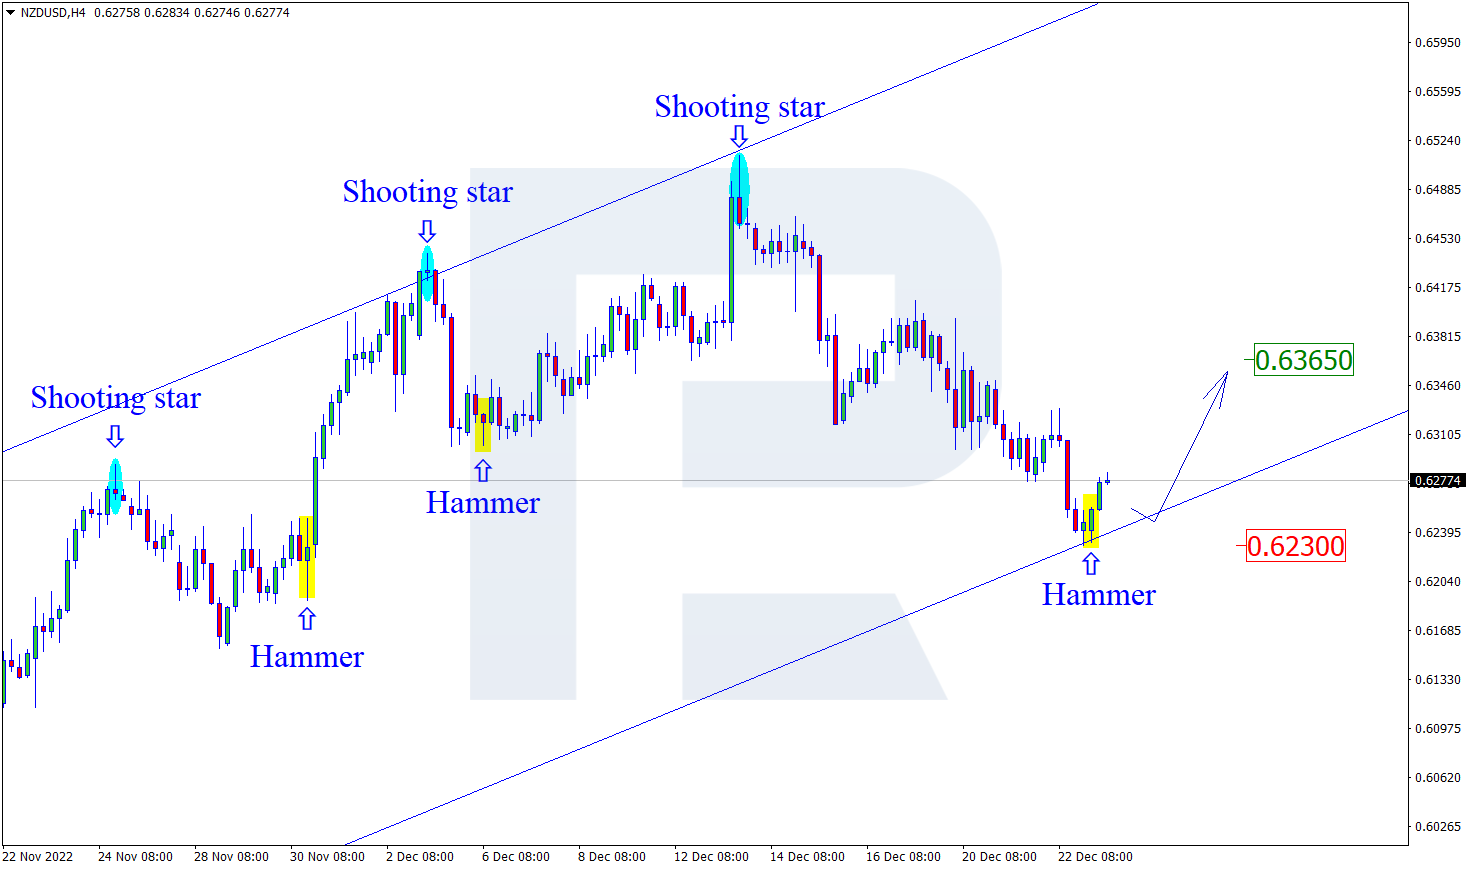
NZDUSD, “New Zealand Dollar vs US Dollar”
On H4, at the support level, the pair has formed a Hammer reversal pattern. Currently, the pair is going by the signal in an ascending wave. The goal of the growth might be 0.6365. After the resistance level is broken away, the quotes will get a chance to continue the downtrend. However, the price may pull back to 0.6230 before continuing growth.
Free Reports:
 Sign Up for Our Stock Market Newsletter – Get updated on News, Charts & Rankings of Public Companies when you join our Stocks Newsletter
 Get our Weekly Commitment of Traders Reports - See where the biggest traders (Hedge Funds and Commercial Hedgers) are positioned in the futures markets on a weekly basis.
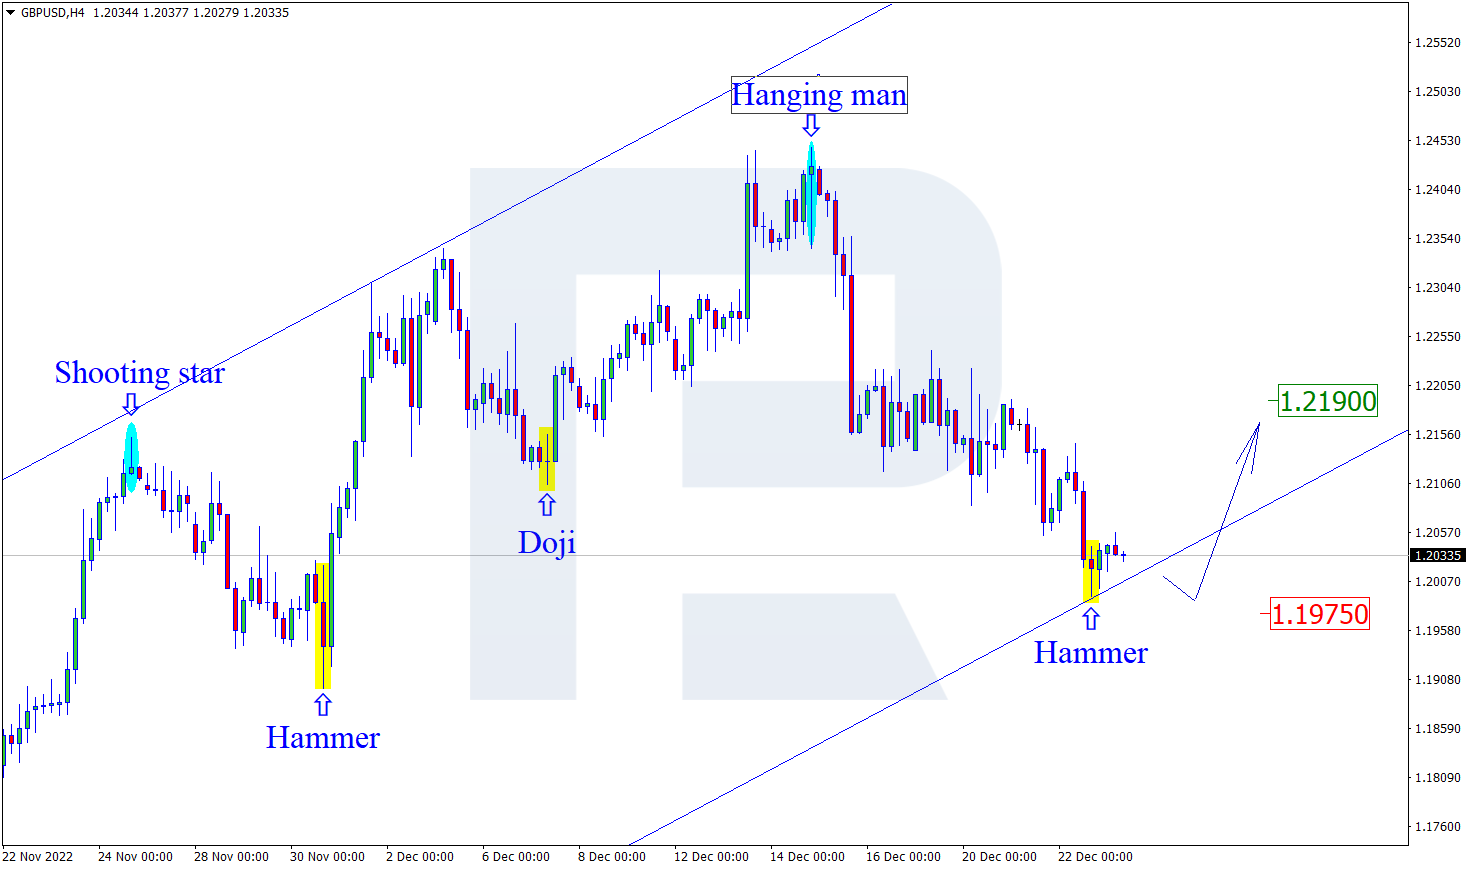
GBPUSD, “Great Britain Pound vs US Dollar”
On H4, at the support level, the pair has formed a Hammer reversal pattern. Currently, the pair is going by the signal in an ascending wave. The goal if the growth might be the resistance level at 1.2190. However, the price may pull back to 1.1975 before continuing with the uptrend.
Article By RoboForex.com
Attention!
Forecasts presented in this section only reflect the author’s private opinion and should not be considered as guidance for trading. RoboForex LP bears no responsibility for trading results based on trading recommendations described in these analytical reviews.

- EUR/USD: The Advantage Remains with the Dollar Jun 29, 2026
- Escalation of the US–Iran conflict is once again supporting the rise in oil prices Jun 29, 2026
- Oil prices fall back to pre‑war levels. Silver drops to a 7‑month low Jun 25, 2026
- Gold Falls to an Eight-Month Low: This May Not Be the Bottom Jun 25, 2026
- Stock indices came under heavy selling pressure amid growing skepticism about AI investments Jun 24, 2026
- The Pound Is Pressured Not by Politics, but by a Strong US Dollar Jun 24, 2026
- Global crude oil prices continued to decline. The AUD/USD exchange rate hit an 11‑week low Jun 23, 2026
- EUR/USD Remains Under Sellers’ Control as the Dollar Stays Strong Jun 23, 2026
- Gold Falls for the Third Consecutive Week: Is There Still Upside Potential? Jun 22, 2026
- Bank Indonesia raised its interest rate. Norges Bank and the SNB left rates unchanged Jun 19, 2026