
BRENT
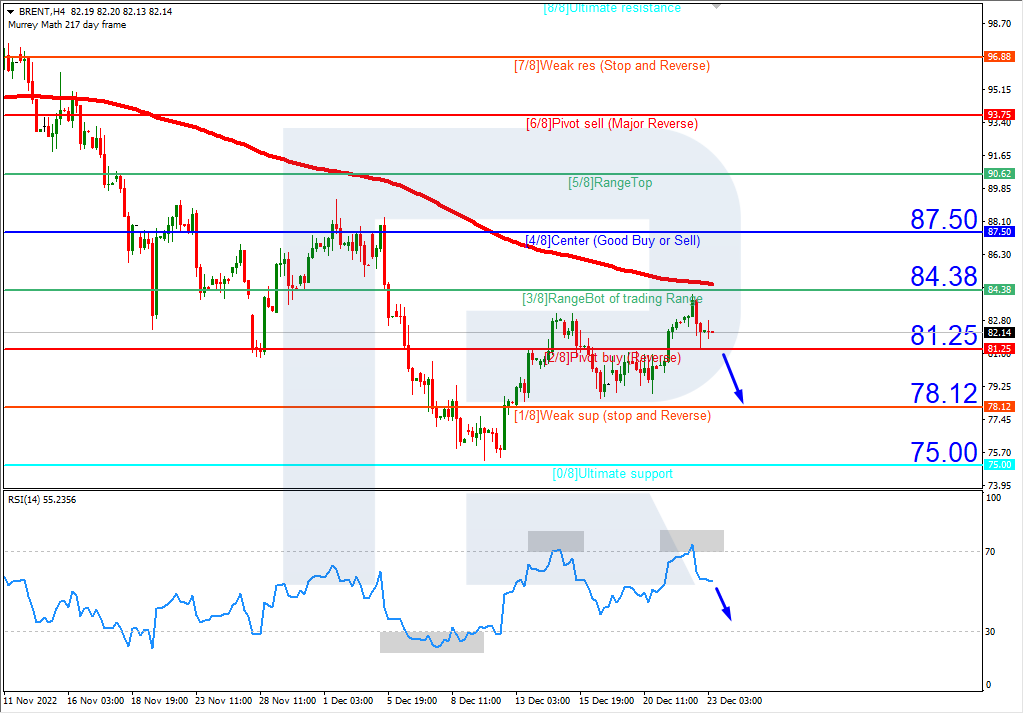
On H4, the quotes are under the 200-day Moving Average, which indicates prevalence of a downtrend. The RSI has exited the overbought area. A test of 2/8 (81.25) should be expected, followed by a breakaway and falling to the support level of 1/8 (78.12). The scenario can be cancelled by an upwards breakaway of the resistance level of 3/8 (84.38), which might lead to a trend reversal and price growth to the resistance level of 4/8 (87.50).

On M15, the lower line of VoltyChannel is broken away, which confirms the downtrend and increases the chances for further price falling.

Free Reports:
 Download Our Metatrader 4 Indicators – Put Our Free MetaTrader 4 Custom Indicators on your charts when you join our Weekly Newsletter
 Get our Weekly Commitment of Traders Reports - See where the biggest traders (Hedge Funds and Commercial Hedgers) are positioned in the futures markets on a weekly basis.
S&P 500
On H4, the quotes have bounced off 0/8 (3750.0), which is the upper border of the oversold area. The RSI is testing the resistance line. The quotes are expected to rise above 1/8 (3906.2) and then reach the resistance level of 2/8 (4062.5). The scenario can be cancelled by a downward breakaway of the support level of 0/8 (3750.0). In this case, the S&P 500 index will continue falling, and the quotes might reach -1/8 (3593.8).

On M15, an additional signal confirming growth will be a breakaway of the upper border of VoltyChannel.

Article By RoboForex.com
Attention!
Forecasts presented in this section only reflect the author’s private opinion and should not be considered as guidance for trading. RoboForex LP bears no responsibility for trading results based on trading recommendations described in these analytical reviews.

- EUR/USD: The Advantage Remains with the Dollar Jun 29, 2026
- Escalation of the US–Iran conflict is once again supporting the rise in oil prices Jun 29, 2026
- Oil prices fall back to pre‑war levels. Silver drops to a 7‑month low Jun 25, 2026
- Gold Falls to an Eight-Month Low: This May Not Be the Bottom Jun 25, 2026
- Stock indices came under heavy selling pressure amid growing skepticism about AI investments Jun 24, 2026
- The Pound Is Pressured Not by Politics, but by a Strong US Dollar Jun 24, 2026
- Global crude oil prices continued to decline. The AUD/USD exchange rate hit an 11‑week low Jun 23, 2026
- EUR/USD Remains Under Sellers’ Control as the Dollar Stays Strong Jun 23, 2026
- Gold Falls for the Third Consecutive Week: Is There Still Upside Potential? Jun 22, 2026
- Bank Indonesia raised its interest rate. Norges Bank and the SNB left rates unchanged Jun 19, 2026