
Article By RoboForex.com
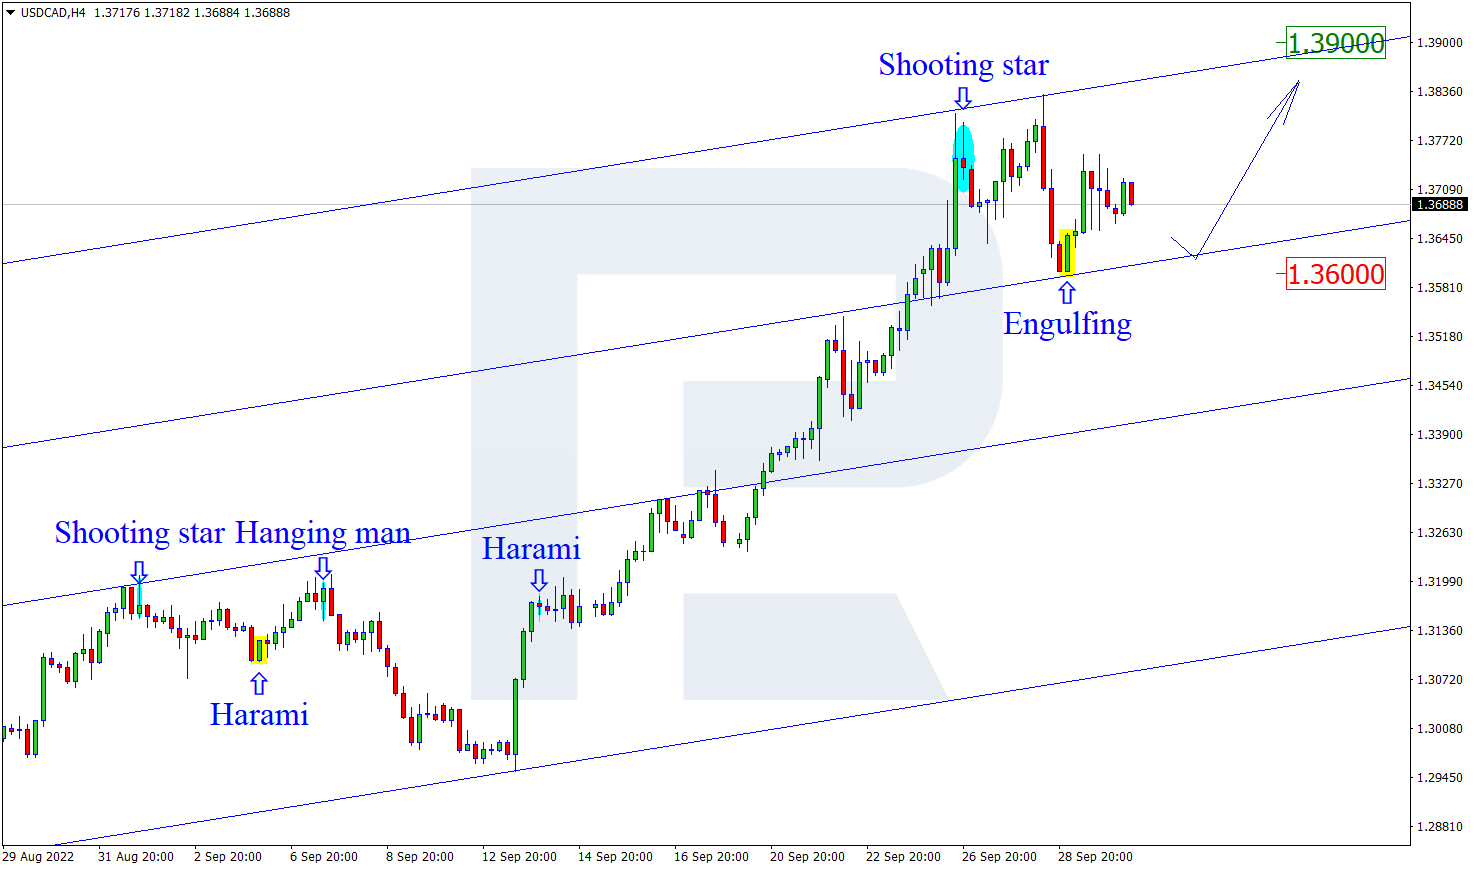
USDCAD, “US Dollar vs Canadian Dollar”
As we can see in the H4 chart, after forming an Engulfing reversal pattern close to the support level, USDCAD is reversing in the form of a new ascending wave. In this case, the upside target may be at 1.3900. Later, the market may break the resistance area and continue growing. However, an alternative scenario implies that the asset may correct to reach 1.3600 first and then resume the uptrend.

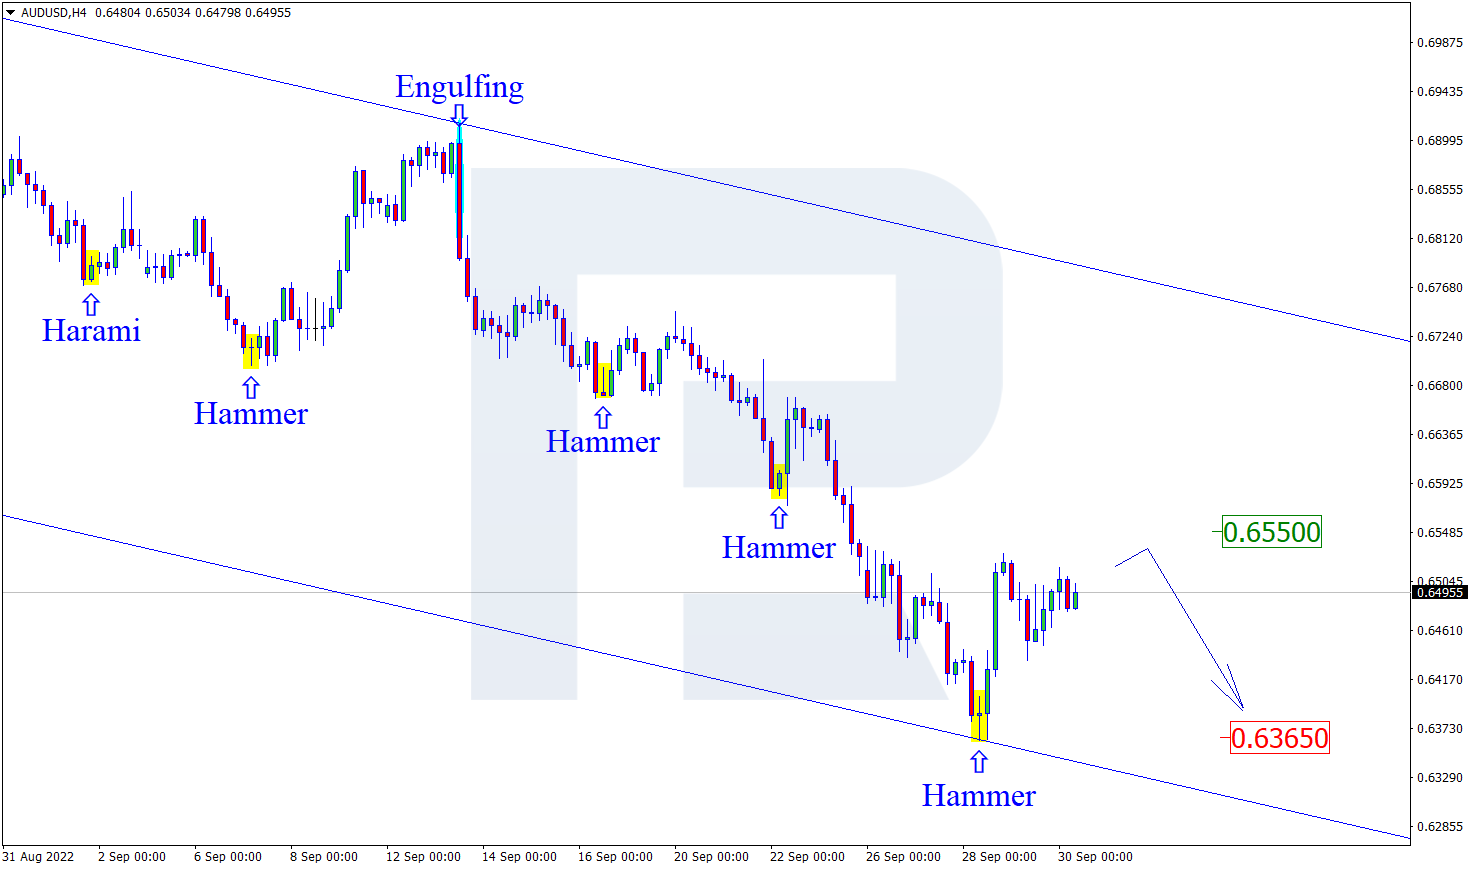
AUDUSD, “Australian Dollar vs US Dollar”
As we can see in the H4 chart, AUDUSD has formed a Hammer reversal pattern near the support area. At the moment, the asset is reversing in the form of a new correctional impulse. In this case, the upside correctional target may be the resistance level at 0.6550. After testing the level, the price may rebound from it and resume the descending tendency. At the same time, the opposite scenario implies that the price may fall to reach 0.6365 and continue the downtrend without any pullbacks up to resistance level.
Free Reports:
 Download Our Metatrader 4 Indicators – Put Our Free MetaTrader 4 Custom Indicators on your charts when you join our Weekly Newsletter
 Get our Weekly Commitment of Traders Reports - See where the biggest traders (Hedge Funds and Commercial Hedgers) are positioned in the futures markets on a weekly basis.
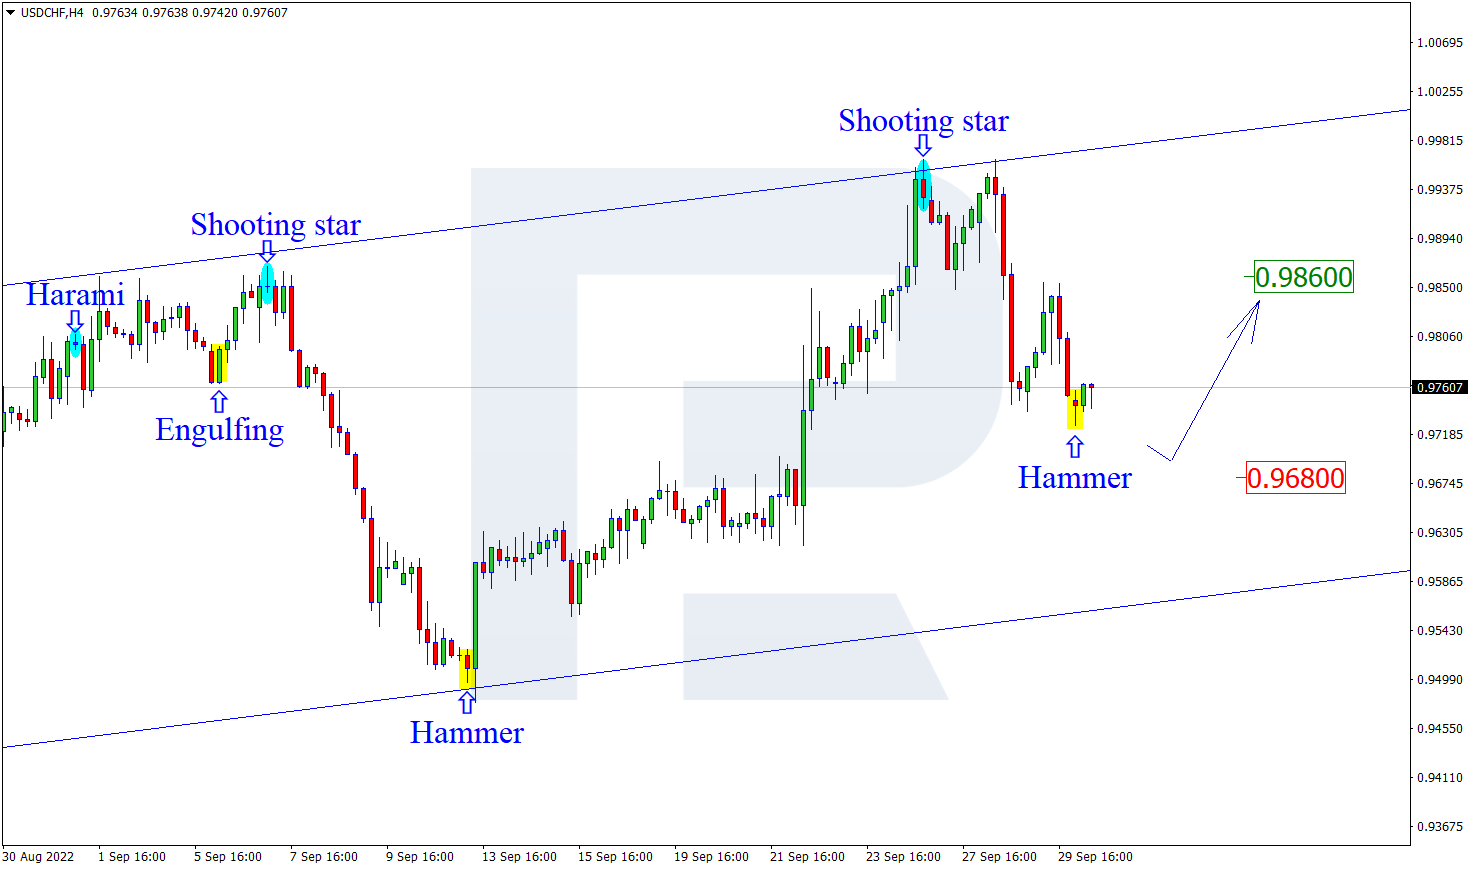
USDCHF, “US Dollar vs Swiss Franc”
As we can see in the H4 chart, the pair has formed a Hammer reversal pattern not far from the support area. At the moment, USDCHF may reverse in the form of a new ascending wave. In this case, the upside target may be the resistance level at 0.9860. After testing this level, the price may break it and continue trading upwards. Still, there might be an alternative scenario, in which the asset may correct to reach 0.9680 first and then resume the ascending tendency.
Article By RoboForex.com
Attention!
Forecasts presented in this section only reflect the author’s private opinion and should not be considered as guidance for trading. RoboForex LP bears no responsibility for trading results based on trading recommendations described in these analytical reviews.

- COT Metals Charts: Speculator Bets led by Steel Jun 14, 2026
- COT Bonds Charts: Speculator Bets led by 2-Year Bonds & Ultra 10-Year Bonds Jun 14, 2026
- COT Energy Charts: Speculator Bets led by Brent Oil Jun 14, 2026
- COT Soft Commodities Charts: Weekly Speculator Bets led lower by Corn and Soybean Meal Jun 14, 2026
- Today investors’ focus is directed at the historic IPO of SpaceX Jun 12, 2026
- USD/JPY Continues Its Climb: Is There a Limit? Jun 11, 2026
- Investors launched broad profit‑taking in the technology sector. The Bank of Canada kept its rate at 2.25% Jun 11, 2026
- Gold (XAU/USD) Faces Persistent Selling Pressure Jun 10, 2026
- The US technology sector once again came under a wave of selling Jun 10, 2026
- China has shifted to using its own strategic oil reserves Jun 9, 2026