
Article By RoboForex.com
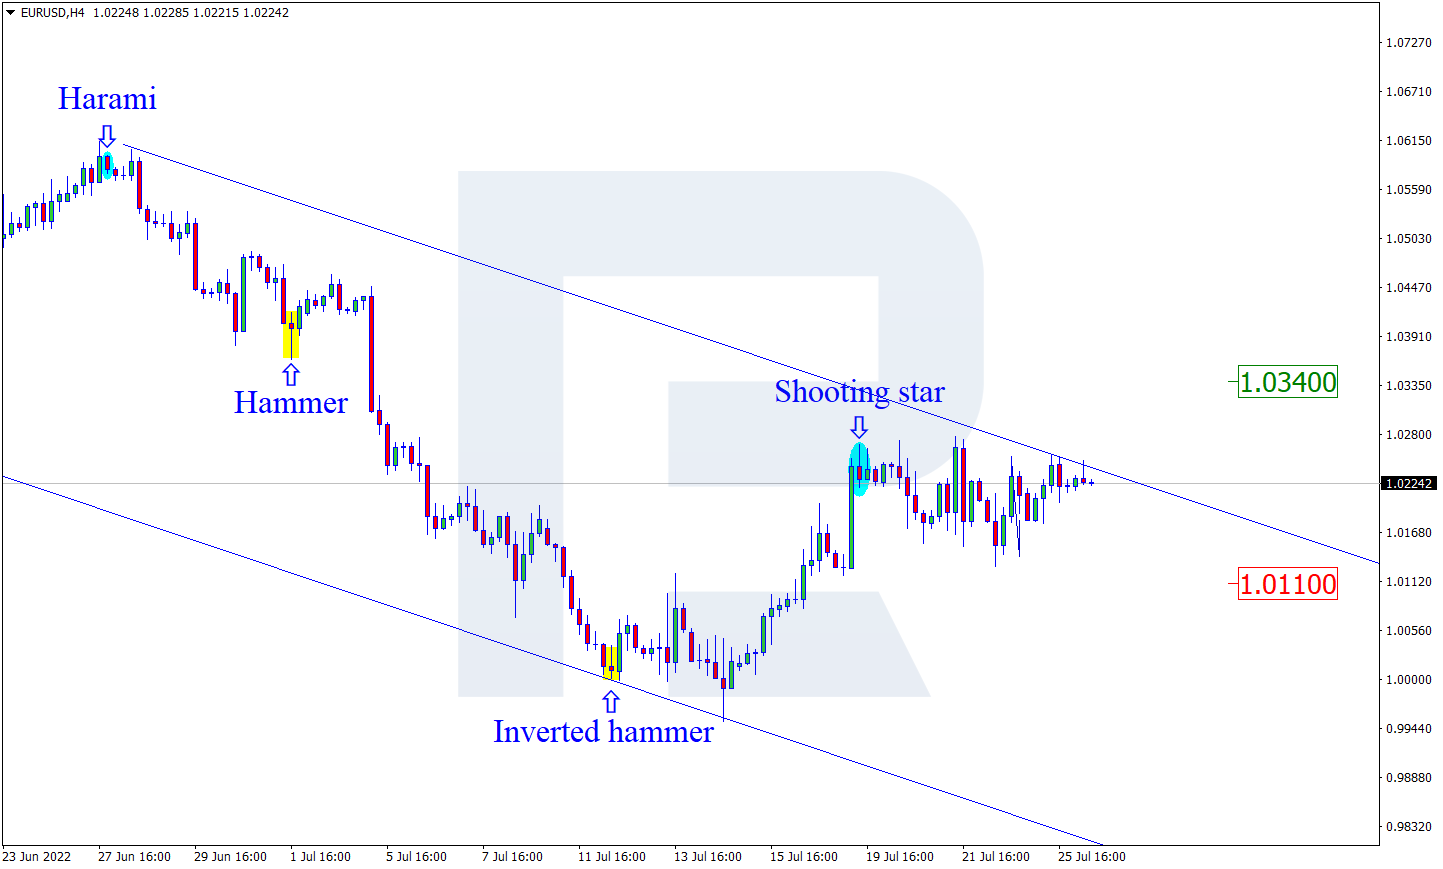
URUSD, “Euro vs US Dollar”
As we can see in the H4 chart, after forming a Shooting Star reversal pattern close to the resistance area, the asset is moving sideways. At the moment, EURUSD may reverse in the form of another descending impulse. In this case, the downside target may be at 1.0110. However, an alternative scenario implies that the price may correct to reach 1.0340 and continue the downtrend only after testing the resistance area.

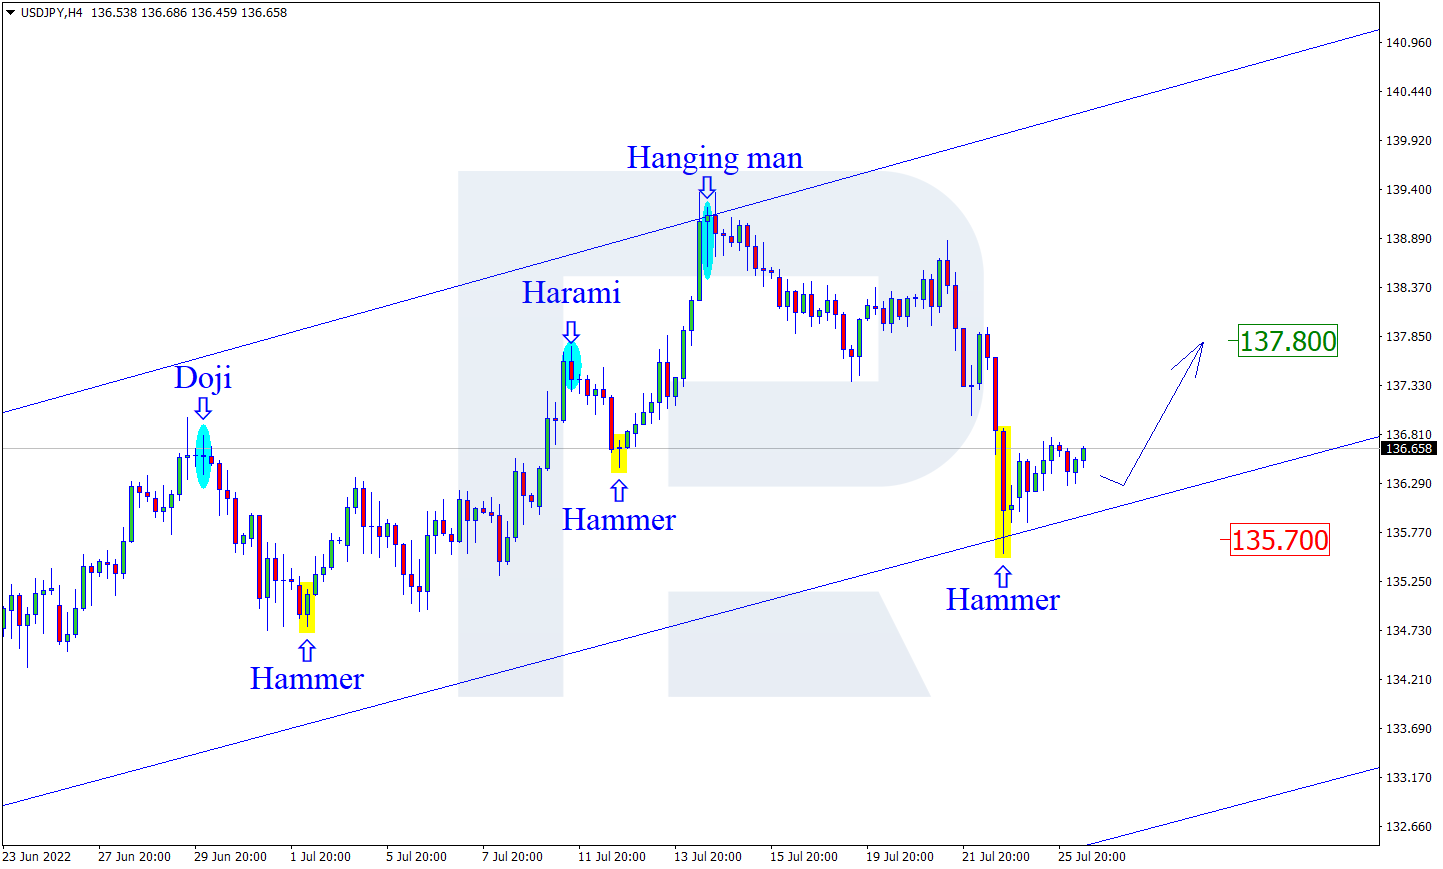
USDJPY, “US Dollar vs Japanese Yen”
As we can see in the H4 chart, USDJPY has formed a Hammer reversal pattern not far from the support area. At the moment, the asset may reverse and form a new ascending impulse. In this case, the upside target may be at 137.80. At the same time, an opposite scenario implies that the price may correct to reach 135.70 and continue the uptrend only after testing the support area.
Free Reports:
 Get our Weekly Commitment of Traders Reports - See where the biggest traders (Hedge Funds and Commercial Hedgers) are positioned in the futures markets on a weekly basis.
 Sign Up for Our Stock Market Newsletter – Get updated on News, Charts & Rankings of Public Companies when you join our Stocks Newsletter
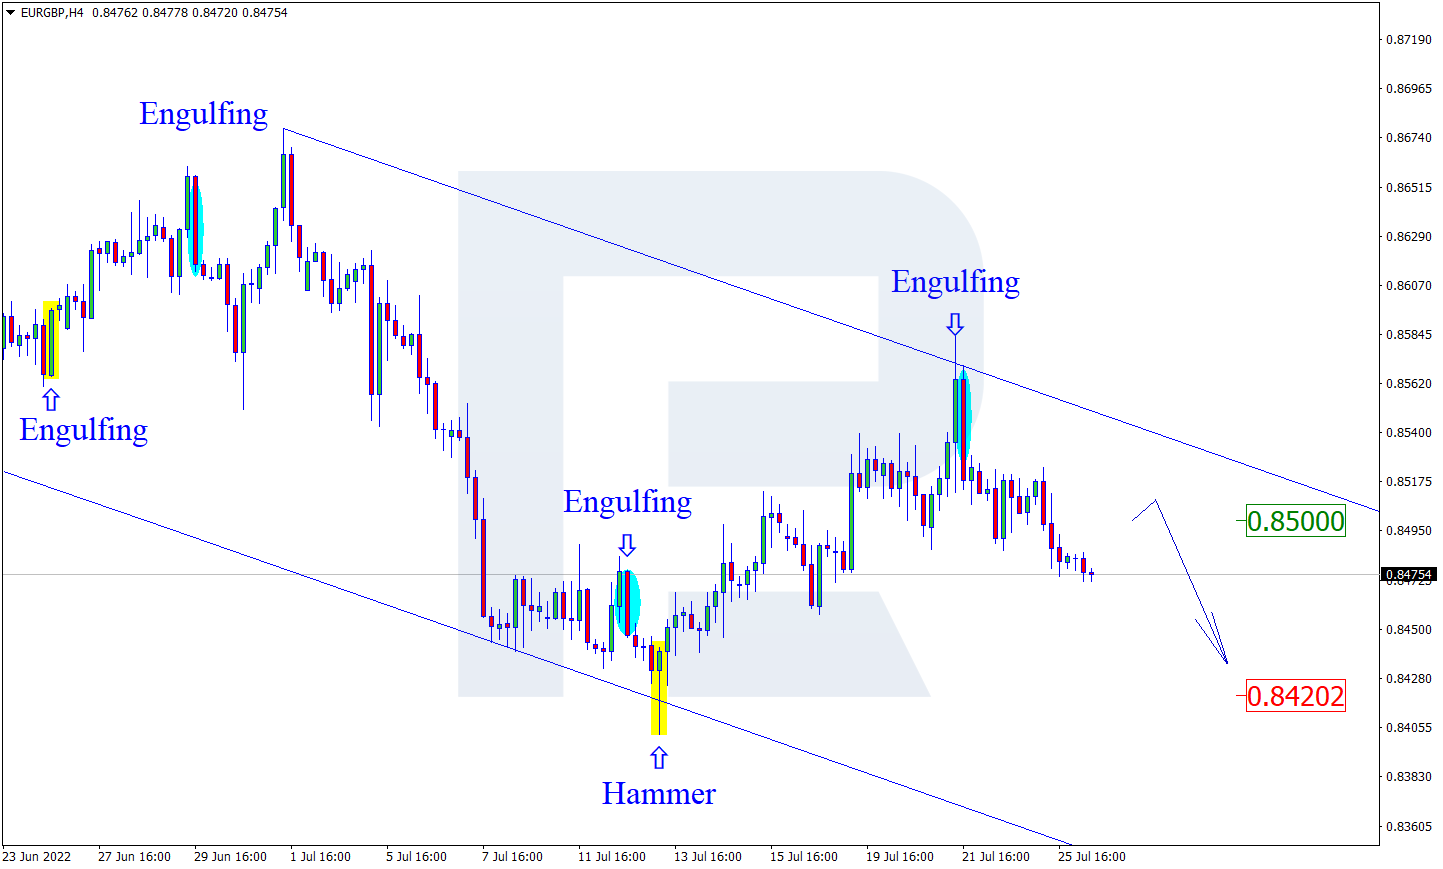
EURGBP, “Euro vs Great Britain Pound”
As we can see in the H4 chart, after forming an Engulfing reversal pattern near the resistance area, EURGBP is reversing in the form of a new descending impulse. In this case, the downside target may be the support level at 0.8420. Later, the market may test this level, break it, and continue moving downwards. Still, there might be an alternative scenario, in which the asset may correct to reach 0.8550 before testing 0.8420.
Article By RoboForex.com
Attention!
Forecasts presented in this section only reflect the author’s private opinion and should not be considered as guidance for trading. RoboForex LP bears no responsibility for trading results based on trading recommendations described in these analytical reviews.

- Gold Declines: Fed Policy and Geopolitics Weigh Jun 30, 2026
- Oil prices have once again risen above 70 dollars per barrel. The Australian dollar has updated a three‑month low Jun 30, 2026
- EUR/USD: The Advantage Remains with the Dollar Jun 29, 2026
- Escalation of the US–Iran conflict is once again supporting the rise in oil prices Jun 29, 2026
- Oil prices fall back to pre‑war levels. Silver drops to a 7‑month low Jun 25, 2026
- Gold Falls to an Eight-Month Low: This May Not Be the Bottom Jun 25, 2026
- Stock indices came under heavy selling pressure amid growing skepticism about AI investments Jun 24, 2026
- The Pound Is Pressured Not by Politics, but by a Strong US Dollar Jun 24, 2026
- Global crude oil prices continued to decline. The AUD/USD exchange rate hit an 11‑week low Jun 23, 2026
- EUR/USD Remains Under Sellers’ Control as the Dollar Stays Strong Jun 23, 2026