
Article By RoboForex.com
USDJPY, “US Dollar vs. Japanese Yen”
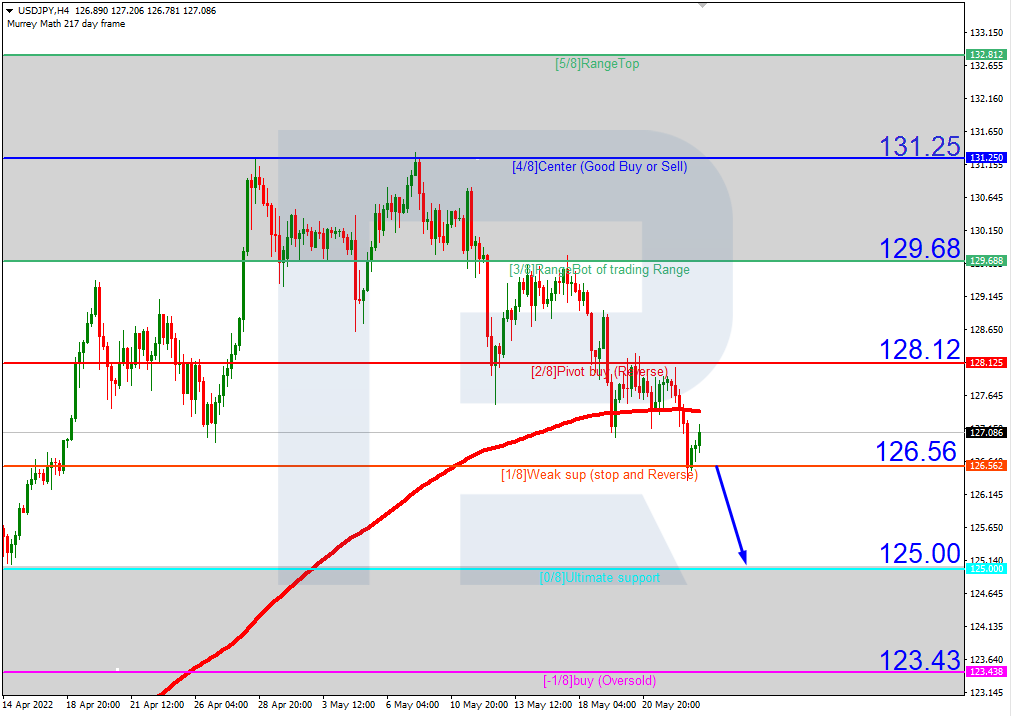
In the H4 chart, after breaking the 200-day Moving Average, USDJPY is trading below it to indicate a possible descending tendency. In this case, the price is expected to break 1/8 and then continue falling to reach the support at 0/8. However, this scenario may no longer be valid if the price breaks the resistance at 2/8 to the upside. After that, the instrument may reverse and move towards 4/8.

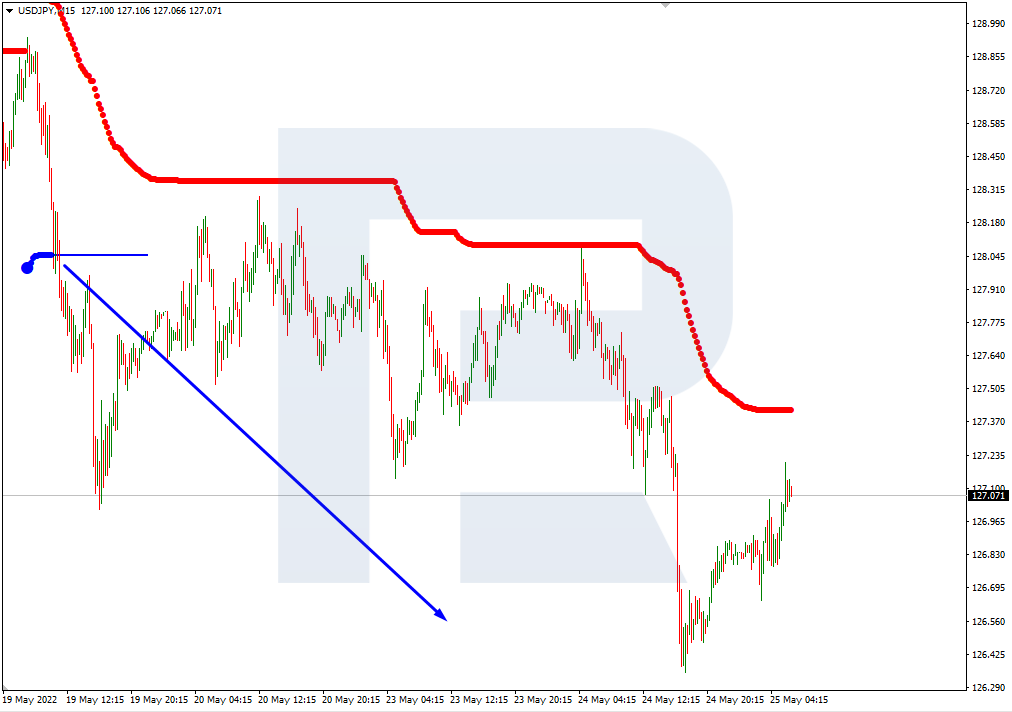
As we can see in the M15 chart, the pair has broken the downside line of the VoltyChannel indicator and, as a result, may continue trading downwards.
Free Reports:
 Download Our Metatrader 4 Indicators – Put Our Free MetaTrader 4 Custom Indicators on your charts when you join our Weekly Newsletter
 Get our Weekly Commitment of Traders Reports - See where the biggest traders (Hedge Funds and Commercial Hedgers) are positioned in the futures markets on a weekly basis.
USDCAD, “US Dollar vs Canadian Dollar”
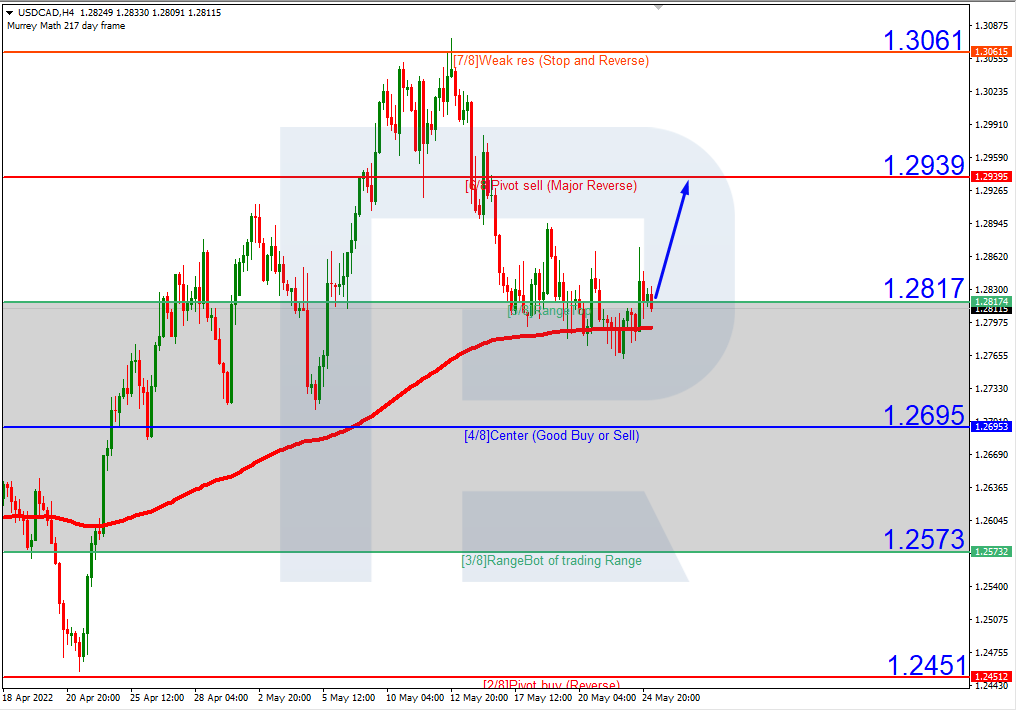
As we can see in the H4 chart, USDCAD is trading above the 200-day Moving Average, thus indicating an ascending tendency. In this case, the price may break 5/8 and then continue growing towards the resistance at 6/8. On the other hand, this scenario may no longer be valid if the pair breaks 4/8 to the downside. After that, the instrument may reverse and move downwards to reach the support at 3/8.
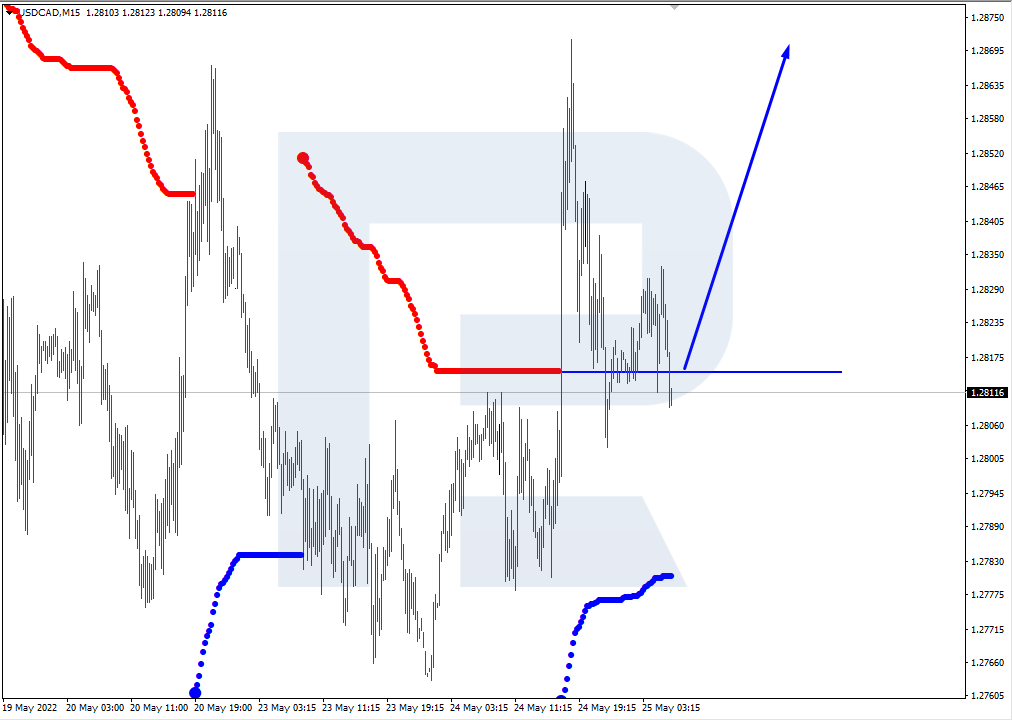
In the M15 chart, the pair may break the upside line of the VoltyChannel indicator and, as a result, continue its growth.
Article By RoboForex.com
Attention!
Forecasts presented in this section only reflect the author’s private opinion and should not be considered as guidance for trading. RoboForex LP bears no responsibility for trading results based on trading recommendations described in these analytical reviews.

- SpaceX IPO: Set for $75 billion liftoff Jun 8, 2026
- On Friday, the American stock market experienced one of the strongest crashes in recent times Jun 8, 2026
- EUR/USD at April Lows: What’s Next for the Pair? Jun 8, 2026
- The ceasefire between Israel and Lebanon has reduced the geopolitical premium Jun 5, 2026
- EUR/USD: All Eyes on Non-Farm Payrolls Jun 5, 2026
- The escalation of the conflict in the Middle East put pressure on US and European stock indices Jun 4, 2026
- Gold Remains Under Pressure, but a Rebound Is Still Possible Jun 4, 2026
- Bitcoin drops below the psychological $70,000 level. The US stock indices hit new record highs Jun 3, 2026
- EUR/USD on Edge as Markets Await Key Employment Data Jun 3, 2026
- Oil prices surged again amid rumors of a freeze in diplomacy between the United States and Iran Jun 2, 2026