
By RoboForex Analytical Department
The major currency pair remains optimistic and intends to continue its recovery. On Monday 23 May, EUR/USD is trading at 1.0590; investors are trying to buy.
After the previous meeting of the US Fed, market concerns about the regulator’s future fiscal moves smoothed a little bit. It’s clear that the Fed will continue raising the benchmark interest rate quite aggressively, but that’s all. This allows to reduce investors’ interest in the “greenback” and helps other traded currencies to correct.
This week is not going to ring a lot of important statistics for EUR/USD. Still, market players should pay attention to reports on the Durable Goods Orders and the Q1 GDP from the US. The ECB Financial Stability Review might also be interesting. Moreover, heads of European and American regulators are scheduled to speak.
As a rule, the last week of the month is not very rich in macroeconomic statistics and allows investors to prepare for the numbers to be published early in the upcoming month.
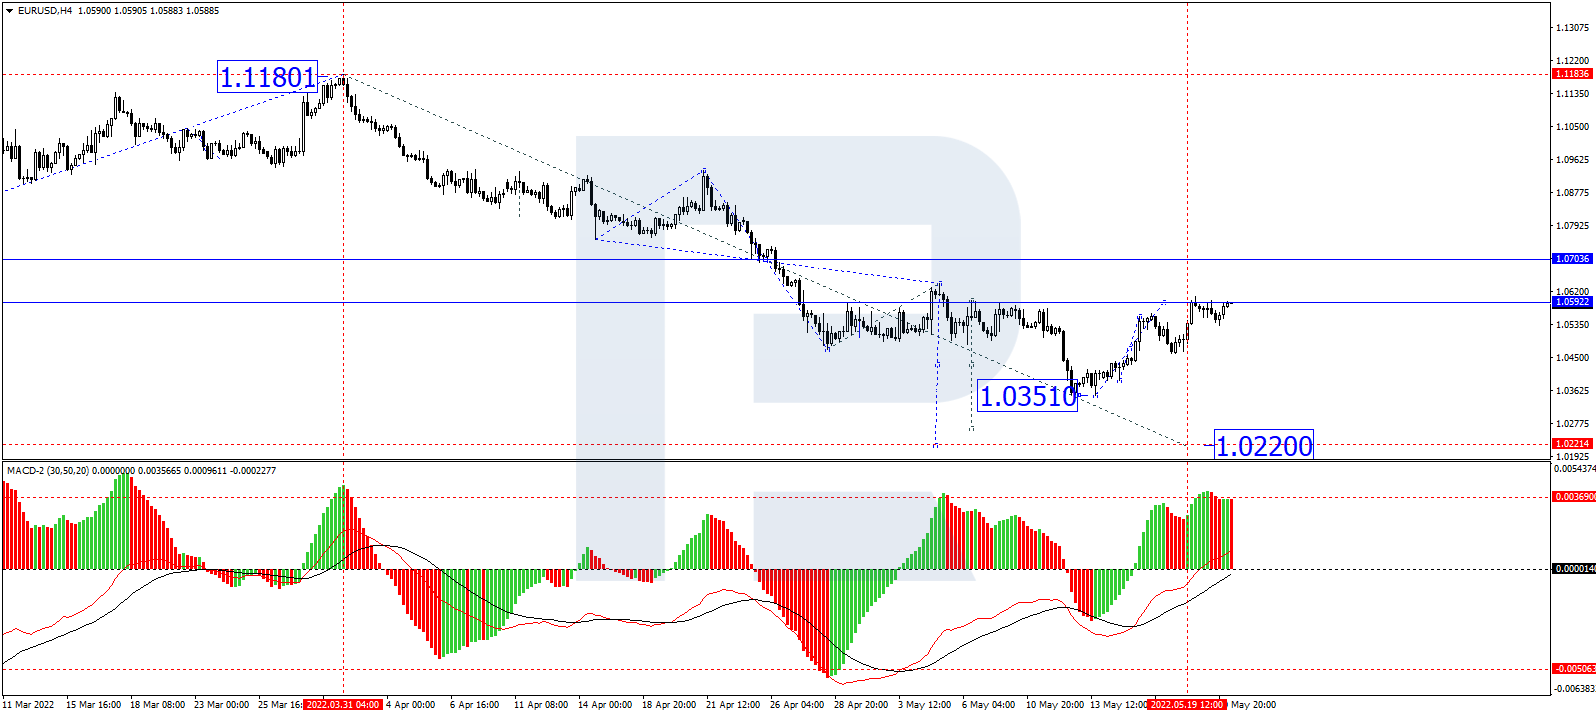
In the H4 chart, after rebounding from 1.0350 and then completing the correction at 1.0590, EUR/USD is expected to consolidate near the highs. Later, the market may break the range to the downside and resume falling with the target at 1.0300. From the technical point of view, this scenario is confirmed by MACD Oscillator: its signal line is moving below 0 and may continue falling to update the lows.
Free Reports:
 Sign Up for Our Stock Market Newsletter – Get updated on News, Charts & Rankings of Public Companies when you join our Stocks Newsletter
 Get our Weekly Commitment of Traders Reports - See where the biggest traders (Hedge Funds and Commercial Hedgers) are positioned in the futures markets on a weekly basis.
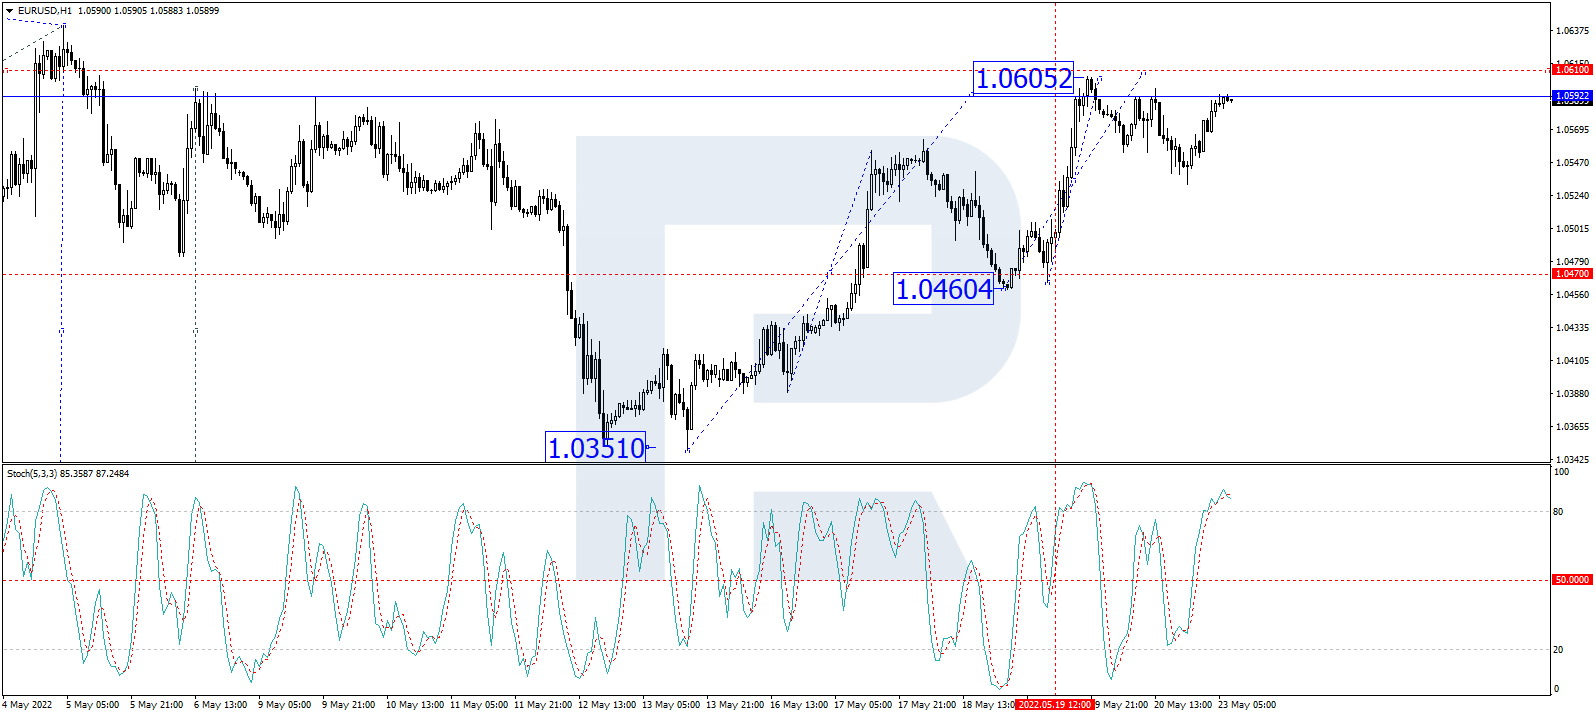
As we can see in the H1 chart, having completed the ascending wave at 1.0600 along with the correction down to 1.0460, EUR/USD is growing towards 1.0610. Later, the market may fall to return to 1.0460 and break it. After that, the instrument may continue trading downwards with the target at 1.0300. From the technical point of view, this idea is confirmed by the Stochastic Oscillator: after reaching 80, its signal line is expected to fall to break 50 and then continue its decline towards 20.
Disclaimer
Any forecasts contained herein are based on the author’s particular opinion. This analysis may not be treated as trading advice. RoboForex bears no responsibility for trading results based on trading recommendations and reviews contained herein.

- EUR/USD: The Advantage Remains with the Dollar Jun 29, 2026
- Escalation of the US–Iran conflict is once again supporting the rise in oil prices Jun 29, 2026
- Oil prices fall back to pre‑war levels. Silver drops to a 7‑month low Jun 25, 2026
- Gold Falls to an Eight-Month Low: This May Not Be the Bottom Jun 25, 2026
- Stock indices came under heavy selling pressure amid growing skepticism about AI investments Jun 24, 2026
- The Pound Is Pressured Not by Politics, but by a Strong US Dollar Jun 24, 2026
- Global crude oil prices continued to decline. The AUD/USD exchange rate hit an 11‑week low Jun 23, 2026
- EUR/USD Remains Under Sellers’ Control as the Dollar Stays Strong Jun 23, 2026
- Gold Falls for the Third Consecutive Week: Is There Still Upside Potential? Jun 22, 2026
- Bank Indonesia raised its interest rate. Norges Bank and the SNB left rates unchanged Jun 19, 2026