
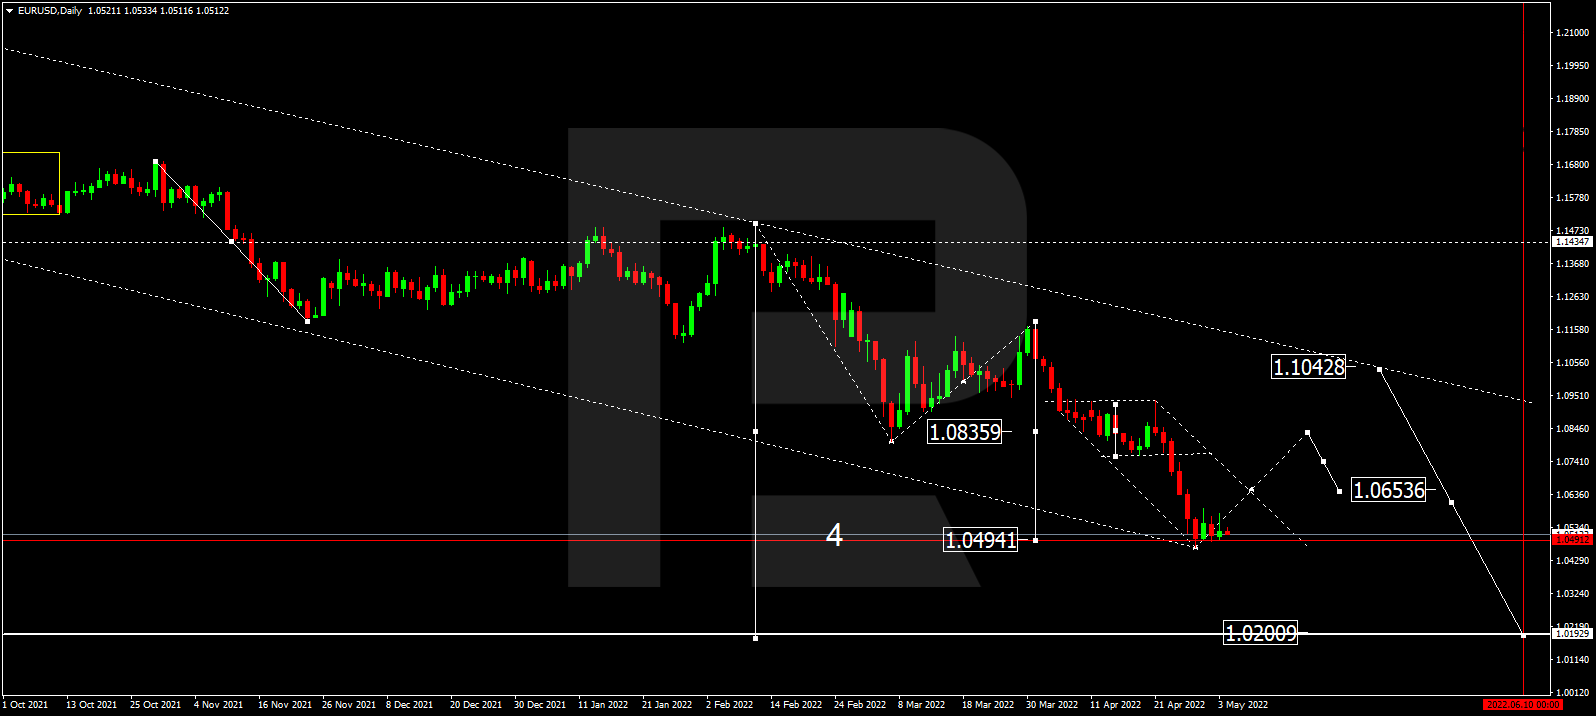
– EURUSD, “Euro vs US Dollar”
As we can see in the daily chart, having completed the correction at 1.1800, rebounded from it to the downside, and then finished another descending wave towards 1.0835, EURUSD has broken the downside border of the consolidation range around the latter level to reach the short-term target at 1.0494. Possibly, the pair may correct to test 1.0830 from below and then form one more descending structure towards 1.0200.

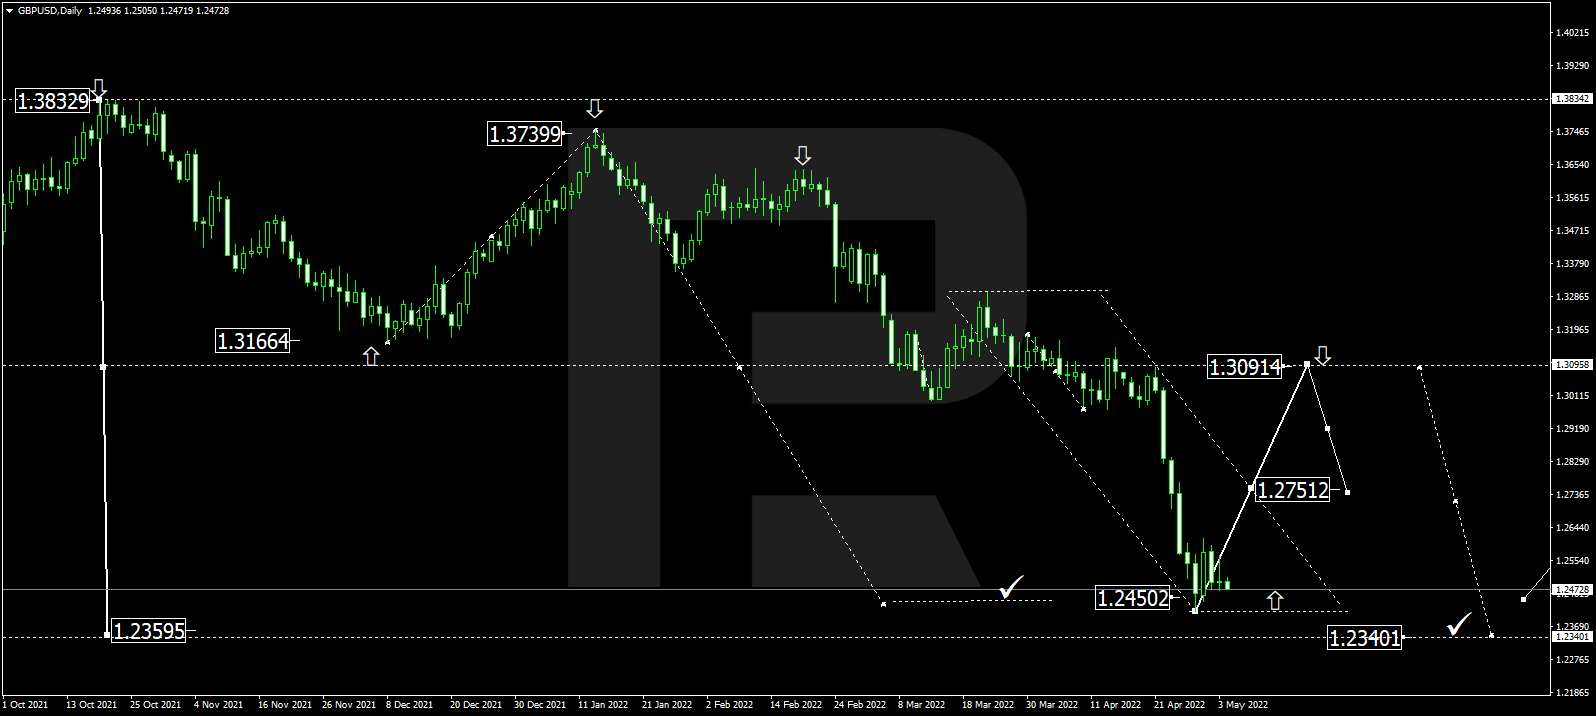
GBPUSD, “Great Britain Pound vs US Dollar”
In the daily chart, after forming a new consolidation range around 1.3090 and breaking it downwards, GBPUSD has reached the short-term downside target at 1.2450. Possibly, the pair may start a new correction to test 1.3000 from below and then resume falling to reach 1.2340.
Free Reports:
 Get our Weekly Commitment of Traders Reports - See where the biggest traders (Hedge Funds and Commercial Hedgers) are positioned in the futures markets on a weekly basis.
 Sign Up for Our Stock Market Newsletter – Get updated on News, Charts & Rankings of Public Companies when you join our Stocks Newsletter
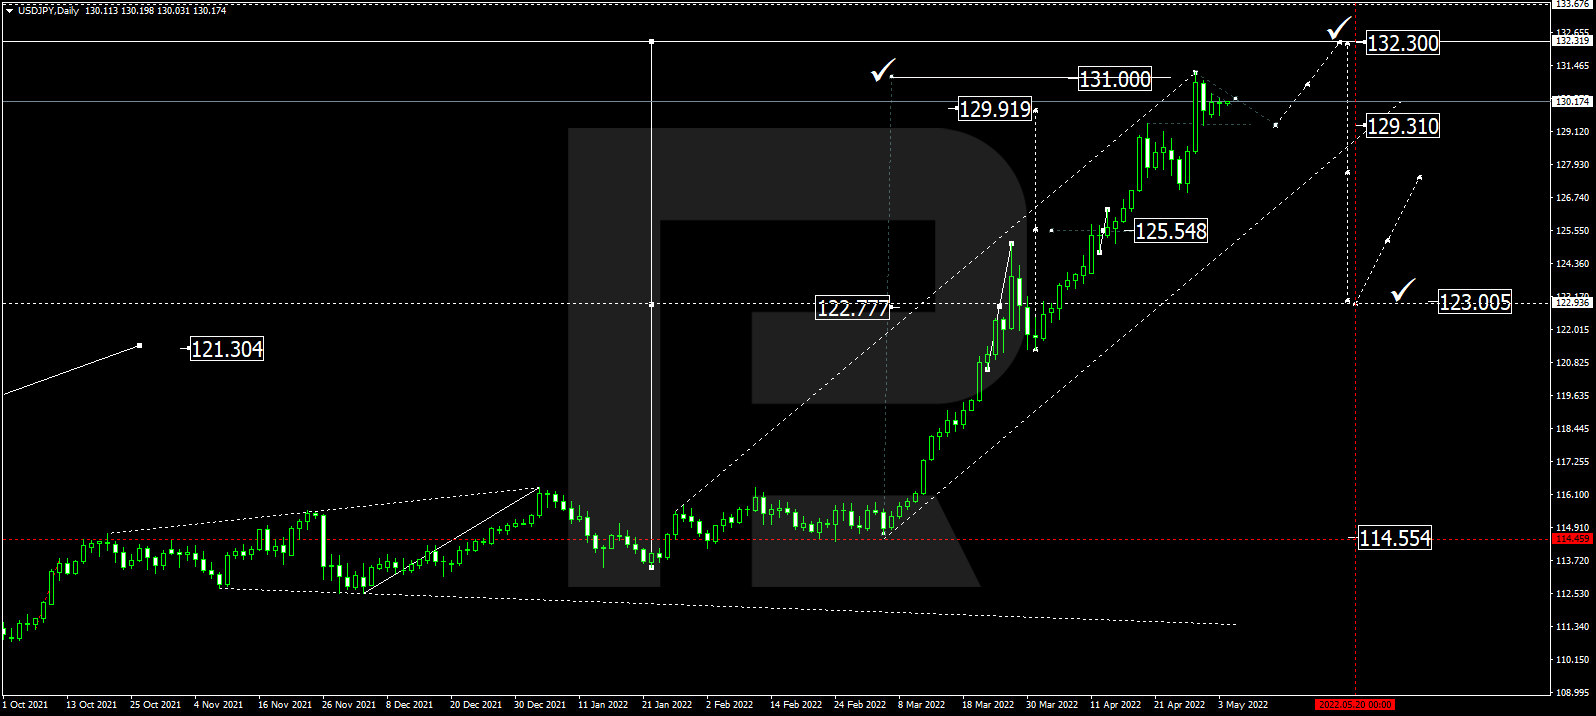
USDJPY, “US Dollar vs Japanese Yen”
In the daily chart, having formed a new consolidation rage around 122.77 and broken it to the upside, USDJPY has reached the short-term target at 131.00. Later, the market may correct to test 129.31 from below and then start a new growth to reach 132.30.
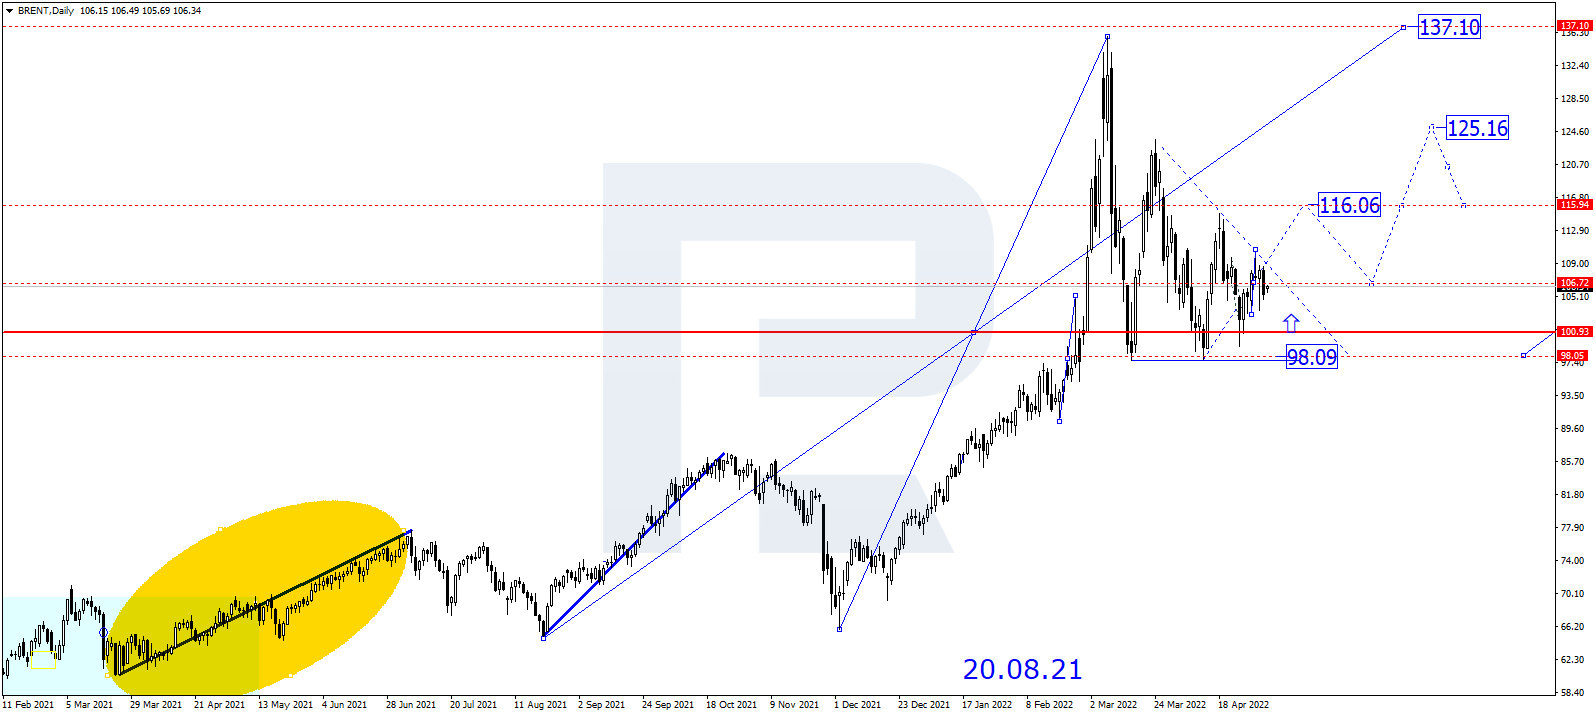
BRENT
As we can see in the daily chart, Brent is consolidating around 106.70. Possibly, the asset may form one more ascending wave towards 116.00 and then start a new correction to return to 106.70. Later, the market may resume trading upwards to reach 125.15 or even extend this structure up to 137.10.
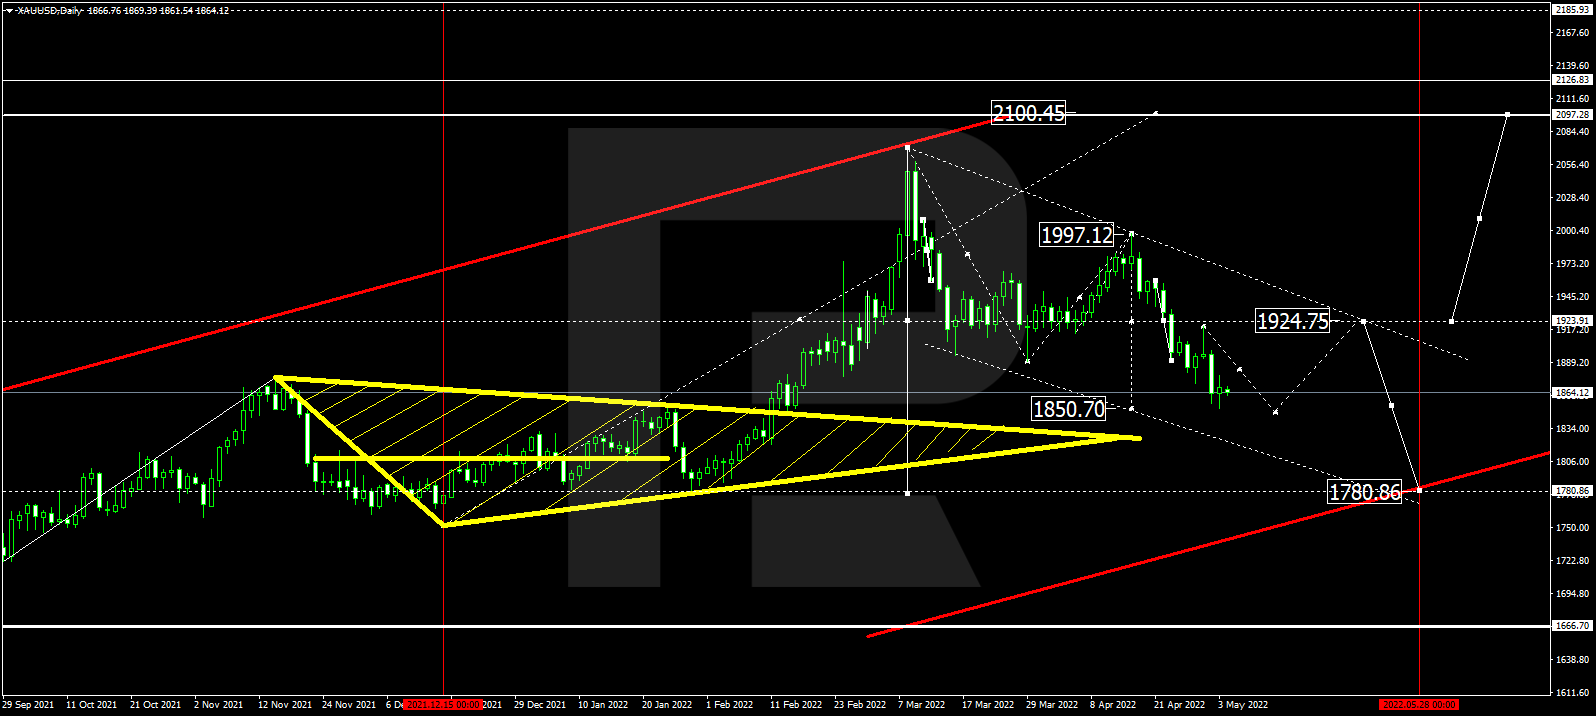
XAUUSD, “Gold vs US Dollar”
In the daily chart, after forming a new consolidation range around 1924.75, Gold has expanded it down to 1850.00 and may later grow to test 1924.75 from below. After that, the instrument may start a new decline towards 1789.80 and then form one more ascending structure with the target at 2100.00.
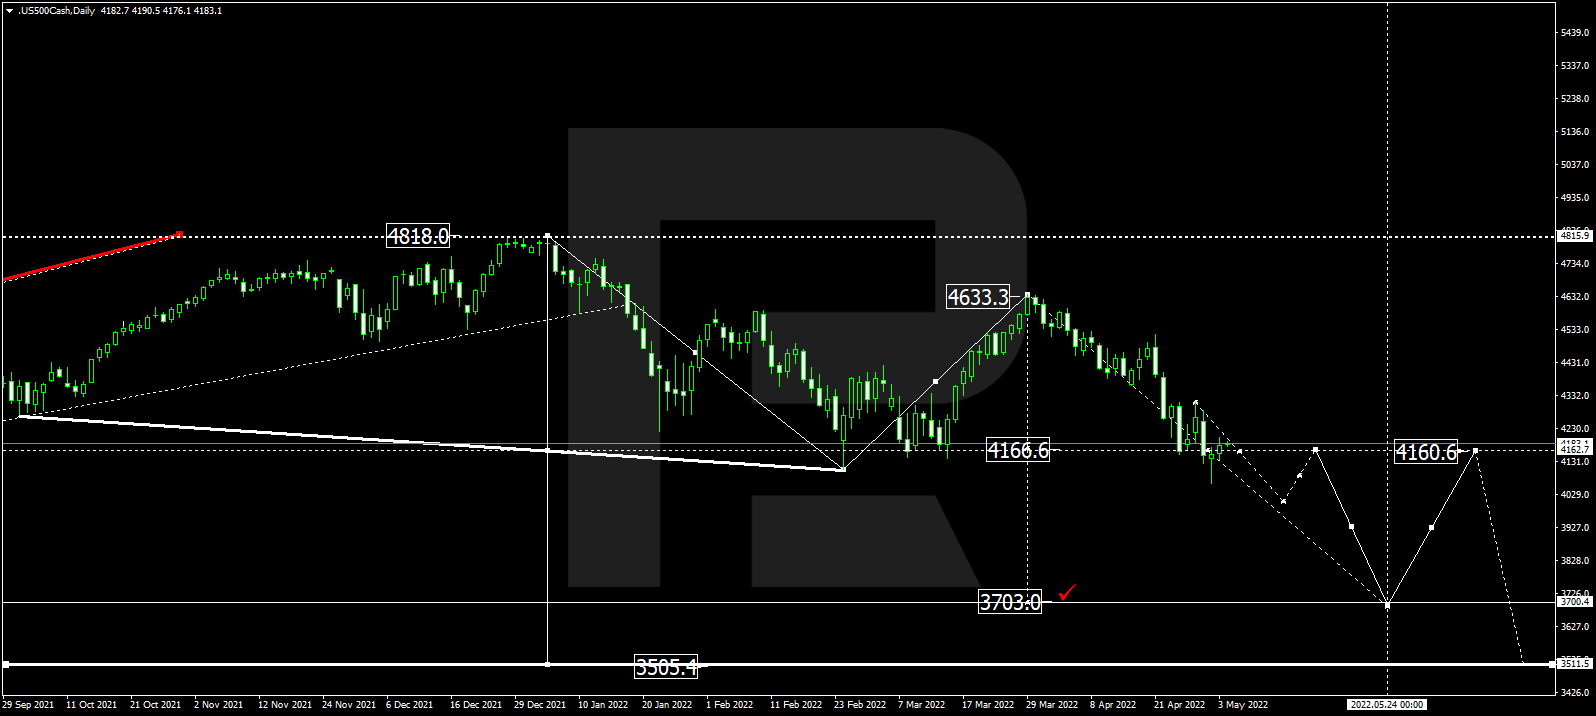
S&P 500
In the daily chart, having rebounded from 4633.3 to the downside, the S&P index has completed the descending structure at 4166.6; right now, it is consolidating around the latter level. Possibly, the asset may break the range to the downside and resume trading downwards with the short-term target at 3700.0.
Article By RoboForex.com
Attention!
Forecasts presented in this section only reflect the author’s private opinion and should not be considered as guidance for trading. RoboForex LP bears no responsibility for trading results based on trading recommendations described in these analytical reviews.

- Oil prices fall back to pre‑war levels. Silver drops to a 7‑month low Jun 25, 2026
- Gold Falls to an Eight-Month Low: This May Not Be the Bottom Jun 25, 2026
- Stock indices came under heavy selling pressure amid growing skepticism about AI investments Jun 24, 2026
- The Pound Is Pressured Not by Politics, but by a Strong US Dollar Jun 24, 2026
- Global crude oil prices continued to decline. The AUD/USD exchange rate hit an 11‑week low Jun 23, 2026
- EUR/USD Remains Under Sellers’ Control as the Dollar Stays Strong Jun 23, 2026
- Gold Falls for the Third Consecutive Week: Is There Still Upside Potential? Jun 22, 2026
- Bank Indonesia raised its interest rate. Norges Bank and the SNB left rates unchanged Jun 19, 2026
- EUR/USD Loses Ground as Market Sentiment Favours the US Dollar Jun 19, 2026
- GBPUSD Awaits Bank of England Meeting Near April Lows Jun 18, 2026