
Article By RoboForex.com
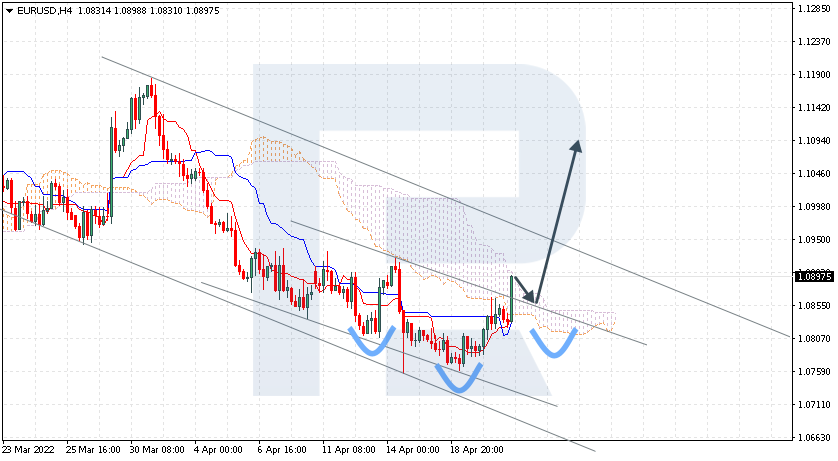
EURUSD, “Euro vs US Dollar”
EURUSD is rebounding from the cloud’s upside border at 1.0897; bears have failed to fix the price below the support area at 1.0805. The instrument is currently moving inside Ichimoku Cloud, thus indicating a sideways tendency. The markets could indicate that the price may test the cloud’s downside border at 1.0855 and then resume moving upwards to reach 1.1095. Another signal in favour of a further uptrend will be a rebound from the descending channel’s upside border. However, the bullish scenario may no longer be valid if the price breaks the cloud’s downside border and fixes below 1.0780. In this case, the pair may continue falling towards 1.0690. Also, there is a potential for the formation of an upside-down Head & Shoulders reversal pattern with the target at 1.1065. While forming the pattern, the asset may fall to test 1.0820 and complete the pattern’s right “shoulder” there.

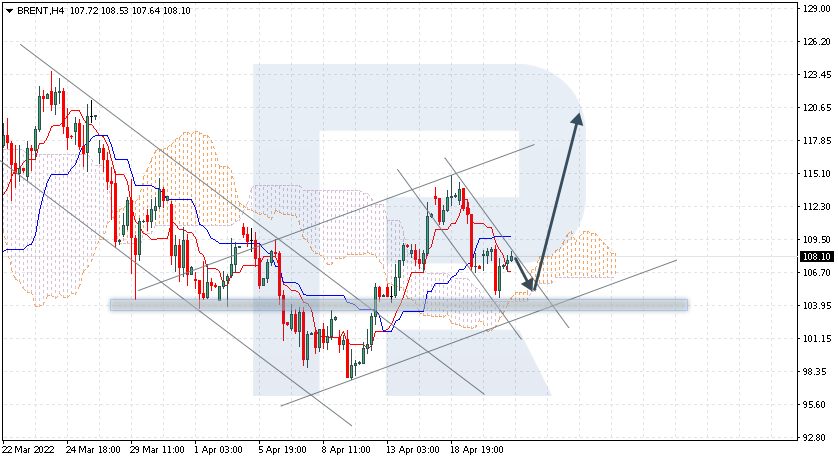
BRENT
Brent is still testing Tenkan-Sen and Kijun-Sen at 108.10. The instrument is currently moving above Ichimoku Cloud, thus indicating an ascending tendency. The markets could indicate that the price may test the cloud’s upside border at 105.45 and then resume moving upwards to reach 120.65. Another signal in favour of a further uptrend will be a rebound from the rising channel’s downside border. However, the bullish scenario may no longer be valid if the price breaks the cloud’s downside border and fixes below 100.00. In this case, the pair may continue falling towards 90.00. To confirm a further uptrend, the price must break the descending channel’s upside border and fix above 109.55.
Free Reports:
 Sign Up for Our Stock Market Newsletter – Get updated on News, Charts & Rankings of Public Companies when you join our Stocks Newsletter
 Get our Weekly Commitment of Traders Reports - See where the biggest traders (Hedge Funds and Commercial Hedgers) are positioned in the futures markets on a weekly basis.
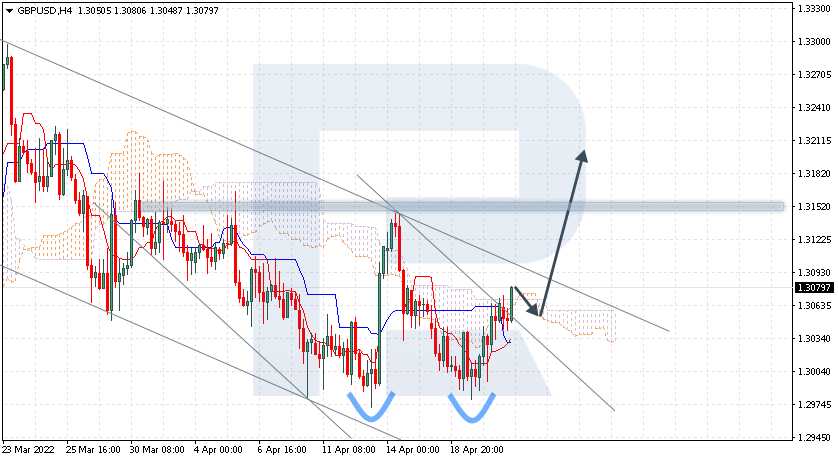
GBPUSD, “Great Britain Pound vs US Dollar”
Having rebounded from the support level, GBPUSD is growing at 1.3079; the daily chart has the potential for the completion of a Double Bottom reversal pattern. To complete the pattern, the price must break 1.3155, and the pattern materialisation target will be at 1.3300. The instrument is currently moving above Ichimoku Cloud, thus indicating an ascending tendency. The markets could indicate that the price may test the cloud’s downside border at 1.3050 and then resume moving upwards to reach 1.3270. Another signal in favour of a further uptrend will be a rebound from the descending channel’s upside border. However, the bullish scenario may no longer be valid if the price breaks the cloud’s downside border and fixes below 1.3005. In this case, the pair may continue falling towards 1.2910. To confirm a further uptrend, the price must break the descending trendline and fix above 1.3115.
Article By RoboForex.com
Attention!
Forecasts presented in this section only reflect the author’s private opinion and should not be considered as guidance for trading. RoboForex LP bears no responsibility for trading results based on trading recommendations described in these analytical reviews.

- Oil prices fall back to pre‑war levels. Silver drops to a 7‑month low Jun 25, 2026
- Gold Falls to an Eight-Month Low: This May Not Be the Bottom Jun 25, 2026
- Stock indices came under heavy selling pressure amid growing skepticism about AI investments Jun 24, 2026
- The Pound Is Pressured Not by Politics, but by a Strong US Dollar Jun 24, 2026
- Global crude oil prices continued to decline. The AUD/USD exchange rate hit an 11‑week low Jun 23, 2026
- EUR/USD Remains Under Sellers’ Control as the Dollar Stays Strong Jun 23, 2026
- Gold Falls for the Third Consecutive Week: Is There Still Upside Potential? Jun 22, 2026
- Bank Indonesia raised its interest rate. Norges Bank and the SNB left rates unchanged Jun 19, 2026
- EUR/USD Loses Ground as Market Sentiment Favours the US Dollar Jun 19, 2026
- GBPUSD Awaits Bank of England Meeting Near April Lows Jun 18, 2026