
By RoboForex Analytical Department
On Monday 11 April, EUR/USD remains weak; the asset is currently trading at 1.0892.
The Monetary Policy Meeting Accounts published by the European Central Bank last week said most policymakers believed that the regulator should take immediate measures aimed at helping the monetary policy reach stability. Such a stance is based on high inflation, which may preserve in the future. However, there is no consensus here, the monetary committee has the right to choose.
Still, this line is rather soft and couldn’t support the EUR, while the “greenback” got much stronger after the US Fed announced the rate hikes in the nearest future. American policymakers say that the rate might reach 3.5% by the end of the year to take control over inflation. By the end of 2022, the бmonetary policy should reach a neutral level.
Investors are also keeping a close eye on the presidential elections in France. The Euro is rather unlikely to be very sensitive to the voting results but some part of politics-related risks might be included in prices.
Free Reports:
 Get our Weekly Commitment of Traders Reports - See where the biggest traders (Hedge Funds and Commercial Hedgers) are positioned in the futures markets on a weekly basis.
 Download Our Metatrader 4 Indicators – Put Our Free MetaTrader 4 Custom Indicators on your charts when you join our Weekly Newsletter
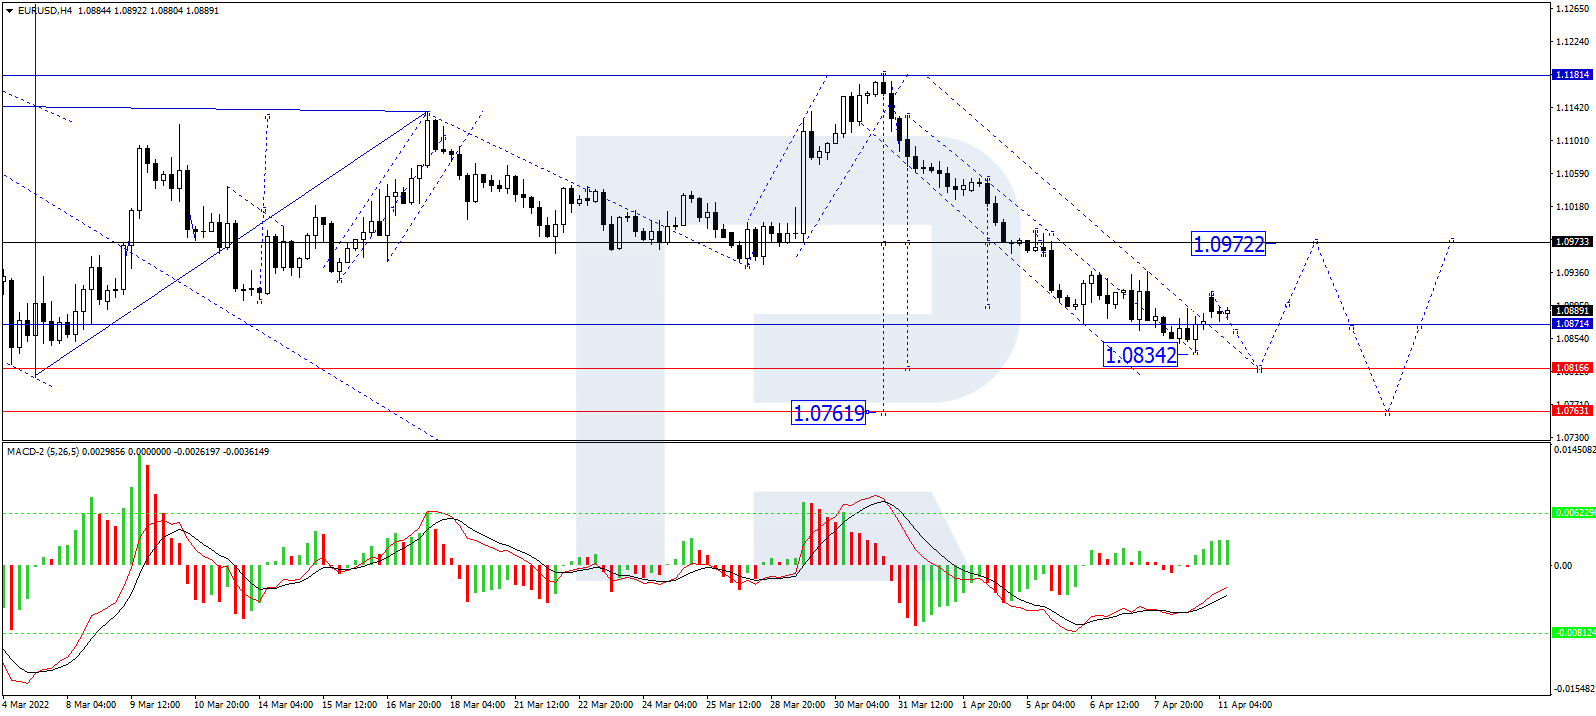
In the H4 chart, having rebounded from 1.0973, EUR/USD continues falling towards 1.0816. Later, the market may correct to test 1.0973 from below and then form one more descending wave with the target at 1.0763. From the technical point of view, this scenario is confirmed by MACD Oscillator: its signal line is growing to reach 0 and may soon rebound from this level to start a new decline and update the lows.
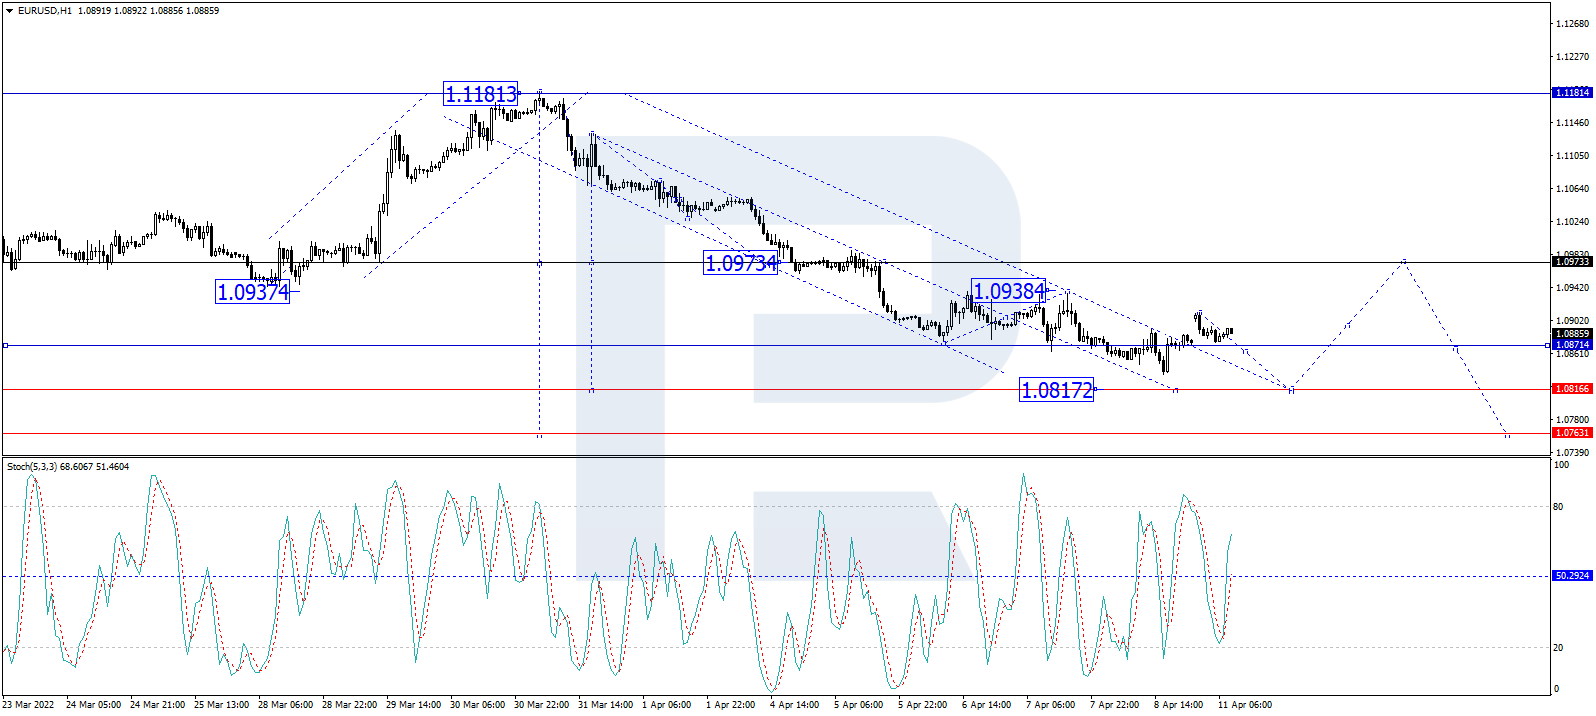
As we can see in the H1 chart, after completing the correction at 1.0910, EUR/USD is expected to resume falling towards 1.0816 and then start a new correction to reach 1.0973. After that, the instrument may resume trading downwards with the target at 1.0763. From the technical point of view, this idea is confirmed by the Stochastic Oscillator: after breaking 50 to the downside, its signal line may continue moving to reach 20. Later, the line may rebound from 20 and start a new growth towards 80.
Disclaimer
Any forecasts contained herein are based on the author’s particular opinion. This analysis may not be treated as trading advice. RoboForex bears no responsibility for trading results based on trading recommendations and reviews contained herein.

- Oil prices fall back to pre‑war levels. Silver drops to a 7‑month low Jun 25, 2026
- Gold Falls to an Eight-Month Low: This May Not Be the Bottom Jun 25, 2026
- Stock indices came under heavy selling pressure amid growing skepticism about AI investments Jun 24, 2026
- The Pound Is Pressured Not by Politics, but by a Strong US Dollar Jun 24, 2026
- Global crude oil prices continued to decline. The AUD/USD exchange rate hit an 11‑week low Jun 23, 2026
- EUR/USD Remains Under Sellers’ Control as the Dollar Stays Strong Jun 23, 2026
- Gold Falls for the Third Consecutive Week: Is There Still Upside Potential? Jun 22, 2026
- Bank Indonesia raised its interest rate. Norges Bank and the SNB left rates unchanged Jun 19, 2026
- EUR/USD Loses Ground as Market Sentiment Favours the US Dollar Jun 19, 2026
- GBPUSD Awaits Bank of England Meeting Near April Lows Jun 18, 2026