
By Dmitriy Gurkovskiy, Chief Analyst at RoboForex
The major currency pair is consolidating around 1.1360 at the beginning of the week. Global markets are a bit calmer today than usual – the US is celebrating Presidents’ Day.
At the same time, there is a local demand for the “greenback” at times of geopolitical escalations. Investors use the American currency as a “safe haven” asset.
Later this week, there will be some interesting macroeconomic reports, for example, the US GDP for the fourth quarter of 2021, and also the data on durable goods orders and personal spending/income.
In addition to that, financial markets remain very sensitive to any comments that come from politicians.
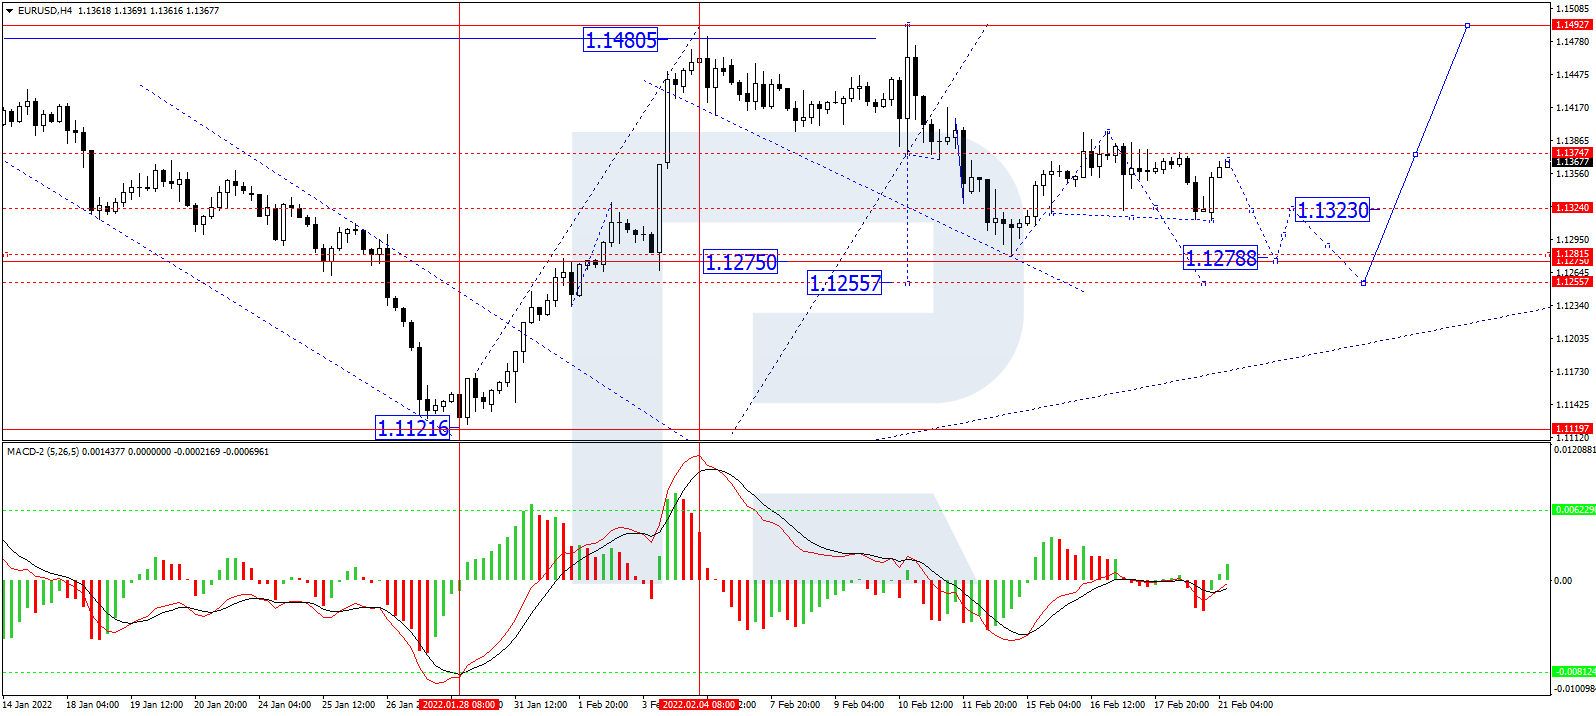
In the H4 chart, having finished another descending wave at 1.1313 along with the correction towards 1.1360, EUR/USD is consolidating below the latter level. If later the price breaks this range to the upside, the market may start another growth towards 1.1404 and then resume falling to break 1.1330. After that, the instrument may continue trading downwards to reach 1.1255 and then form one more ascending wave with the target at 1.1500. From the technical point of view, this scenario is confirmed by MACD Oscillator: its signal line is growing to break 0 and then continue moving towards new highs.
Free Reports:
 Sign Up for Our Stock Market Newsletter – Get updated on News, Charts & Rankings of Public Companies when you join our Stocks Newsletter
 Get our Weekly Commitment of Traders Reports - See where the biggest traders (Hedge Funds and Commercial Hedgers) are positioned in the futures markets on a weekly basis.
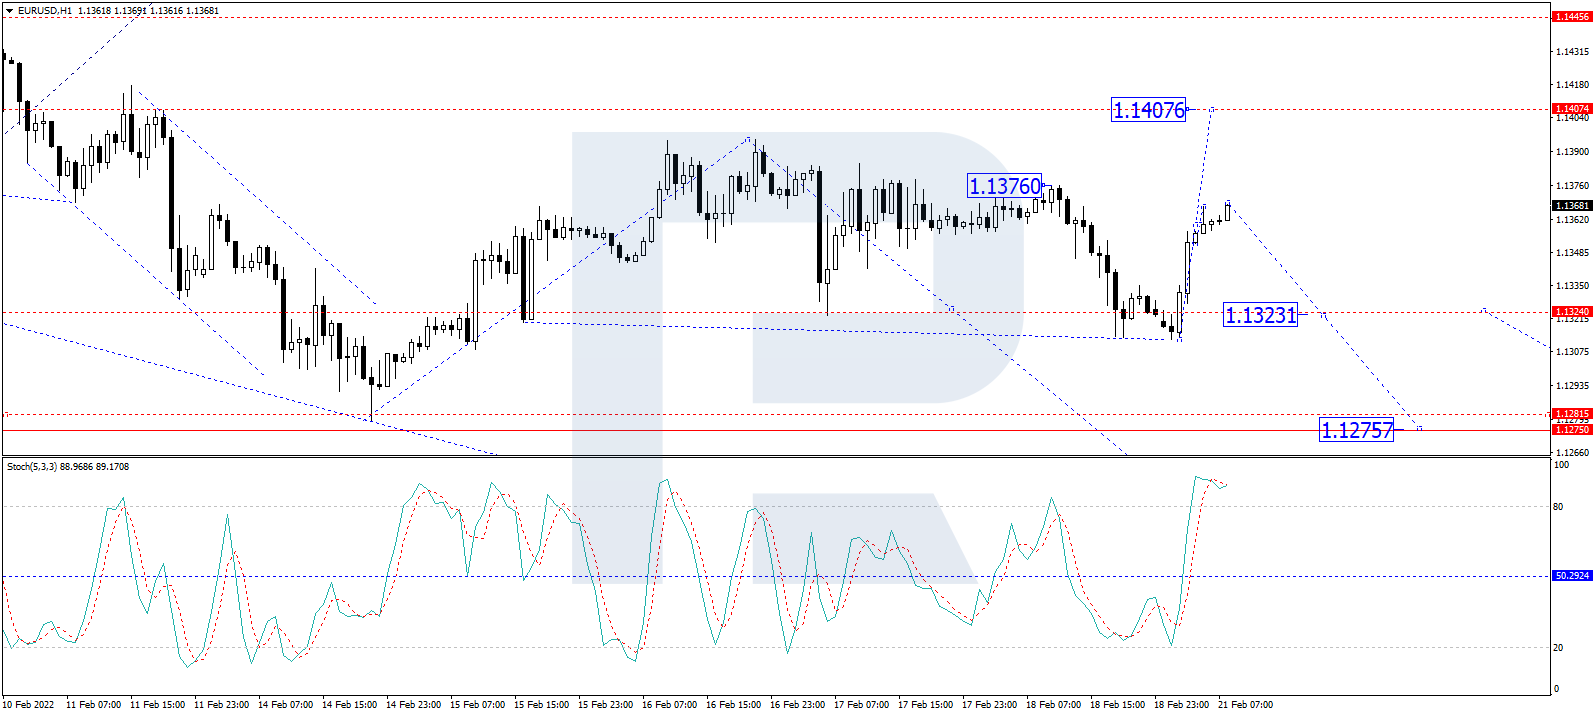
As we can see in the H1 chart, after rebounding from 1.1313, EUR/USD is forming a new ascending impulse and may soon reach 1.1360. After that, the asset is expected to consolidate around the latter level and break the range upwards to reach 1.1390. Later, the market may resume falling to return to 1.1360 and then start another growth towards 1.1404. In the future, the instrument may form a new descending wave with the target at 1.1330. From the technical point of view, this idea is confirmed by the Stochastic Oscillator: its signal line is moving above 80 and may resume falling to reach 50. Later, the line may rebound from 50 and start a new growth to return to 80.
Disclaimer
Any forecasts contained herein are based on the author’s particular opinion. This analysis may not be treated as trading advice. RoboForex bears no responsibility for trading results based on trading recommendations and reviews contained herein.

- Oil prices have fallen to pre‑war levels. AI companies continue to sell off Jul 3, 2026
- Gold Rises Sharply as Markets Reassess Fed Rate Outlook Jul 3, 2026
- The Eurozone has shown a significant slowdown in inflation. Australia has recorded its largest trade deficit since 2015 Jul 2, 2026
- Natural gas prices are rising amid increasing electricity consumption Jul 1, 2026
- USD/JPY at 40-Year High: Multiple Factors Weigh on the Yen Jul 1, 2026
- Gold Declines: Fed Policy and Geopolitics Weigh Jun 30, 2026
- Oil prices have once again risen above 70 dollars per barrel. The Australian dollar has updated a three‑month low Jun 30, 2026
- EUR/USD: The Advantage Remains with the Dollar Jun 29, 2026
- Escalation of the US–Iran conflict is once again supporting the rise in oil prices Jun 29, 2026
- Oil prices fall back to pre‑war levels. Silver drops to a 7‑month low Jun 25, 2026