
Article By RoboForex.com
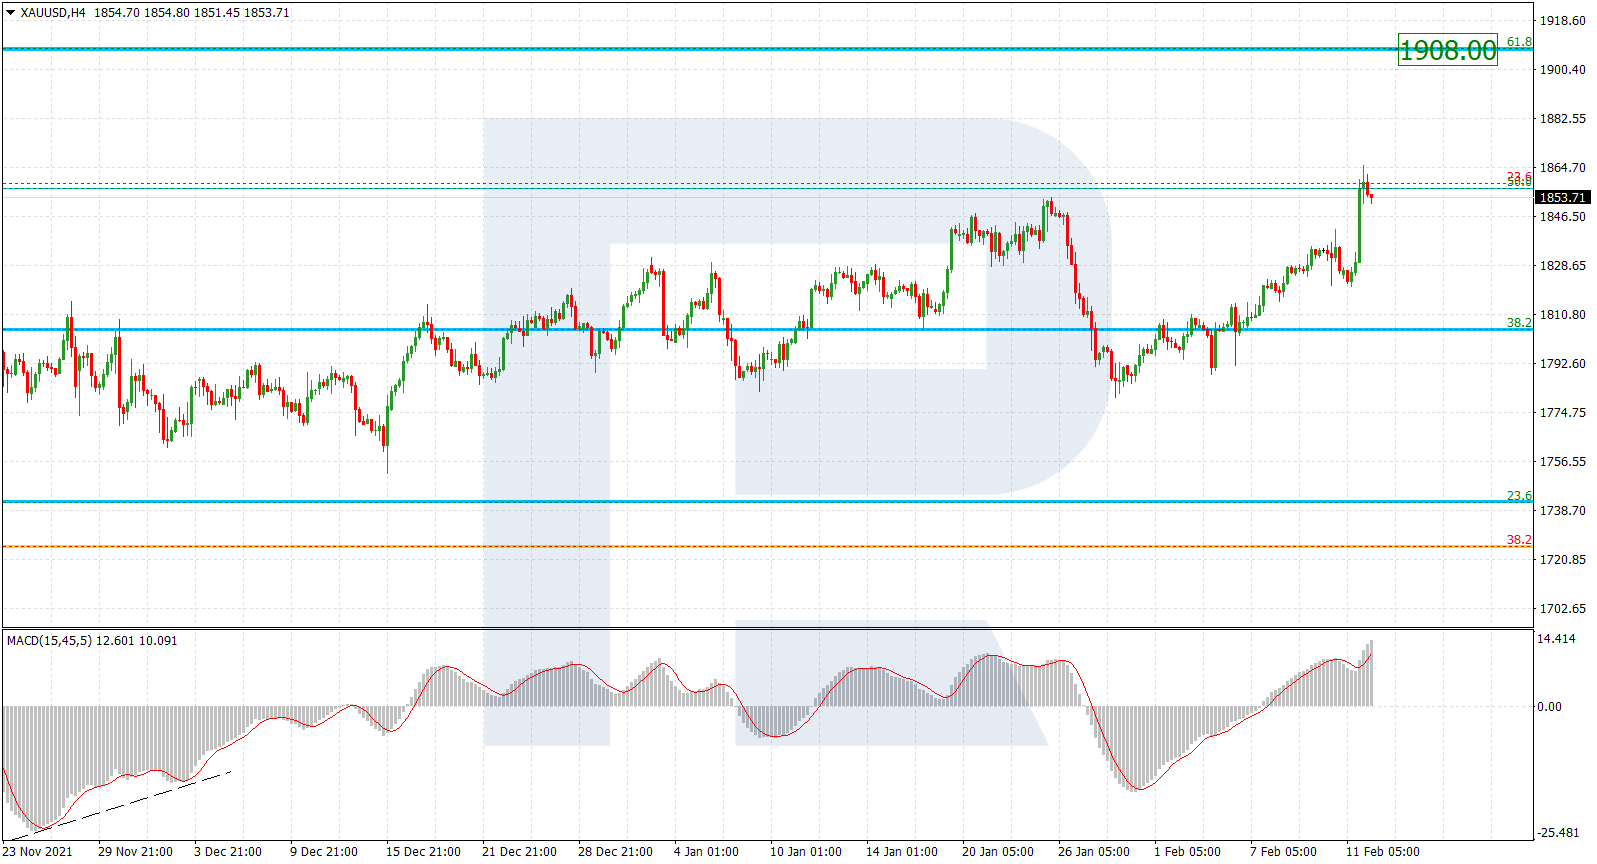
XAUUSD, “Gold vs US Dollar”
As we can see in the H4 chart, after breaking the previous high, the asset continues trading upwards. In the future, the pair may reach and break the long-term 61.8% fibo at 1908.00. At the moment, XAUUSD is testing 50.0% fibo.

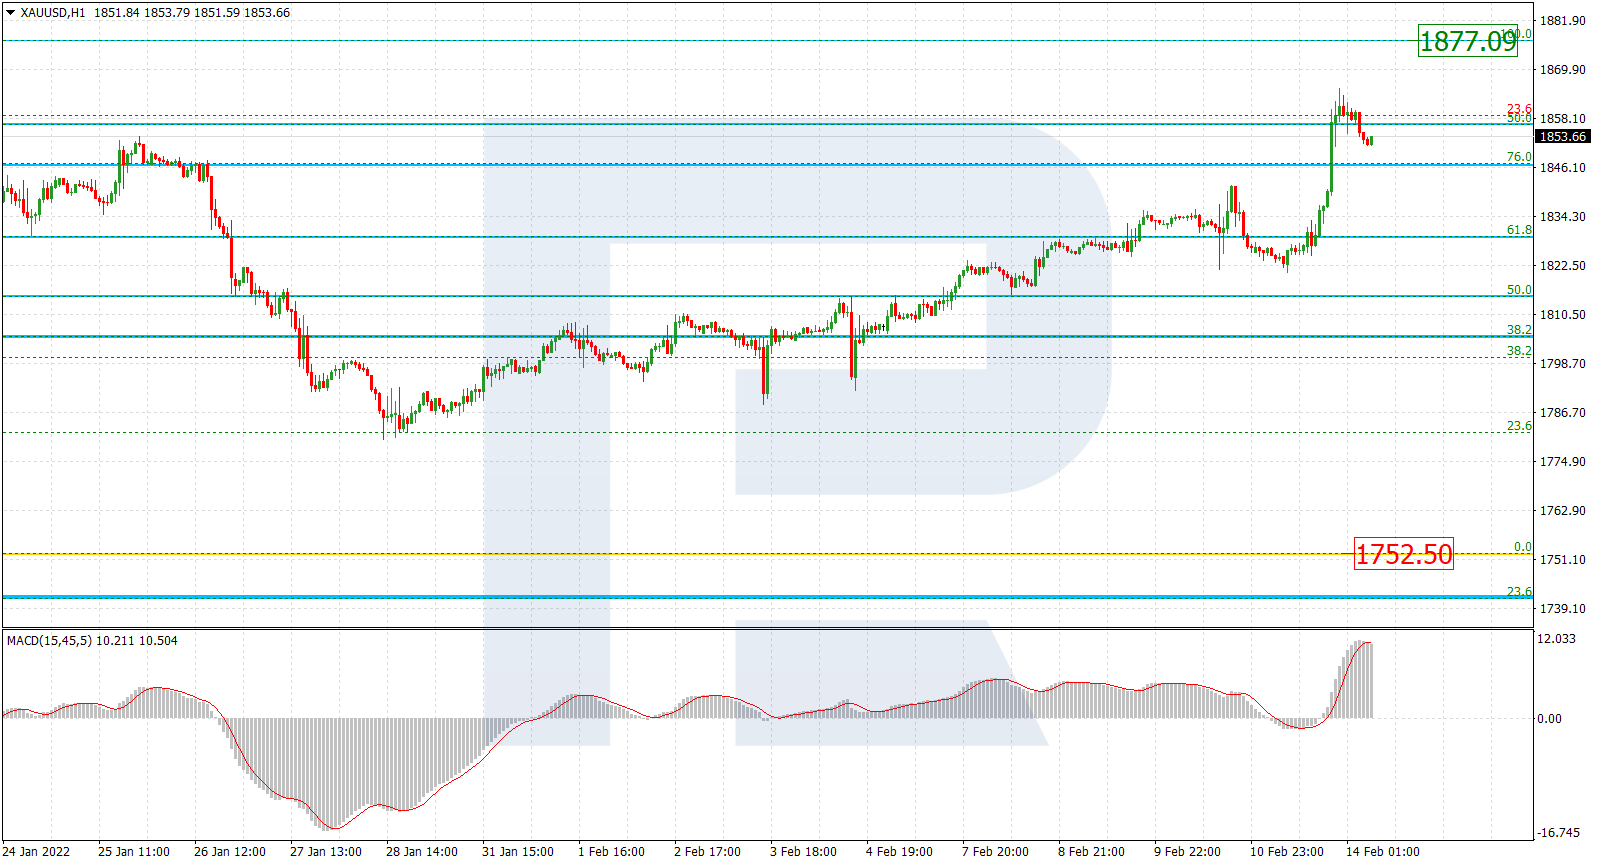
The H1 chart shows that after finishing the mid-term correction, the pair is moving to the upside; it has already broken 61.8% fibo and is now approaching the local high at 1877.09. The support is the low at 1752.50.
Free Reports:
 Get our Weekly Commitment of Traders Reports - See where the biggest traders (Hedge Funds and Commercial Hedgers) are positioned in the futures markets on a weekly basis.
 Download Our Metatrader 4 Indicators – Put Our Free MetaTrader 4 Custom Indicators on your charts when you join our Weekly Newsletter
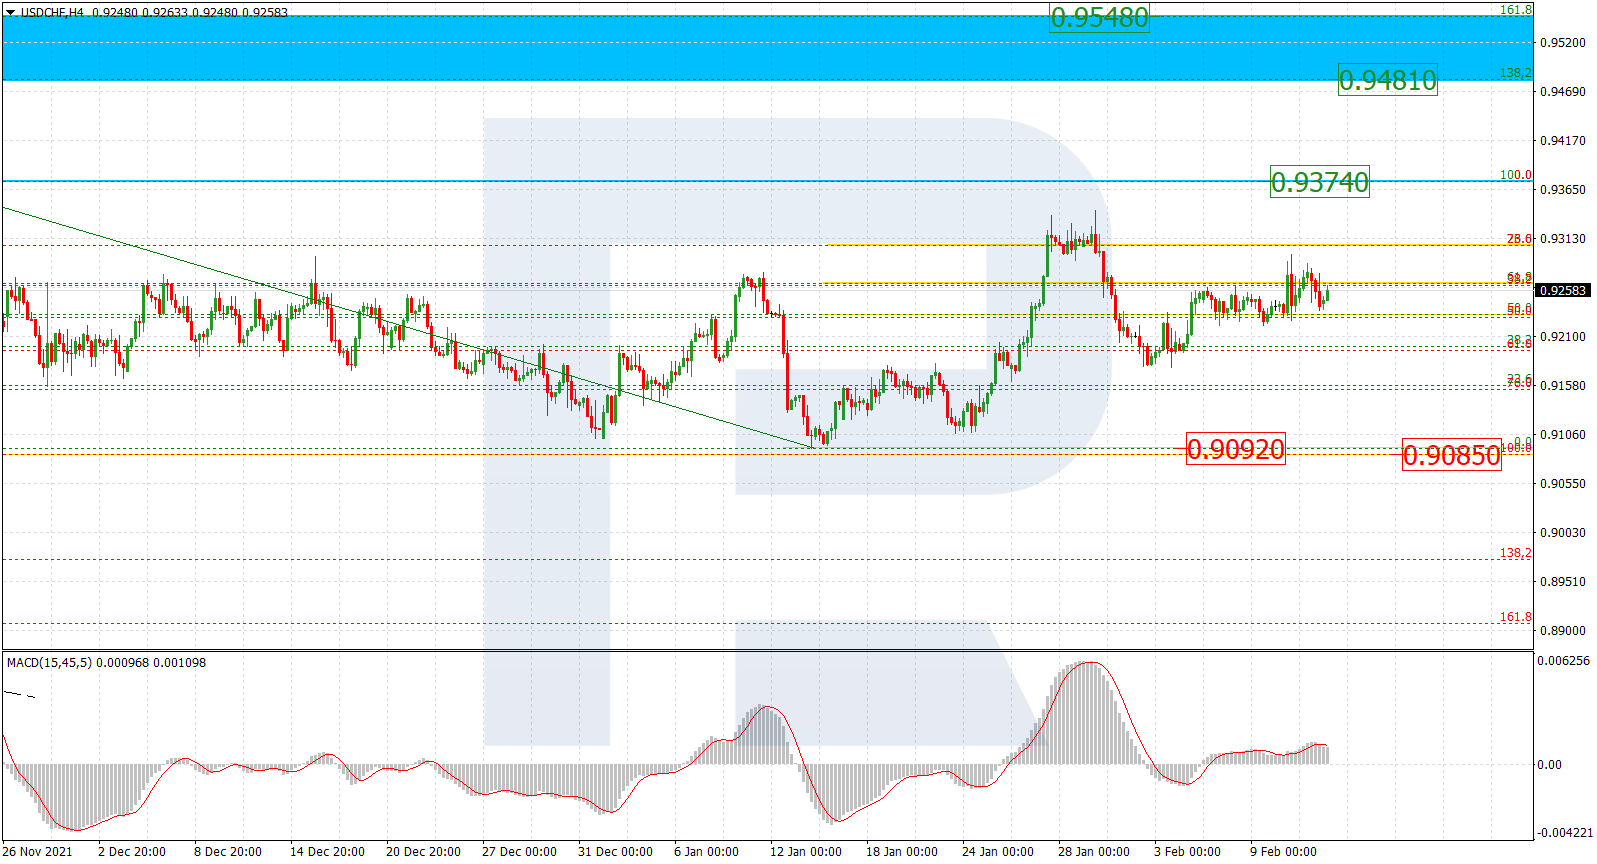
USDCHF, “US Dollar vs Swiss Franc”
As we can see in the H4 chart, USDCHF is consolidating between 50.0% and 76.0% fibo. The current technical picture implies a further uptrend, the key upside target is the high at 0.93745. If the price breaks it, the instrument may continue growing towards the post-correctional extension area between 138.2% and 161.8% fibo at 0.9482 and 0.9548 respectively. The support is at 0.9092.
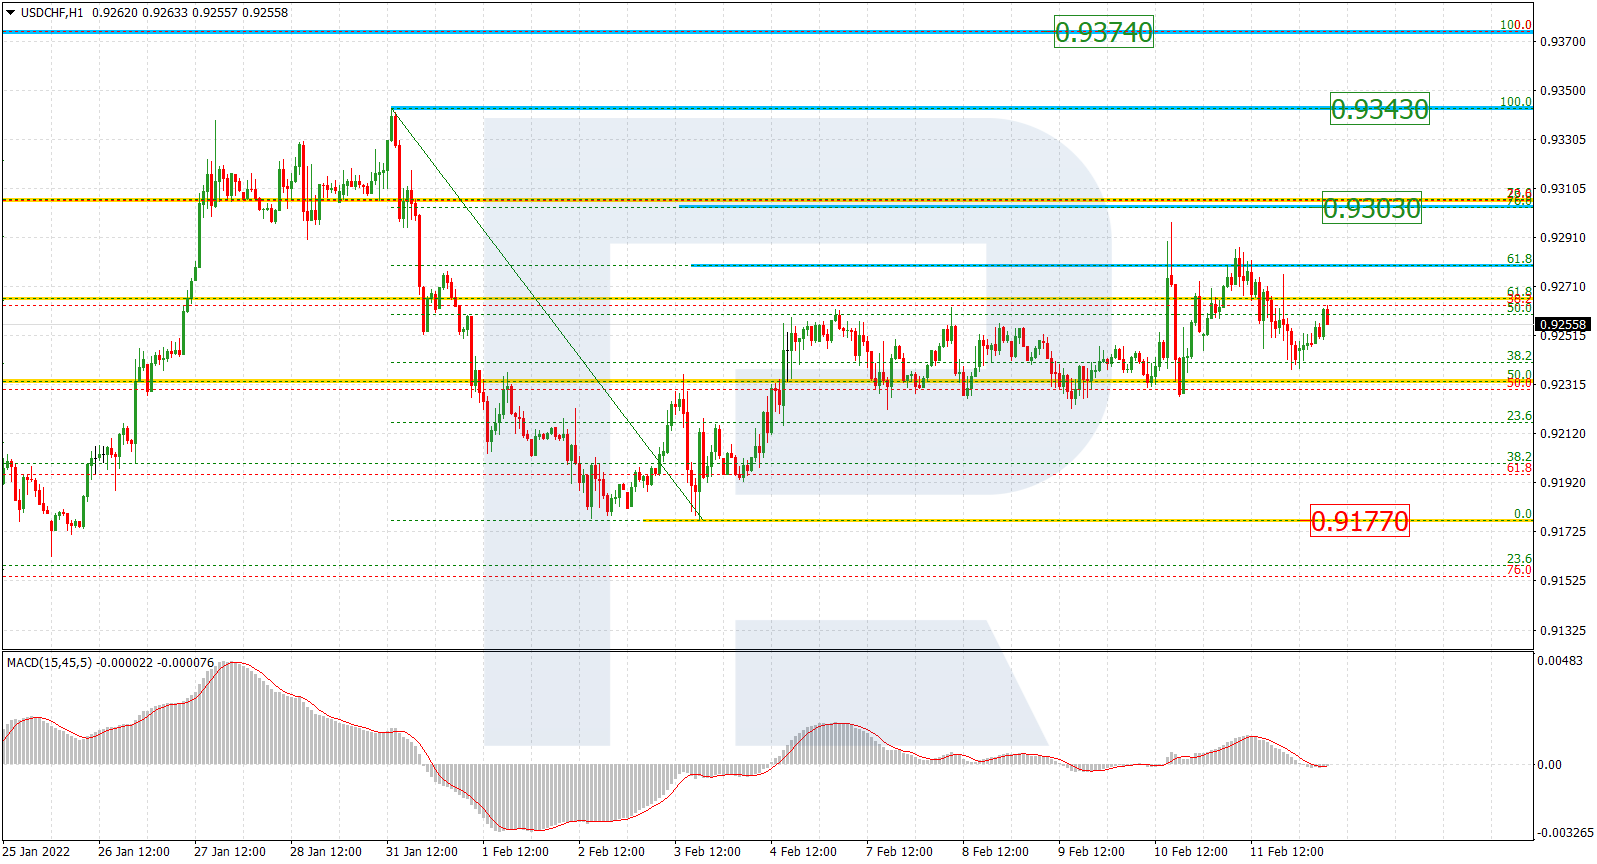
In the H1 chart, the pair is correcting upwards; it has already tested 61.8% fibo twice and may later continue to reach 76.0% fibo and the local high at 0.9303 and 0.9343 respectively. The local support is the low at 0.9177.
Article By RoboForex.com
Attention!
Forecasts presented in this section only reflect the author’s private opinion and should not be considered as guidance for trading. RoboForex LP bears no responsibility for trading results based on trading recommendations described in these analytical reviews.

- Oil prices fall back to pre‑war levels. Silver drops to a 7‑month low Jun 25, 2026
- Gold Falls to an Eight-Month Low: This May Not Be the Bottom Jun 25, 2026
- Stock indices came under heavy selling pressure amid growing skepticism about AI investments Jun 24, 2026
- The Pound Is Pressured Not by Politics, but by a Strong US Dollar Jun 24, 2026
- Global crude oil prices continued to decline. The AUD/USD exchange rate hit an 11‑week low Jun 23, 2026
- EUR/USD Remains Under Sellers’ Control as the Dollar Stays Strong Jun 23, 2026
- Gold Falls for the Third Consecutive Week: Is There Still Upside Potential? Jun 22, 2026
- Bank Indonesia raised its interest rate. Norges Bank and the SNB left rates unchanged Jun 19, 2026
- EUR/USD Loses Ground as Market Sentiment Favours the US Dollar Jun 19, 2026
- GBPUSD Awaits Bank of England Meeting Near April Lows Jun 18, 2026