
By Dmitriy Gurkovskiy, Chief Analyst at RoboForex
EUR/USD is starting the final week of January with a decline towards 1.1320. The American currency is in demand due to investors’ interest in “safe haven” assets: the external background is looking rather pessimistic.
This week, market players will focus their attention on the US Fed session. It would be hard to overestimate the importance of this event. The entire financial world is expecting the American regulator to provide any hints at what the Fed is planning to do in March: raise the benchmark interest rate, announce the number of rate hikes in 2022, speak about the time of its balance reduction.
One may assume that in anticipation of the Fed’s comments and decisions investors will save their strengths and remain calm.
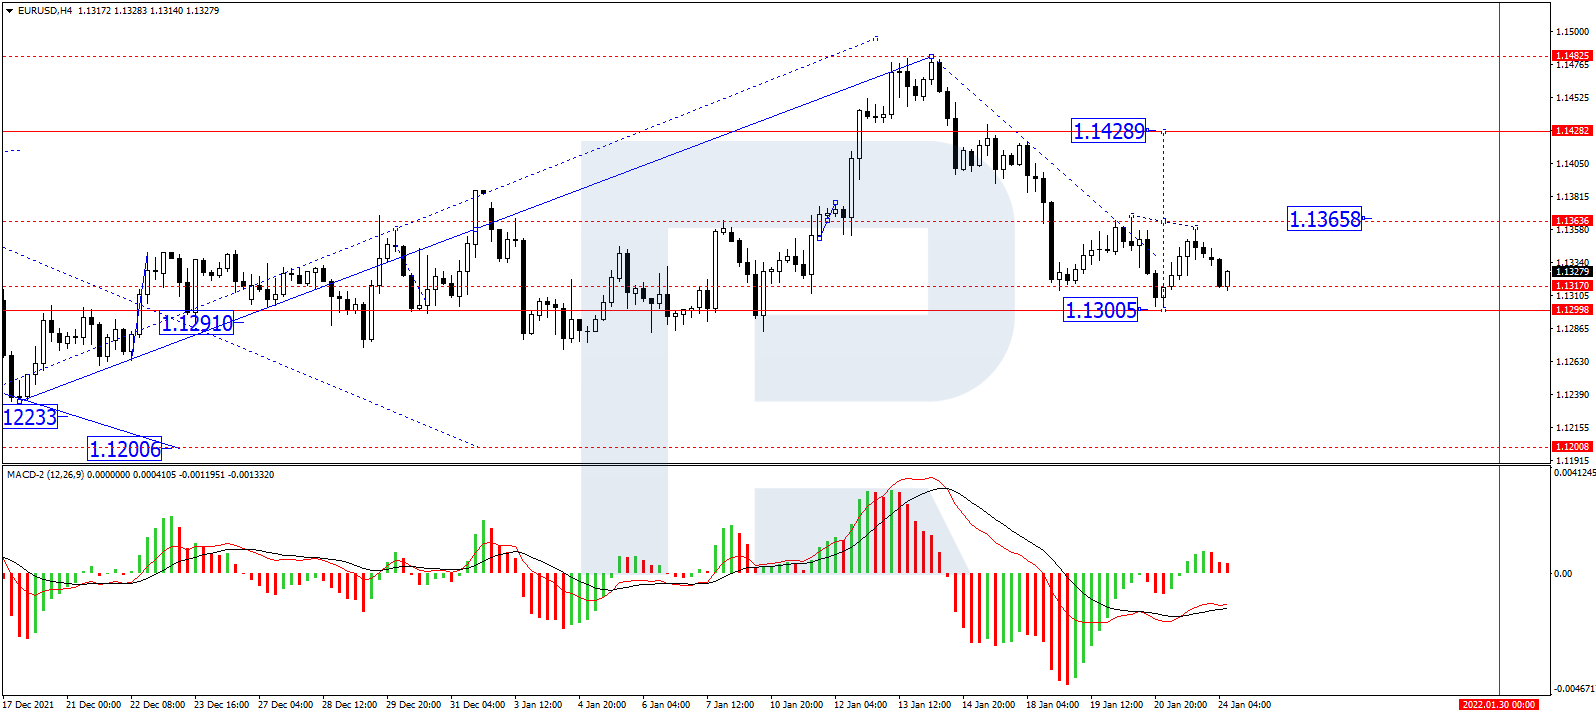
In the H4 chart, EUR/USD has finished another ascending wave at 1.1390; right now, it is correcting towards 1.1317 and may later form a new consolidation range near the lows. After that, the instrument may break the range to the upside and form one more ascending structure towards 1.1358 or even higher, to reach the first target at 1.1428. From the technical point of view, this scenario is confirmed by MACD Oscillator: its signal line is moving towards 0. After breaking this level, it may continue trading to reach new highs.
Free Reports:
 Sign Up for Our Stock Market Newsletter – Get updated on News, Charts & Rankings of Public Companies when you join our Stocks Newsletter
 Get our Weekly Commitment of Traders Reports - See where the biggest traders (Hedge Funds and Commercial Hedgers) are positioned in the futures markets on a weekly basis.
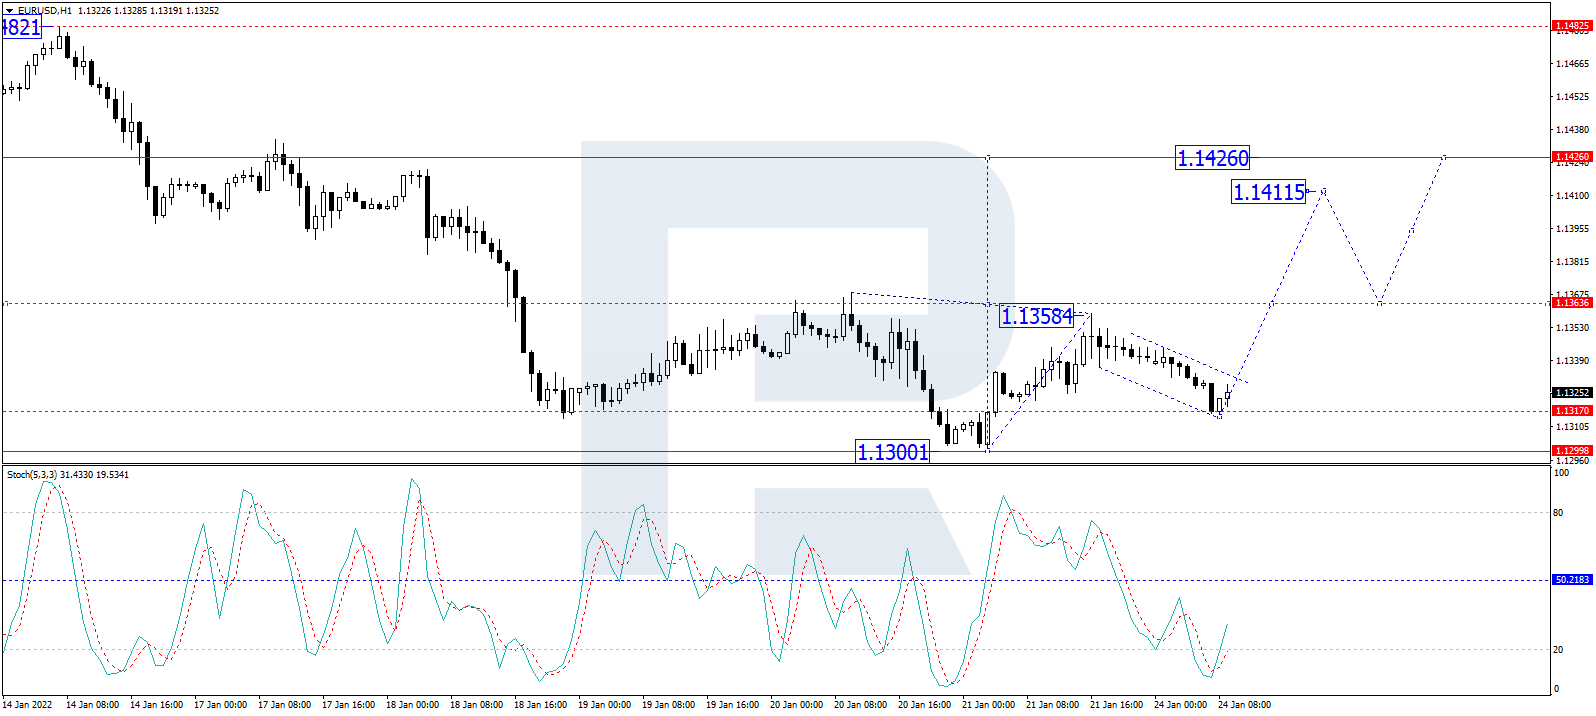
As we can see in the H1 chart, after completing the descending correction at 1.1317, EUR/USD is consolidating around this level. If later the price breaks this range to the upside, the market may form another ascending structure to break 1.1358. After that, the instrument may continue trading upwards with the short-term target at 1.1411. From the technical point of view, this idea is confirmed by the Stochastic Oscillator: after breaking 20, its signal line is growing to reach and break 50, thus boosting the price growth in the price chart.
Disclaimer
Any forecasts contained herein are based on the author’s particular opinion. This analysis may not be treated as trading advice. RoboForex bears no responsibility for trading results based on trading recommendations and reviews contained herein.

- Oil prices fall back to pre‑war levels. Silver drops to a 7‑month low Jun 25, 2026
- Gold Falls to an Eight-Month Low: This May Not Be the Bottom Jun 25, 2026
- Stock indices came under heavy selling pressure amid growing skepticism about AI investments Jun 24, 2026
- The Pound Is Pressured Not by Politics, but by a Strong US Dollar Jun 24, 2026
- Global crude oil prices continued to decline. The AUD/USD exchange rate hit an 11‑week low Jun 23, 2026
- EUR/USD Remains Under Sellers’ Control as the Dollar Stays Strong Jun 23, 2026
- Gold Falls for the Third Consecutive Week: Is There Still Upside Potential? Jun 22, 2026
- Bank Indonesia raised its interest rate. Norges Bank and the SNB left rates unchanged Jun 19, 2026
- EUR/USD Loses Ground as Market Sentiment Favours the US Dollar Jun 19, 2026
- GBPUSD Awaits Bank of England Meeting Near April Lows Jun 18, 2026