
It seems the old order may be changing. US NFP (employment figures) are always the major dataset as traders gear themselves up for the month(s) ahead with payrolls data which especially recently, has been rather quirky with its numerous revisions. But we have a new contender in town, as it’s Friday and inflation figures are now all that matters to policymakers.
How long will they last at such high levels? Are we nearing the top?
US CPI is expected to increase to 6.8% y/y in November. This overtakes a 6.2% increase which was the fastest gain in 31 years. Another high print in forecast in the core reading at 0.5% m/m, after the October rise of 0.6%. Some economists even put the headline above 7%, unheard of since 1984.
Fed eyes on price pressures
Recent comments from Fed Chair Powell that inflation may not be transitory highlight the risks ahead of next week’s FOMC meeting. The fact that the Fed already made it very clear that it will step up the tightening of policy could see a more limited impact than many fear is possible on a 7% print.
Free Reports:
 Download Our Metatrader 4 Indicators – Put Our Free MetaTrader 4 Custom Indicators on your charts when you join our Weekly Newsletter
 Get our Weekly Commitment of Traders Reports - See where the biggest traders (Hedge Funds and Commercial Hedgers) are positioned in the futures markets on a weekly basis.
Of course, an overshoot above this figure could come in the next few months but this risks further hawkish action by the Fed.
That said, it is worth keeping in mind that base effects are expected to bring down inflation in time, though no doubt they will still be elevated. There are also signs that supply bottlenecks may be starting to ease, which would also help push inflation lower into the new year.
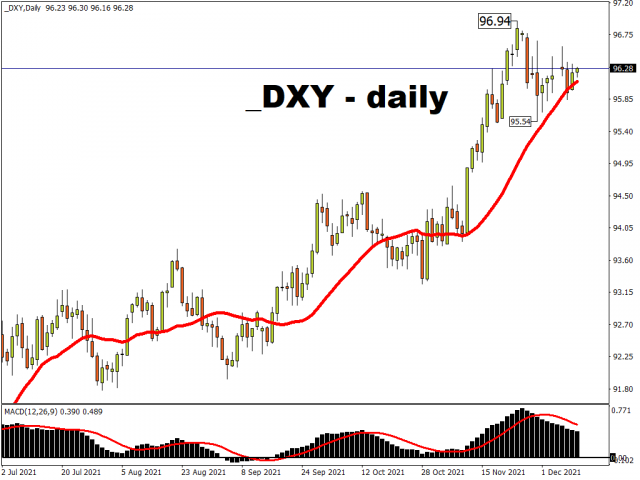
DXY in (bullish) consolidation mode
The dollar is strengthening this morning, underpinned by safe haven demand. Asian stocks have fallen on renewed concerns over the China Evergrande default and fallout. Omicron fears are also evident as more countries push ahead with restrictions at what is normally the busiest time of year for the hospitality sector.
The Dollar Index pushed lower to 95.54 to finish last month. But prices have been supported by the 21-day moving average as well as the 50% retracement level of the major 2020 to 2021 move just above 96. Seasonal trends are not always supportive of the buck through December. But the long- term trend is for higher prices and any hawkish change by the Fed and into the new year could see a renewed push higher.
Bulls will have the cycle high at 96.94 firmly in their sights.
Oil rally comes under pressure
Along with other risk assets, the oil market sold off yesterday as Omicron concerns continue to linger. The downgrading of two Chinese property developers has also not helped sentiment. But assuming no big selloff today, crude has enjoyed a better week, after spiking lower to $65.79.
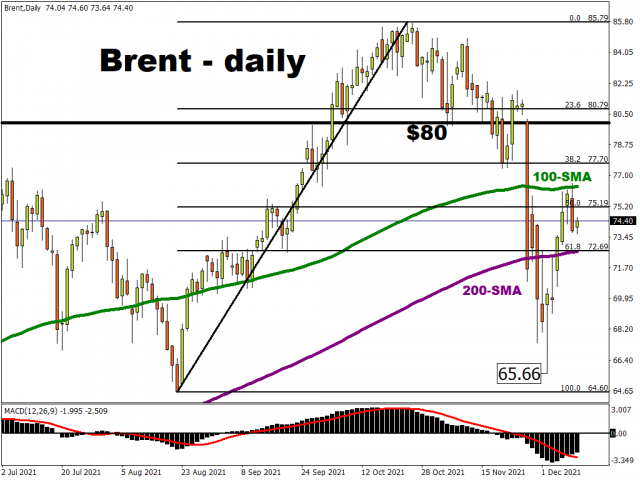
The rebound has taken prices back above the 200-day simple moving average at $72.64, which is now support.
Prices are currently trading around the long-term trendline from the March 2020 low, with the 100-day simple moving average above here acting as initial resistance at $76.35.
Disclaimer: The content in this article comprises personal opinions and should not be construed as containing personal and/or other investment advice and/or an offer of and/or solicitation for any transactions in financial instruments and/or a guarantee and/or prediction of future performance. ForexTime (FXTM), its affiliates, agents, directors, officers or employees do not guarantee the accuracy, validity, timeliness or completeness, of any information or data made available and assume no liability as to any loss arising from any investment based on the same.
![]() Article by ForexTime
Article by ForexTime
ForexTime Ltd (FXTM) is an award winning international online forex broker regulated by CySEC 185/12 www.forextime.com

- Oil prices fall back to pre‑war levels. Silver drops to a 7‑month low Jun 25, 2026
- Gold Falls to an Eight-Month Low: This May Not Be the Bottom Jun 25, 2026
- Stock indices came under heavy selling pressure amid growing skepticism about AI investments Jun 24, 2026
- The Pound Is Pressured Not by Politics, but by a Strong US Dollar Jun 24, 2026
- Global crude oil prices continued to decline. The AUD/USD exchange rate hit an 11‑week low Jun 23, 2026
- EUR/USD Remains Under Sellers’ Control as the Dollar Stays Strong Jun 23, 2026
- Gold Falls for the Third Consecutive Week: Is There Still Upside Potential? Jun 22, 2026
- Bank Indonesia raised its interest rate. Norges Bank and the SNB left rates unchanged Jun 19, 2026
- EUR/USD Loses Ground as Market Sentiment Favours the US Dollar Jun 19, 2026
- GBPUSD Awaits Bank of England Meeting Near April Lows Jun 18, 2026