
Article By RoboForex.com
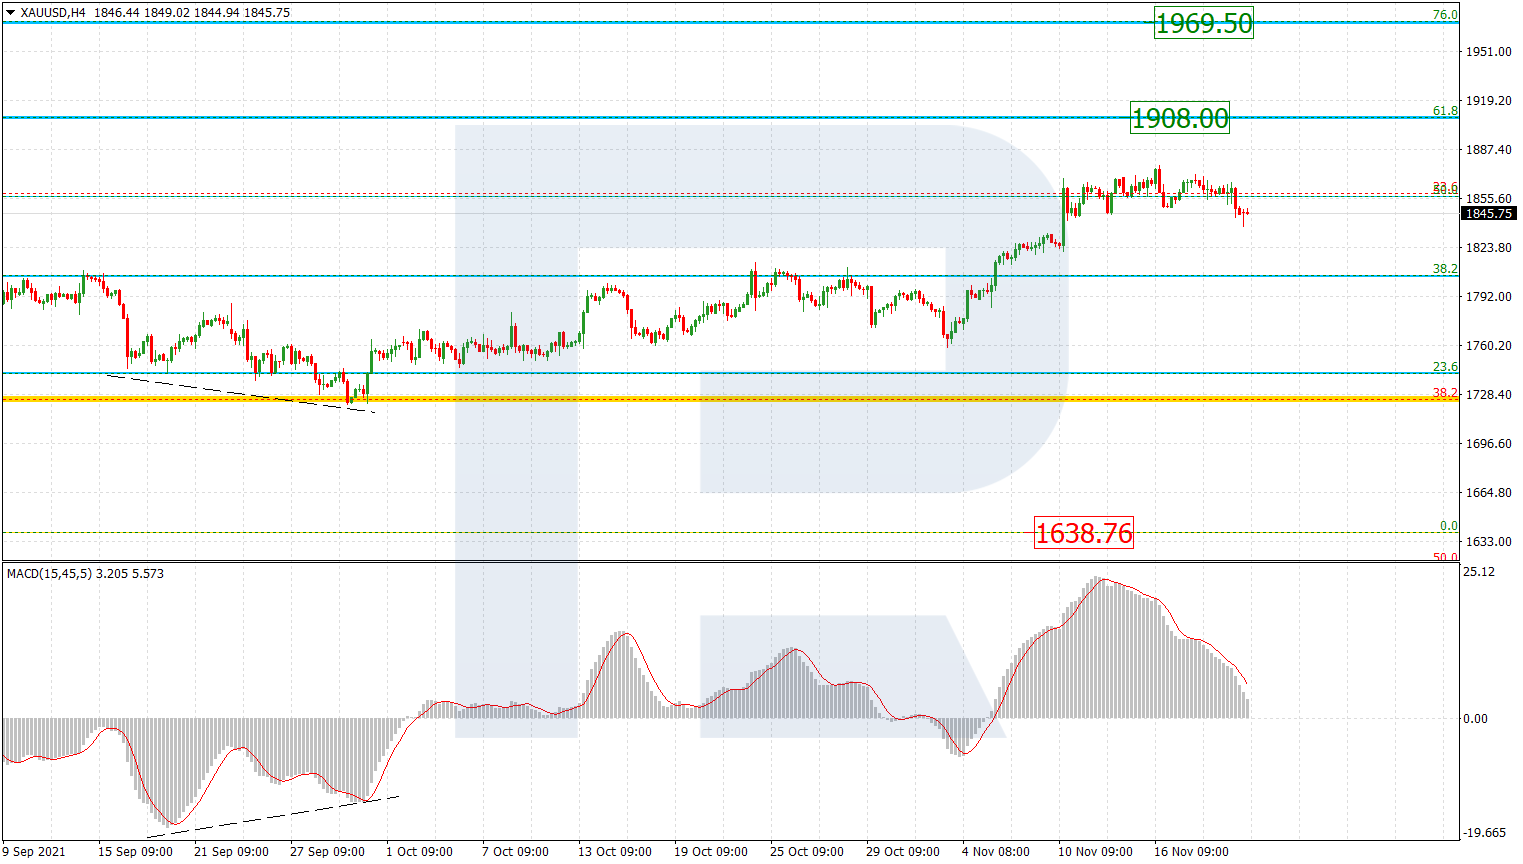
XAUUSD, “Gold vs US Dollar”
In the H4 chart, XAUUSD is correcting around 50.0% fibo. After the correction is over, the next upside targets may be 61.8% and 76.0% fibo at 1908.00 and 1969.50 respectively. However, the key upside target is the all-time high at 2074.75. The key support is the low at 1638.76.

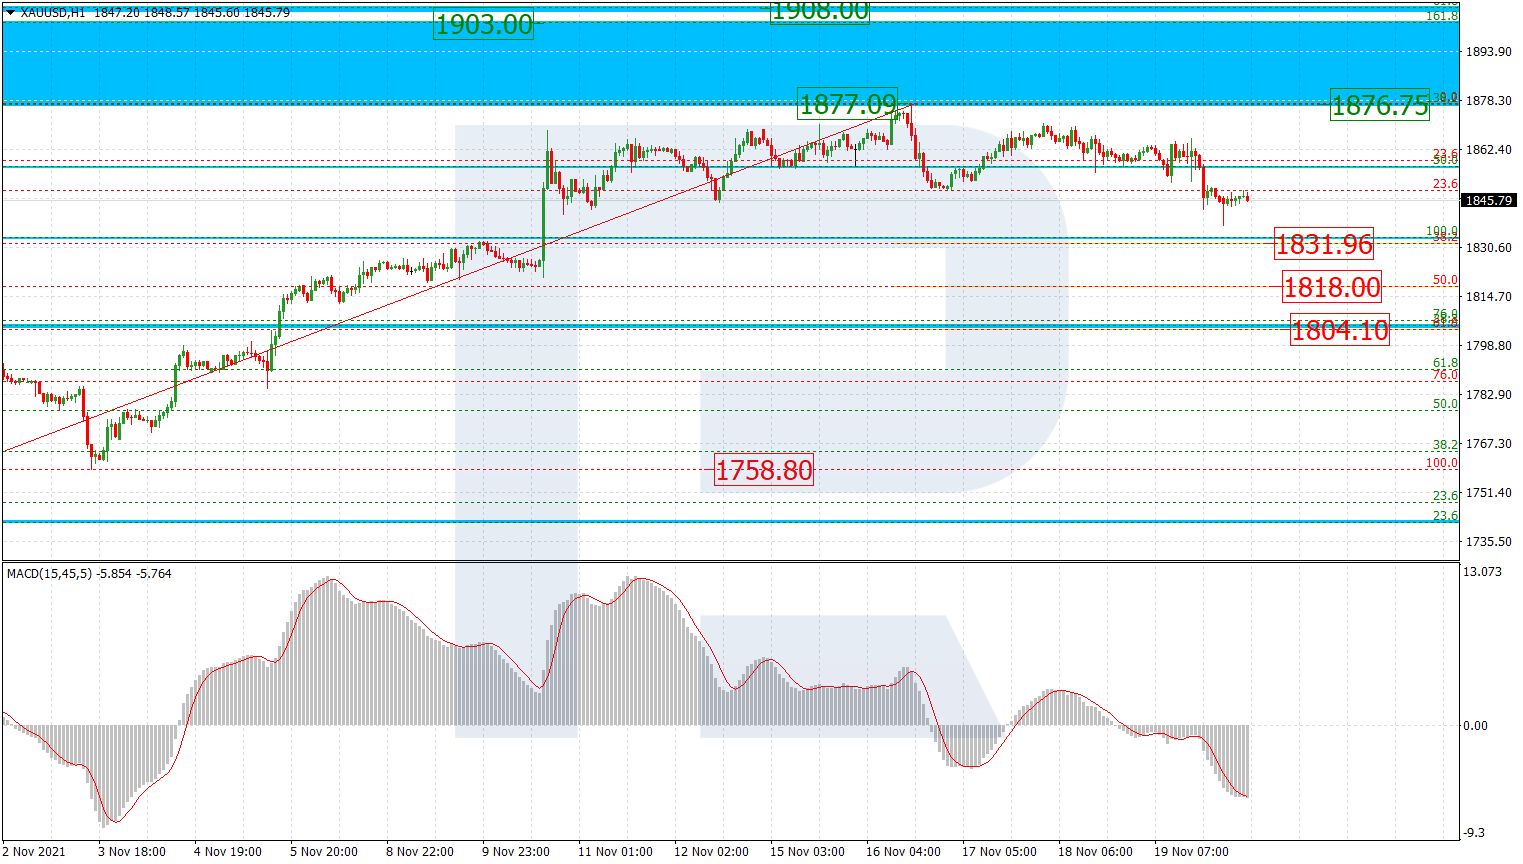
The H1 chart shows a more detailed structure of the current correction, which has already reached 23.6% fibo and may later continue towards 38.2%, 50.0%, and 61.8% fibo at 1831.96, 1818.00, and 1804.10 respectively. A breakout of the local resistance at 1877.09 will result in a further uptrend towards the short-term post-correctional extension area between 138.2% and 161.8% fibo at 1876.75 and 1903.00 respectively.
Free Reports:
 Download Our Metatrader 4 Indicators – Put Our Free MetaTrader 4 Custom Indicators on your charts when you join our Weekly Newsletter
 Get our Weekly Commitment of Traders Reports - See where the biggest traders (Hedge Funds and Commercial Hedgers) are positioned in the futures markets on a weekly basis.
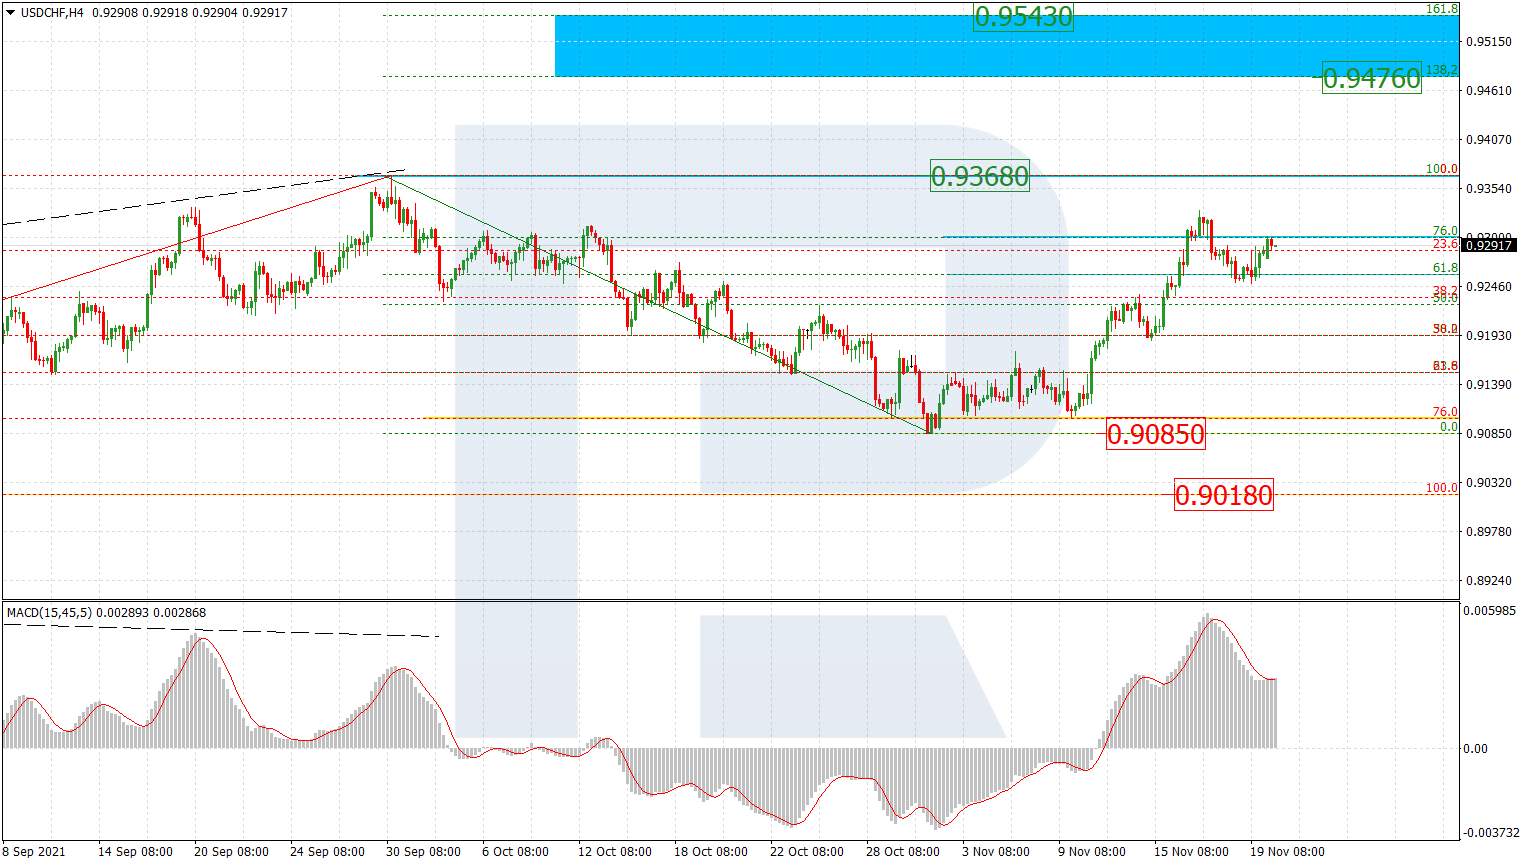
USDCHF, “US Dollar vs Swiss Franc”
As we can see in the H4 chart, after reaching 76.0% fibo, the ascending wave has transformed into a new pullback. After the pullback is over, the pair may resume growing towards the high at 0.9368, a breakout of which will result in a further uptrend towards the short-term post-correctional extension area between 138.2% and 161.8% fibo at 0.9476 and 0.9543 respectively. The key support is at 0.9085.
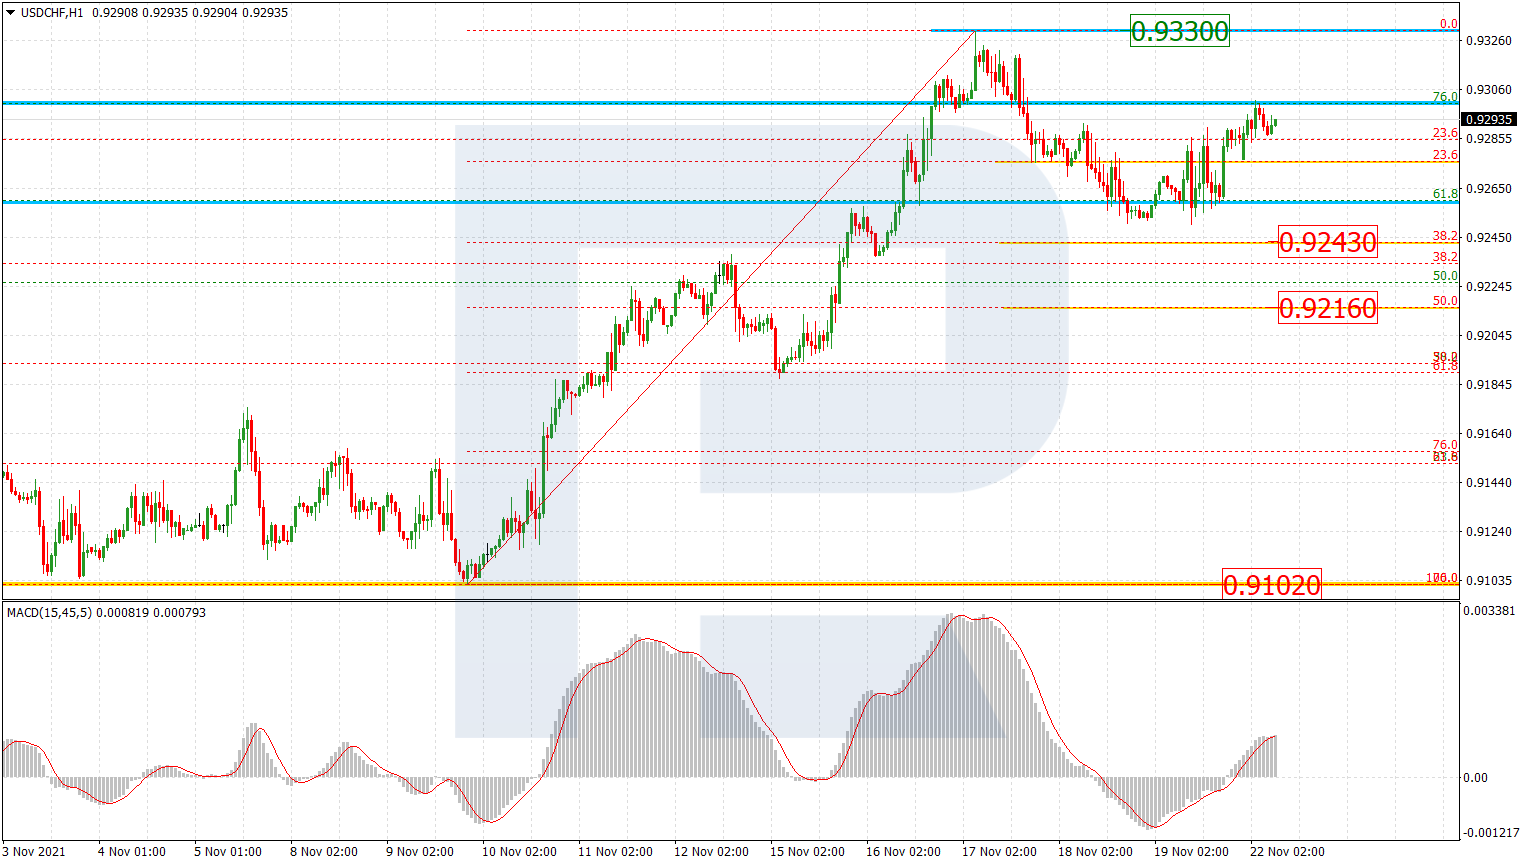
In the H1 chart, after completing the correctional decline and breaking 23.6% fibo, the pair is attempting to grow and reach the high at 0.9330. The next downside target will be 38.2% and 50.0% fibo at 0.9243 and 0.9216 respectively. The key support is at 0.9102.
Article By RoboForex.com
Attention!
Forecasts presented in this section only reflect the author’s private opinion and should not be considered as guidance for trading. RoboForex LP bears no responsibility for trading results based on trading recommendations described in these analytical reviews.

- Oil prices fall back to pre‑war levels. Silver drops to a 7‑month low Jun 25, 2026
- Gold Falls to an Eight-Month Low: This May Not Be the Bottom Jun 25, 2026
- Stock indices came under heavy selling pressure amid growing skepticism about AI investments Jun 24, 2026
- The Pound Is Pressured Not by Politics, but by a Strong US Dollar Jun 24, 2026
- Global crude oil prices continued to decline. The AUD/USD exchange rate hit an 11‑week low Jun 23, 2026
- EUR/USD Remains Under Sellers’ Control as the Dollar Stays Strong Jun 23, 2026
- Gold Falls for the Third Consecutive Week: Is There Still Upside Potential? Jun 22, 2026
- Bank Indonesia raised its interest rate. Norges Bank and the SNB left rates unchanged Jun 19, 2026
- EUR/USD Loses Ground as Market Sentiment Favours the US Dollar Jun 19, 2026
- GBPUSD Awaits Bank of England Meeting Near April Lows Jun 18, 2026