It was another day but the same old story for financial markets as inflation worries weighed on sentiment.
Global shares were mixed, the dollar weakened while gold struggled to push higher despite the sense of caution. Other than the fantastic rebound on the EURUSD and some Lira driven action in the emerging market arena, it was a boring day in the FX space with most currencies struggling for direction. According to Bloomberg, the biggest mover in the G10 space today was the Norway Krone which gained 0.65% against the dollar. Not far behind were the New Zealand Dollar and Euro which both appreciated over 0.5%.
On days like this when not much is going in the FX markets, I tend to check out the various trends in play by using multiple timeframe analysis (MTFA). This is a method of analysing long-term, medium-term, and short-term timeframes to achieve an accurate entry or exit when trading the markets. With everyone talking about the EURUSD, I could not help but use MTFA to gauge how much further prices could fall.
EURUSD set to suffer steeper drop?
Free Reports:
 Get our Weekly Commitment of Traders Reports - See where the biggest traders (Hedge Funds and Commercial Hedgers) are positioned in the futures markets on a weekly basis.
 Download Our Metatrader 4 Indicators – Put Our Free MetaTrader 4 Custom Indicators on your charts when you join our Weekly Newsletter
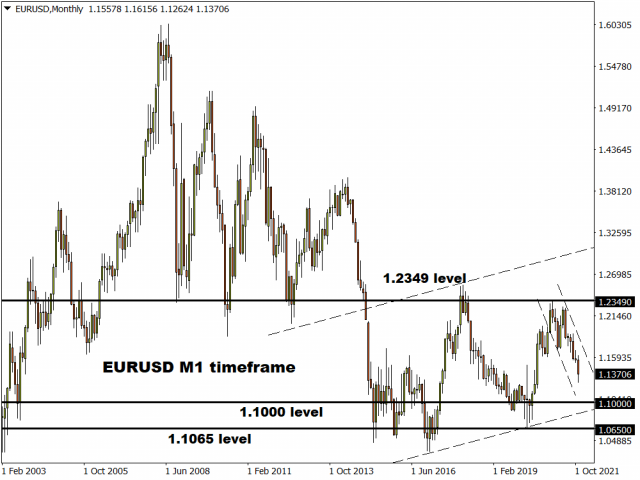
On the monthly timeframe, the path of least resistance for the currency pair points south. There have been consistently lower lows and lower highs with prices respecting a bearish channel since the start of 2021. However, looking all the way back to 2013 we can see a bullish channel in play. A strong rebound could be on the cards if 1.1000 becomes the new higher low. Alternatively, a breakdown below this point could signal a decline towards 1.0650.
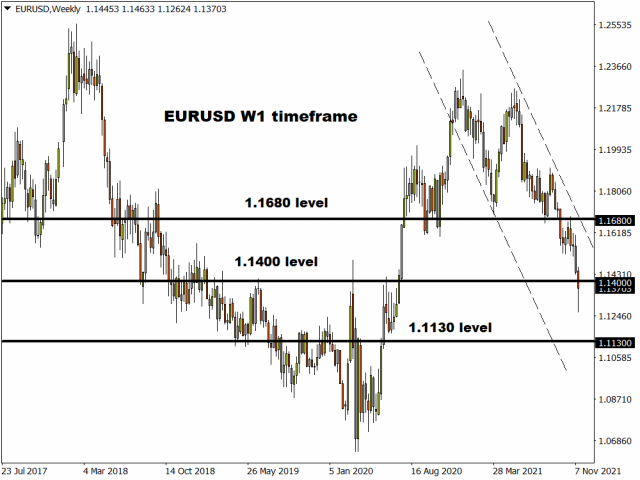
Zooming into the weekly charts, bears remain in a position of power. A strong weekly close below 1.1400 may open the doors towards 1.1130.
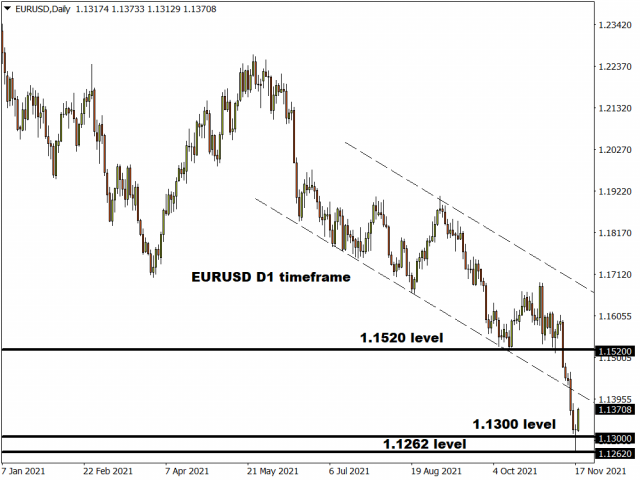
Taking a look at the daily timeframe, the EURUSD could be experiencing a technical bounce. While prices could push higher towards 1.1400 and beyond, the key level to watch out for is 1.1520. Sustained weakness below this point could encourage a decline back towards 1.1300 and 1.1262.
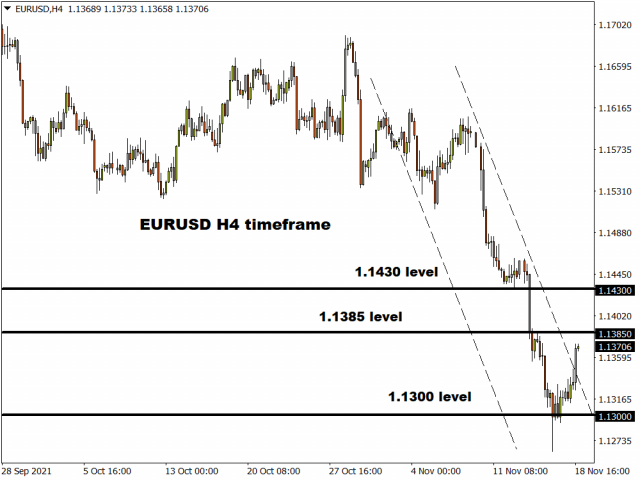
Prices remain under pressure on the H4 timeframe despite the recent rebound. An intraday move towards 1.1385 and 1.1430 could be a possibility before bears re-enter the scene.
GBPUSD gearing for a major move?
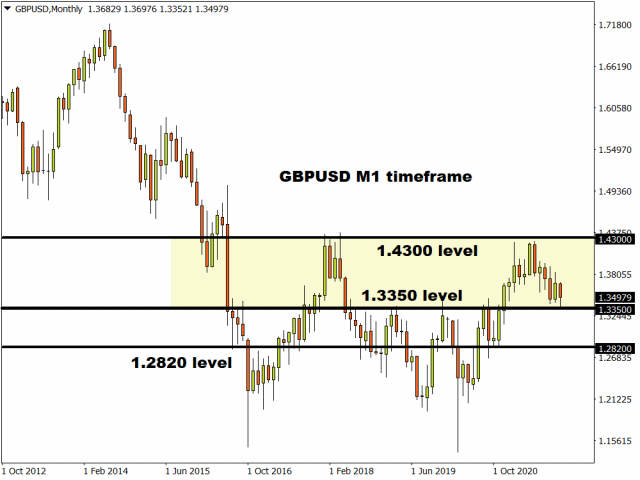
Believe it or not, the GBPUSD remains trapped in a wide range on the monthly charts with support at 1.3350 and resistance at 1.4300. A strong monthly close below 1.3350 will signal a breakdown with the next level of interest at 1.2820.
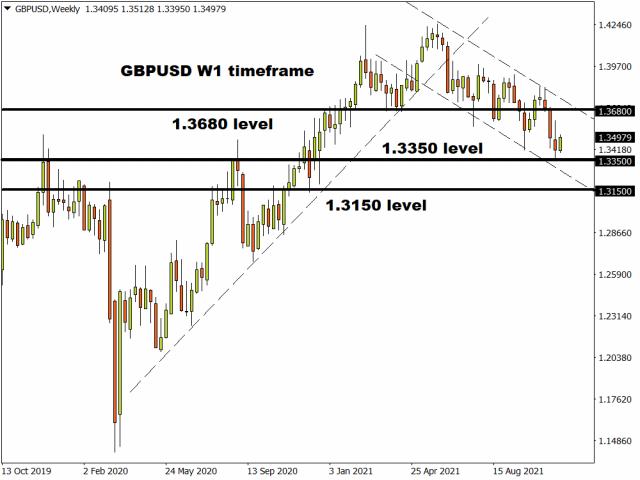
The weekly timeframe illustrates a similar picture with 1.3350 acting as crucial support. Should bears conquer this level, the next key point of interest may be found at 1.3150. Alternatively, a rebound from 1.3350 is seen opening the doors back towards 1.3680.
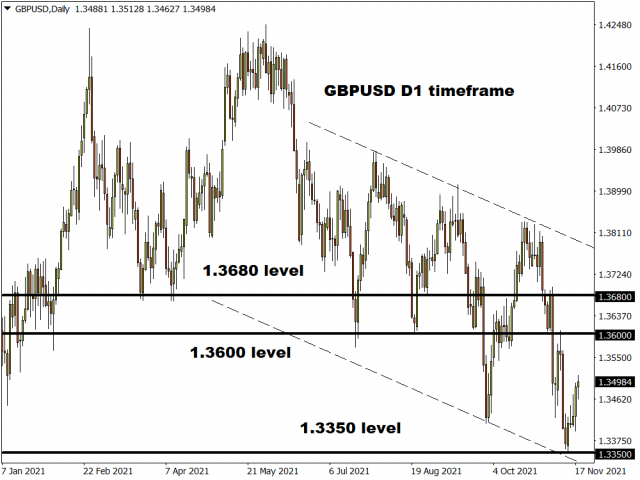
On the daily charts, prices remain in a bearish channel. However, a technical rebound could be in play with 1.3600 acting as the first resistance. If this level gives way, we could see a move towards 1.3680 before the selloff resumes.
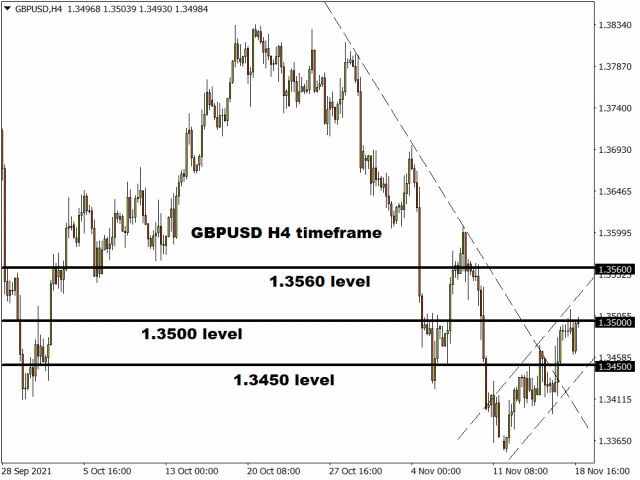
A breakout above 1.3500 could be around the corner on the H4 timeframe. If this level proves to be unreliable resistance, prices are likely to rally towards 1.3560.
Commodity spotlight – Gold
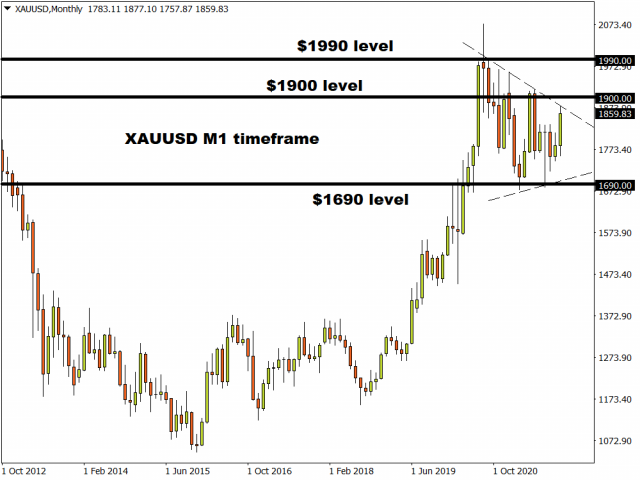
It’s the same old story with gold on the monthly timeframe. Support remains around $1690 and resistance around $1900. A breakout above $1900 is seen opening a path towards $1990.
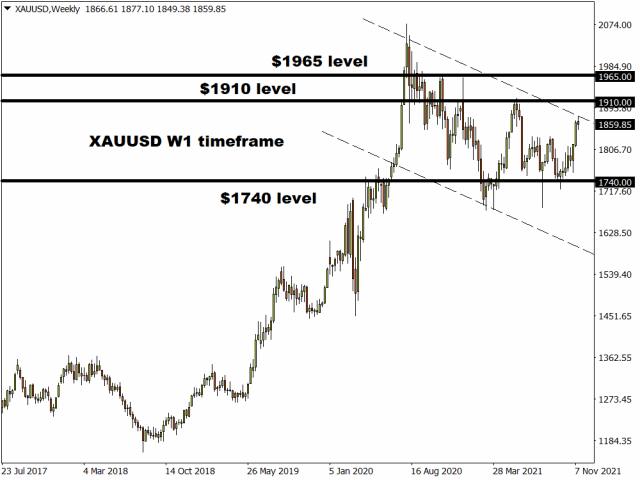
There is a similar theme on the weekly charts. A move above $1900 is likely to trigger an incline towards $1910 and $1965, respectively. If bulls run out of steam, prices may descend back towards $1740.
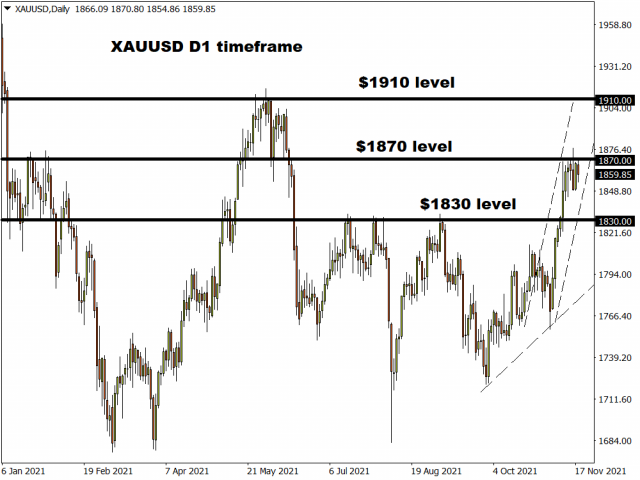
On the daily, a strong close above $1870 may inspire bulls to test $1910. If $1870 proves to be unreliable resistance, gold could decline back towards $1830.
Disclaimer: The content in this article comprises personal opinions and should not be construed as containing personal and/or other investment advice and/or an offer of and/or solicitation for any transactions in financial instruments and/or a guarantee and/or prediction of future performance. ForexTime (FXTM), its affiliates, agents, directors, officers or employees do not guarantee the accuracy, validity, timeliness or completeness, of any information or data made available and assume no liability as to any loss arising from any investment based on the same.
 Article by ForexTime
ForexTime Ltd (FXTM) is an award winning international online forex broker regulated by CySEC 185/12 www.forextime.com

- Canadian dollar declines after weak GDP data. Qatar threatens EU to halt natural gas exports Dec 24, 2024
- Goldman Sachs has updated its economic projections for 2025. EU countries are looking for alternative sources of natural gas Dec 23, 2024
- COT Bonds Charts: Speculator Bets led by SOFR 3-Months & 10-Year Bonds Dec 21, 2024
- COT Metals Charts: Speculator Bets led lower by Gold, Copper & Palladium Dec 21, 2024
- COT Soft Commodities Charts: Speculator Bets led by Live Cattle, Lean Hogs & Coffee Dec 21, 2024
- COT Stock Market Charts: Speculator Bets led by S&P500 & Russell-2000 Dec 21, 2024
- Riksbank and Banxico cut interest rates by 0.25%. BoE, Norges Bank, and PBoC left rates unchanged Dec 20, 2024
- Brent Oil Under Pressure Again: USD and China in Focus Dec 20, 2024
- Market round-up: BoE & BoJ hold, Fed delivers ‘hawkish’ cut Dec 19, 2024
- NZD/USD at a New Low: The Problem is the US Dollar and Local GDP Dec 19, 2024

