
By Dmitriy Gurkovskiy, Chief Analyst at RoboForex
Early in the new week of October, EUR/USD is looking good and trading at 1.1660. the factor that supports the European currency is the global risk attitude.
So far, the US Fed hasn’t given any signals of the QE programme reduction in November. This fact upsets the “greenback” enthusiasts, who obviously decided to take a break and wait for any relevant news.
This week, the European Central Bank is scheduled to have a meeting, where it is expected to keep its monetary policy aspects intact. It will be very interesting to hear the regulator’s comments about the stimulus, which is currently not expected to change.
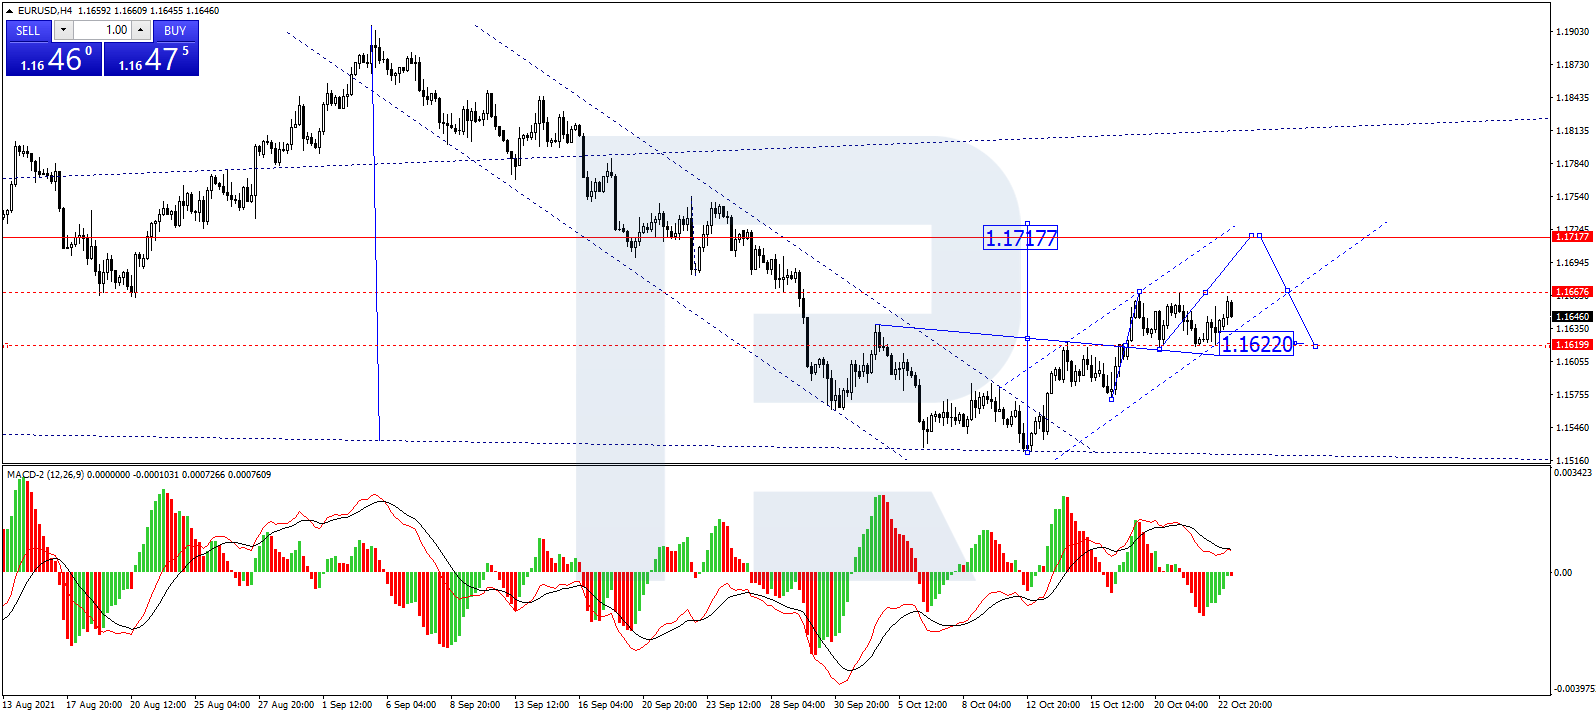
In the H4 chart, EUR/USD has formed a consolidation range around 1.1642 in the form of a Triangle pattern. Possibly, the pair may break the range and grow to reach the pattern’s upside border at 1.1685. If later the price breaks this level to the upside, the market may continue trading upwards with the target at 1.1710 (at least). From the technical point of view, this scenario is confirmed by MACD Oscillator: its signal line is moving above 0, while histograms are showing a steady wave to the upside.
Free Reports:
 Get our Weekly Commitment of Traders Reports - See where the biggest traders (Hedge Funds and Commercial Hedgers) are positioned in the futures markets on a weekly basis.
 Sign Up for Our Stock Market Newsletter – Get updated on News, Charts & Rankings of Public Companies when you join our Stocks Newsletter
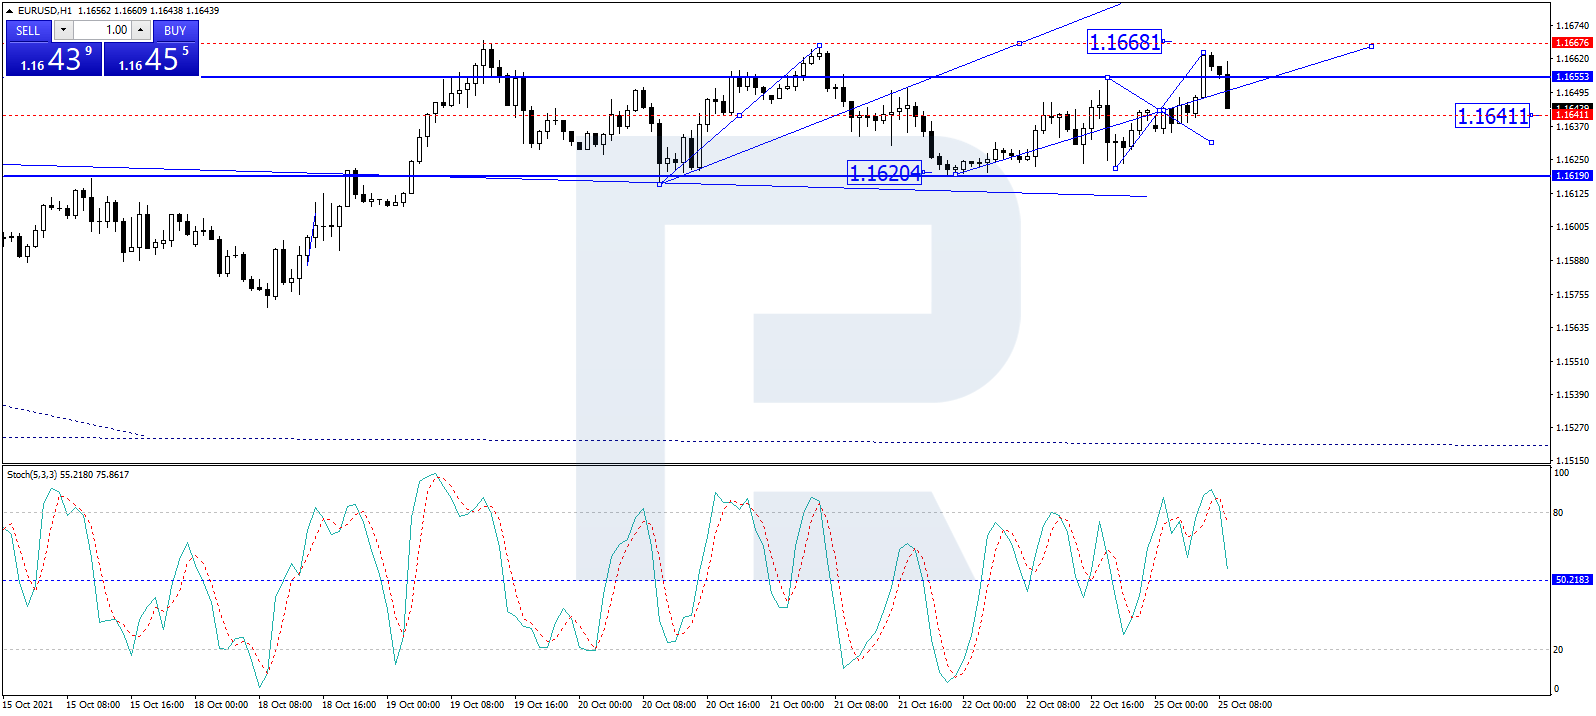
As we can see in the H1 chart, after rebounding from 1.1664 to the downside, EUR/USD is falling towards 1.1642. Possibly, the pair may rebound from the latter level and resume growing to reach 1.1688. After that, the instrument may break this level as well and continue trading upwards with the target at 1.1710. From the technical point of view, this scenario is confirmed by the Stochastic Oscillator: its signal line is moving below 80. Later, the line is expected to fall towards 50, a rebound from which may lead to another growth to reach 80.
Disclaimer
Any forecasts contained herein are based on the author’s particular opinion. This analysis may not be treated as trading advice. RoboForex bears no responsibility for trading results based on trading recommendations and reviews contained herein.

- Oil prices fall back to pre‑war levels. Silver drops to a 7‑month low Jun 25, 2026
- Gold Falls to an Eight-Month Low: This May Not Be the Bottom Jun 25, 2026
- Stock indices came under heavy selling pressure amid growing skepticism about AI investments Jun 24, 2026
- The Pound Is Pressured Not by Politics, but by a Strong US Dollar Jun 24, 2026
- Global crude oil prices continued to decline. The AUD/USD exchange rate hit an 11‑week low Jun 23, 2026
- EUR/USD Remains Under Sellers’ Control as the Dollar Stays Strong Jun 23, 2026
- Gold Falls for the Third Consecutive Week: Is There Still Upside Potential? Jun 22, 2026
- Bank Indonesia raised its interest rate. Norges Bank and the SNB left rates unchanged Jun 19, 2026
- EUR/USD Loses Ground as Market Sentiment Favours the US Dollar Jun 19, 2026
- GBPUSD Awaits Bank of England Meeting Near April Lows Jun 18, 2026