Article By RoboForex.com
AUDUSD, “Australian Dollar vs US Dollar”
As we can see in the H4 chart, the asset is moving within the descending tendency to reach the low at 0.7106, a breakout of which may lead to a further downtrend towards mid-term 38.2% and 50.0% fibo at 0.7052 and 0.6758 respectively. At the same time, there is convergence on MACD to indicate a possible pullback soon, which may later transform into a new rising wave towards 50.0% and 61.8% fibo at 0.7499 and 0.7591 respectively.


The H1 chart of AUDUSD shows a more detailed structure of the current descending wave. By now, the price has already tested 76.0% fibo and may continue falling to break it and reach the low at 0.7106.


USDCAD, “US Dollar vs Canadian Dollar”
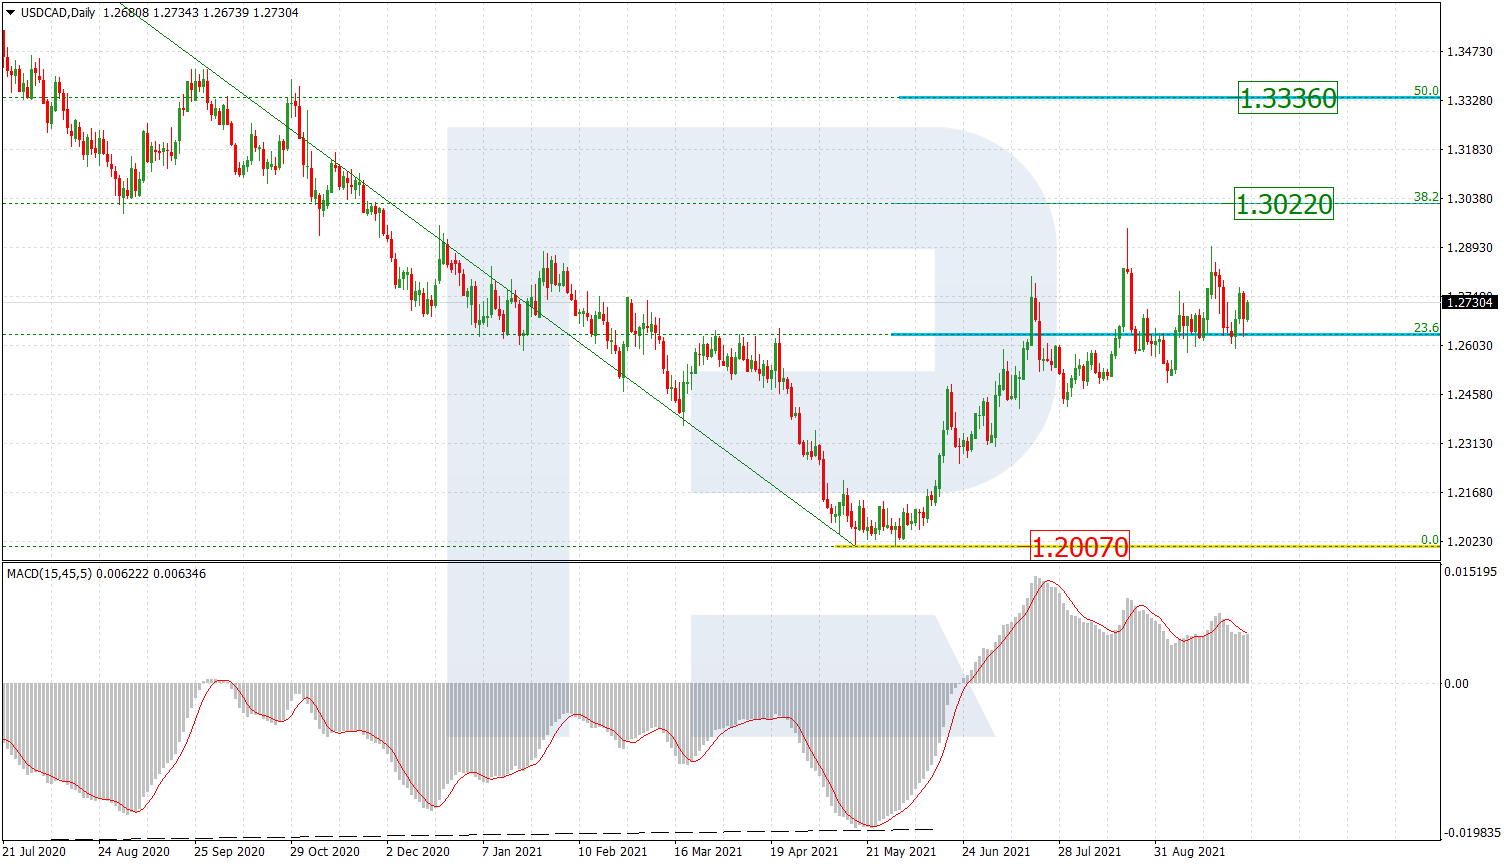
In the daily chart, USDCAD is still consolidating around 23.6% fibo. Possibly, the asset may beak the range to the upside and resume its ascending tendency. The next upside targets may be 38.2% and 50.0% fibo at 1.3022 and 1.3336 respectively. The key support is the low at 1.2007.


As we can see in the H4 chart, the descending wave has failed to reach and break the low at 1.2493. If it had happened, the asset would have been able to reach 50.0% and 61.8% fibo at 1.2478 and 1.2366 respectively. Instead of this, the pair is expected to grow and break the high at 1.2949.

Article By RoboForex.com
Attention!
Forecasts presented in this section only reflect the author’s private opinion and should not be considered as guidance for trading. RoboForex LP bears no responsibility for trading results based on trading recommendations described in these analytical reviews.
