By InvestMacro.com COT Home | Data Tables | Data Downloads | Newsletter
Here are the latest charts and statistics for the Commitment of Traders (COT) data published by the Commodities Futures Trading Commission (CFTC).
The latest COT data is updated through Tuesday September 21st 2021 and shows a quick view of how large traders (for-profit speculators and commercial entities) were positioned in the futures markets.
WTI Crude Oil Futures:
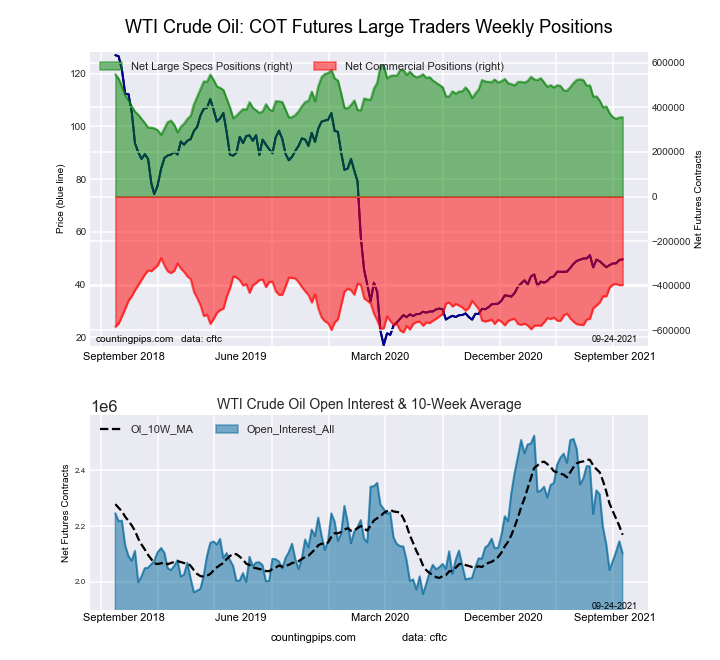 The WTI Crude Oil Futures large speculator standing this week totaled a net position of 355,978 contracts in the data reported through Tuesday. This was a weekly gain of 914 contracts from the previous week which had a total of 355,064 net contracts.
This week’s current strength score (the trader positioning range over the past three years, measured from 0 to 100) shows the speculators are currently Bearish with a score of 25.2 percent. The commercials are Bullish with a score of 63.7 percent and the small traders (not shown in chart) are Bullish with a score of 71.7 percent.
| WTI Crude Oil Futures Statistics | SPECULATORS | COMMERCIALS | SMALL TRADERS |
| – Percent of Open Interest Longs: | 24.1 | 34.7 | 4.3 |
| – Percent of Open Interest Shorts: | 7.2 | 53.5 | 2.4 |
| – Net Position: | 355,978 | -396,180 | 40,202 |
| – Gross Longs: | 506,363 | 728,666 | 90,716 |
| – Gross Shorts: | 150,385 | 1,124,846 | 50,514 |
| – Long to Short Ratio: | 3.4 to 1 | 0.6 to 1 | 1.8 to 1 |
| NET POSITION TREND: | |||
| – COT Index Score (3 Year Range Pct): | 25.2 | 63.7 | 71.7 |
| – COT Index Reading (3 Year Range): | Bearish | Bullish | Bullish |
| NET POSITION MOVEMENT INDEX: | |||
| – 6-Week Change in Strength Index: | -14.2 | 15.1 | -8.3 |
Free Reports:
 Sign Up for Our Stock Market Newsletter – Get updated on News, Charts & Rankings of Public Companies when you join our Stocks Newsletter
 Get our Weekly Commitment of Traders Reports - See where the biggest traders (Hedge Funds and Commercial Hedgers) are positioned in the futures markets on a weekly basis.
Brent Crude Oil Futures:
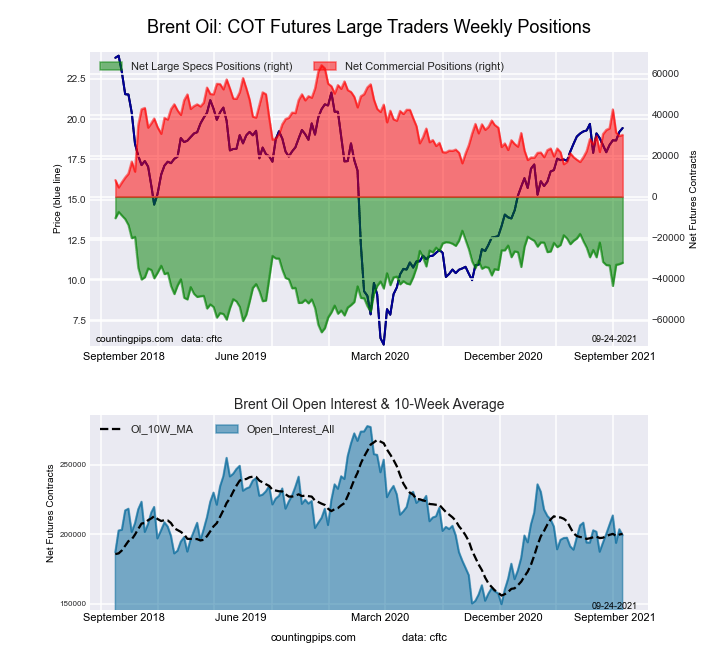 The Brent Crude Oil Futures large speculator standing this week totaled a net position of -32,262 contracts in the data reported through Tuesday. This was a weekly gain of 653 contracts from the previous week which had a total of -32,915 net contracts.
This week’s current strength score (the trader positioning range over the past three years, measured from 0 to 100) shows the speculators are currently Bullish with a score of 57.7 percent. The commercials are Bearish with a score of 43.0 percent and the small traders (not shown in chart) are Bullish with a score of 53.7 percent.
| Brent Crude Oil Futures Statistics | SPECULATORS | COMMERCIALS | SMALL TRADERS |
| – Percent of Open Interest Longs: | 13.5 | 53.9 | 4.0 |
| – Percent of Open Interest Shorts: | 29.7 | 38.7 | 3.0 |
| – Net Position: | -32,262 | 30,181 | 2,081 |
| – Gross Longs: | 26,898 | 107,333 | 7,995 |
| – Gross Shorts: | 59,160 | 77,152 | 5,914 |
| – Long to Short Ratio: | 0.5 to 1 | 1.4 to 1 | 1.4 to 1 |
| NET POSITION TREND: | |||
| – COT Index Score (3 Year Range Pct): | 57.7 | 43.0 | 53.7 |
| – COT Index Reading (3 Year Range): | Bullish | Bearish | Bullish |
| NET POSITION MOVEMENT INDEX: | |||
| – 6-Week Change in Strength Index: | -0.7 | -0.6 | 7.1 |
Natural Gas Futures:
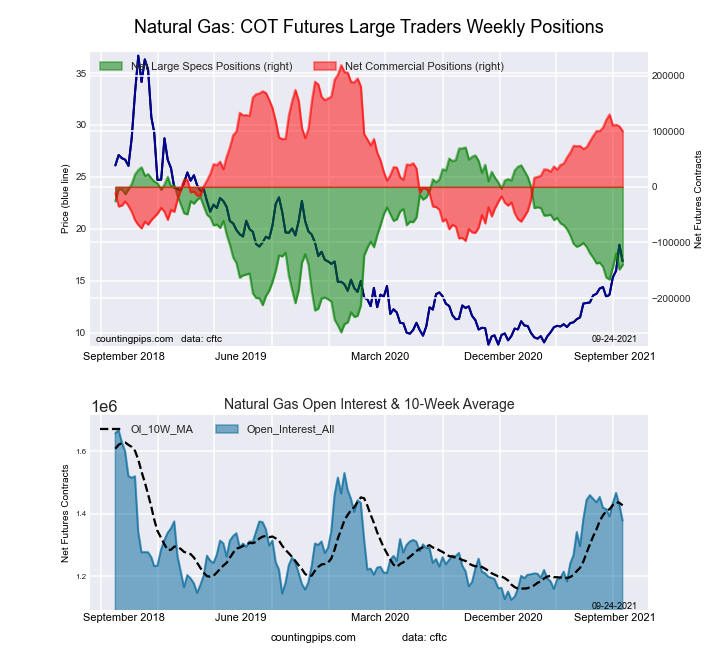 The Natural Gas Futures large speculator standing this week totaled a net position of -140,220 contracts in the data reported through Tuesday. This was a weekly rise of 8,359 contracts from the previous week which had a total of -148,579 net contracts.
This week’s current strength score (the trader positioning range over the past three years, measured from 0 to 100) shows the speculators are currently Bearish with a score of 36.5 percent. The commercials are Bullish with a score of 62.4 percent and the small traders (not shown in chart) are Bullish-Extreme with a score of 80.6 percent.
| Natural Gas Futures Statistics | SPECULATORS | COMMERCIALS | SMALL TRADERS |
| – Percent of Open Interest Longs: | 22.9 | 43.9 | 4.6 |
| – Percent of Open Interest Shorts: | 33.0 | 36.7 | 1.7 |
| – Net Position: | -140,220 | 100,074 | 40,146 |
| – Gross Longs: | 315,115 | 605,341 | 63,891 |
| – Gross Shorts: | 455,335 | 505,267 | 23,745 |
| – Long to Short Ratio: | 0.7 to 1 | 1.2 to 1 | 2.7 to 1 |
| NET POSITION TREND: | |||
| – COT Index Score (3 Year Range Pct): | 36.5 | 62.4 | 80.6 |
| – COT Index Reading (3 Year Range): | Bearish | Bullish | Bullish-Extreme |
| NET POSITION MOVEMENT INDEX: | |||
| – 6-Week Change in Strength Index: | 1.1 | -2.0 | 6.7 |
Gasoline Blendstock Futures:
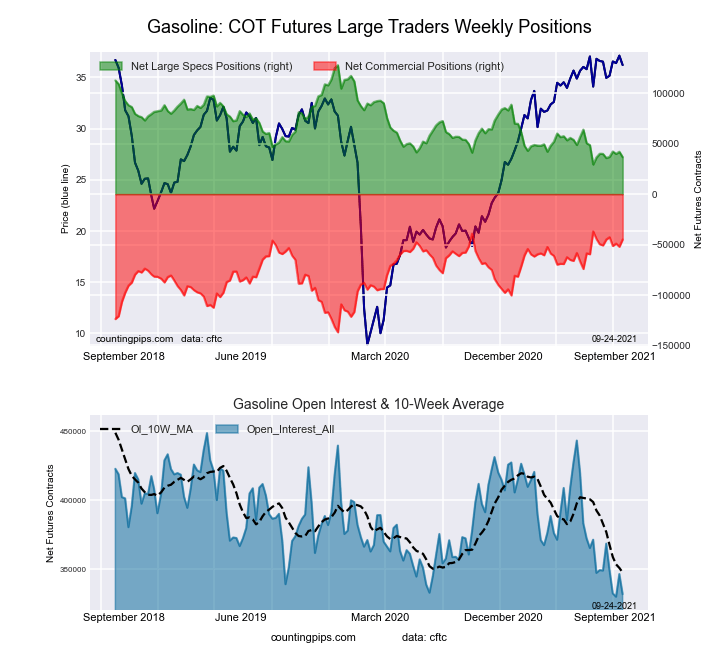 The Gasoline Blendstock Futures large speculator standing this week totaled a net position of 36,673 contracts in the data reported through Tuesday. This was a weekly decrease of -5,299 contracts from the previous week which had a total of 41,972 net contracts.
This week’s current strength score (the trader positioning range over the past three years, measured from 0 to 100) shows the speculators are currently Bearish-Extreme with a score of 7.5 percent. The commercials are Bullish-Extreme with a score of 92.1 percent and the small traders (not shown in chart) are Bullish with a score of 61.0 percent.
| Nasdaq Mini Futures Statistics | SPECULATORS | COMMERCIALS | SMALL TRADERS |
| – Percent of Open Interest Longs: | 26.8 | 49.5 | 6.7 |
| – Percent of Open Interest Shorts: | 15.8 | 63.0 | 4.2 |
| – Net Position: | 36,673 | -44,943 | 8,270 |
| – Gross Longs: | 89,012 | 164,340 | 22,351 |
| – Gross Shorts: | 52,339 | 209,283 | 14,081 |
| – Long to Short Ratio: | 1.7 to 1 | 0.8 to 1 | 1.6 to 1 |
| NET POSITION TREND: | |||
| – COT Index Score (3 Year Range Pct): | 7.5 | 92.1 | 61.0 |
| – COT Index Reading (3 Year Range): | Bearish-Extreme | Bullish-Extreme | Bullish |
| NET POSITION MOVEMENT INDEX: | |||
| – 6-Week Change in Strength Index: | -3.2 | 5.9 | -16.3 |
#2 Heating Oil NY-Harbor Futures:
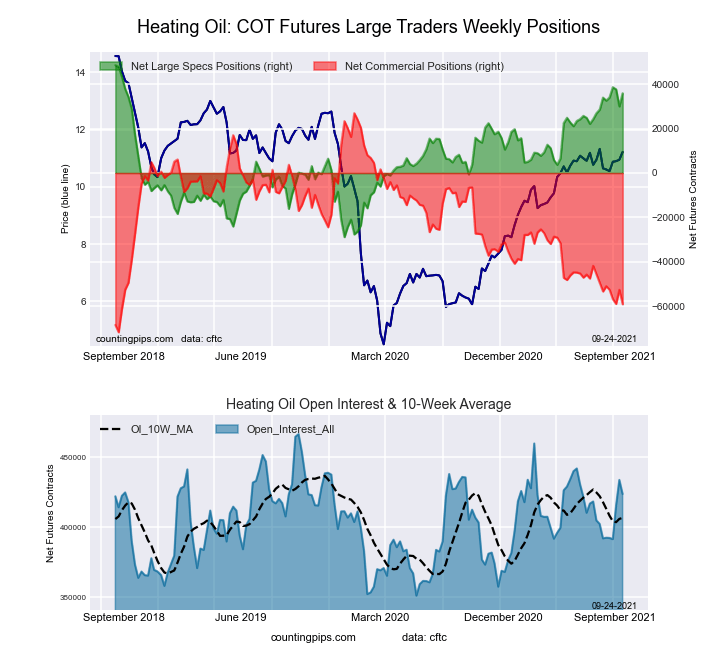 The #2 Heating Oil NY-Harbor Futures large speculator standing this week totaled a net position of 35,890 contracts in the data reported through Tuesday. This was a weekly gain of 5,899 contracts from the previous week which had a total of 29,991 net contracts.
This week’s current strength score (the trader positioning range over the past three years, measured from 0 to 100) shows the speculators are currently Bullish-Extreme with a score of 83.7 percent. The commercials are Bearish-Extreme with a score of 12.8 percent and the small traders (not shown in chart) are Bullish-Extreme with a score of 91.2 percent.
| Heating Oil Futures Statistics | SPECULATORS | COMMERCIALS | SMALL TRADERS |
| – Percent of Open Interest Longs: | 17.9 | 47.7 | 10.8 |
| – Percent of Open Interest Shorts: | 9.4 | 61.6 | 5.3 |
| – Net Position: | 35,890 | -59,051 | 23,161 |
| – Gross Longs: | 75,893 | 201,980 | 45,668 |
| – Gross Shorts: | 40,003 | 261,031 | 22,507 |
| – Long to Short Ratio: | 1.9 to 1 | 0.8 to 1 | 2.0 to 1 |
| NET POSITION TREND: | |||
| – COT Index Score (3 Year Range Pct): | 83.7 | 12.8 | 91.2 |
| – COT Index Reading (3 Year Range): | Bullish-Extreme | Bearish-Extreme | Bullish-Extreme |
| NET POSITION MOVEMENT INDEX: | |||
| – 6-Week Change in Strength Index: | 2.6 | -5.8 | 15.2 |
Bloomberg Commodity Index Futures:
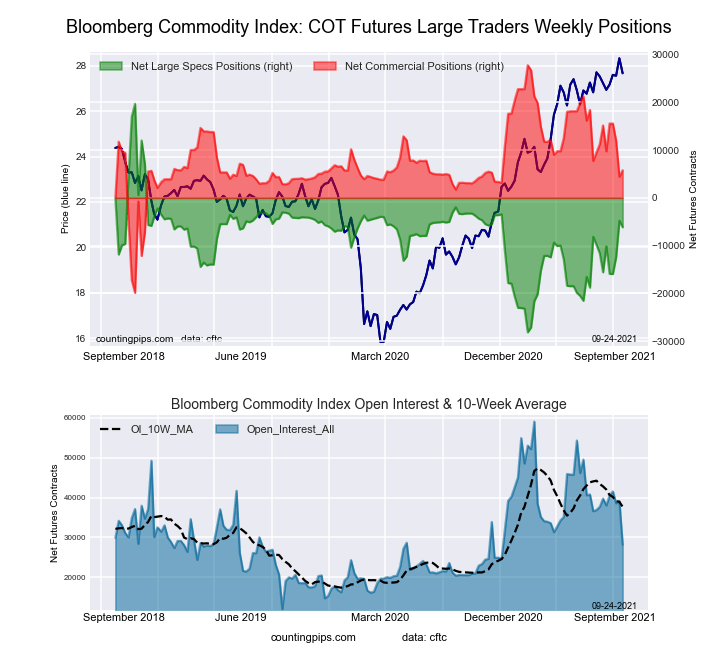 The Bloomberg Commodity Index Futures large speculator standing this week totaled a net position of -6,148 contracts in the data reported through Tuesday. This was a weekly lowering of -1,370 contracts from the previous week which had a total of -4,778 net contracts.
This week’s current strength score (the trader positioning range over the past three years, measured from 0 to 100) shows the speculators are currently Bearish with a score of 46.0 percent. The commercials are Bullish with a score of 53.8 percent and the small traders (not shown in chart) are Bearish with a score of 40.7 percent.
| Bloomberg Index Futures Statistics | SPECULATORS | COMMERCIALS | SMALL TRADERS |
| – Percent of Open Interest Longs: | 64.6 | 27.7 | 1.5 |
| – Percent of Open Interest Shorts: | 86.5 | 7.2 | 0.2 |
| – Net Position: | -6,148 | 5,775 | 373 |
| – Gross Longs: | 18,190 | 7,791 | 435 |
| – Gross Shorts: | 24,338 | 2,016 | 62 |
| – Long to Short Ratio: | 0.7 to 1 | 3.9 to 1 | 7.0 to 1 |
| NET POSITION TREND: | |||
| – COT Index Score (3 Year Range Pct): | 46.0 | 53.8 | 40.7 |
| – COT Index Reading (3 Year Range): | Bearish | Bullish | Bearish |
| NET POSITION MOVEMENT INDEX: | |||
| – 6-Week Change in Strength Index: | 19.7 | -19.7 | -1.3 |
Article By InvestMacro.com – Receive our weekly COT Reports by Email
*COT Report: The COT data, released weekly to the public each Friday, is updated through the most recent Tuesday (data is 3 days old) and shows a quick view of how large speculators or non-commercials (for-profit traders) were positioned in the futures markets.
The CFTC categorizes trader positions according to commercial hedgers (traders who use futures contracts for hedging as part of the business), non-commercials (large traders who speculate to realize trading profits) and nonreportable traders (usually small traders/speculators).
Find CFTC criteria here: (http://www.cftc.gov/MarketReports/CommitmentsofTraders/ExplanatoryNotes/index.htm).

- Gold (XAU/USD) Faces Persistent Selling Pressure Jun 10, 2026
- The US technology sector once again came under a wave of selling Jun 10, 2026
- China has shifted to using its own strategic oil reserves Jun 9, 2026
- GBP/USD Remains Under Pressure Despite Attempts to Recover Jun 9, 2026
- SpaceX IPO: Set for $75 billion liftoff Jun 8, 2026
- On Friday, the American stock market experienced one of the strongest crashes in recent times Jun 8, 2026
- EUR/USD at April Lows: What’s Next for the Pair? Jun 8, 2026
- The ceasefire between Israel and Lebanon has reduced the geopolitical premium Jun 5, 2026
- EUR/USD: All Eyes on Non-Farm Payrolls Jun 5, 2026
- The escalation of the conflict in the Middle East put pressure on US and European stock indices Jun 4, 2026