Article By RoboForex.com
EURUSD, “Euro vs US Dollar”
As we can see in the H4 chart, the asset has formed several reversal patterns, including Harami, not far from the resistance level. At the moment, EURUSD may reverse and start a new pullback. In this case, the correctional target may be at 1.1815. Later, the market may rebound from the support area and resume trading upwards. However, an alternative scenario implies that the price may continue growing to reach 1.1885 without correcting towards the support area.


USDJPY, “US Dollar vs Japanese Yen”
As we can see in the H4 chart, USDJPY has formed a Long-Legged Doji pattern during the pullback. At the moment, USDJPY is reversing and may start a new growth towards 110.55. At the same time, an opposite scenario implies that the price may correct to reach 109.75 before resuming its ascending tendency.
Free Reports:
 Get our Weekly Commitment of Traders Reports - See where the biggest traders (Hedge Funds and Commercial Hedgers) are positioned in the futures markets on a weekly basis.
 Sign Up for Our Stock Market Newsletter – Get updated on News, Charts & Rankings of Public Companies when you join our Stocks Newsletter


EURGBP, “Euro vs Great Britain Pound”
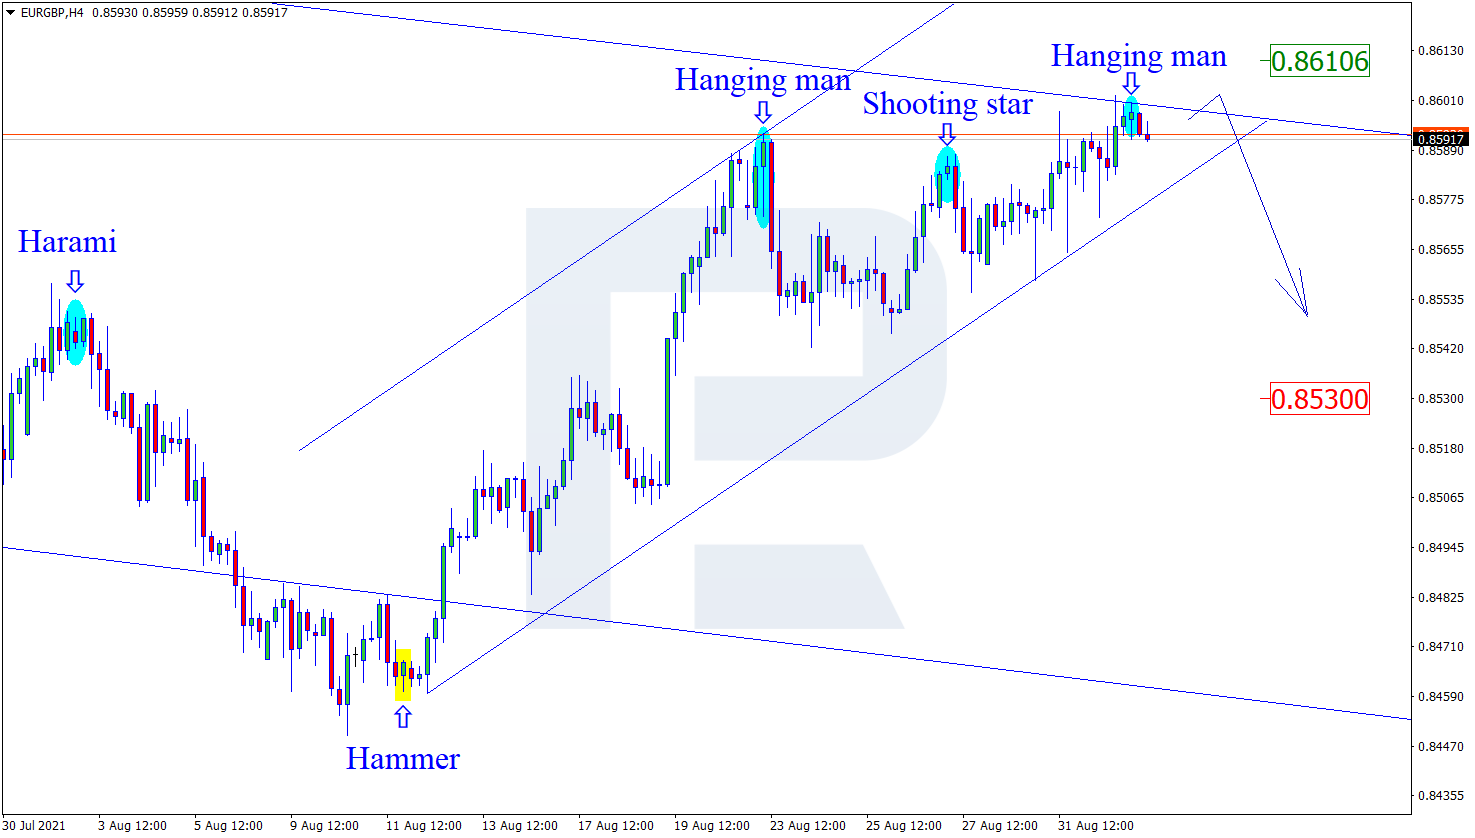
As we can see in the H4 chart, after forming several reversal patterns, for example, Hanging Man, near the resistance area, EURGBP is reversing in the form of a new decline towards the support level. In this case, the downside target may be at 0.8530. Later, the market may break the support level and continue its descending tendency. Still, there might be an alternative scenario, according to which the asset may correct towards 0.8610 before further decline.

Article By RoboForex.com
Attention!
Forecasts presented in this section only reflect the author’s private opinion and should not be considered as guidance for trading. RoboForex LP bears no responsibility for trading results based on trading recommendations described in these analytical reviews.

- Fast fashion may seem cheap, but it’s taking a costly toll on the planet − and on millions of young customers Nov 25, 2024
- “Trump trades” and geopolitics are the key factors driving market activity Nov 25, 2024
- EUR/USD Amid Slowing European Economy Nov 25, 2024
- COT Metals Charts: Weekly Speculator Changes led by Platinum Nov 23, 2024
- COT Bonds Charts: Speculator Bets led lower by 5-Year & 10-Year Bonds Nov 23, 2024
- COT Soft Commodities Charts: Speculator Bets led lower by Soybean Oil, Soybean Meal & Cotton Nov 23, 2024
- COT Stock Market Charts: Speculator Changes led by S&P500 & Nasdaq Minis Nov 23, 2024
- Bitcoin price is approaching 100,000. Natural gas prices rise due to declining inventories and cold weather Nov 22, 2024
- USD/JPY Awaits Potential Stimulus Impact Nov 22, 2024
- RBNZ may cut the rate by 0.75% next week. NVDA report did not meet investors’ expectations Nov 21, 2024
