
By CountingPips.com COT Home | Data Tables | Data Downloads | Newsletter
Here are the latest charts and statistics for the Commitment of Traders (COT) data published by the Commodities Futures Trading Commission (CFTC).
The latest COT data is updated through Tuesday August 24 2021 and shows a quick view of how large traders (for-profit speculators and commercial entities) were positioned in the futures markets.
Gold Comex Futures:
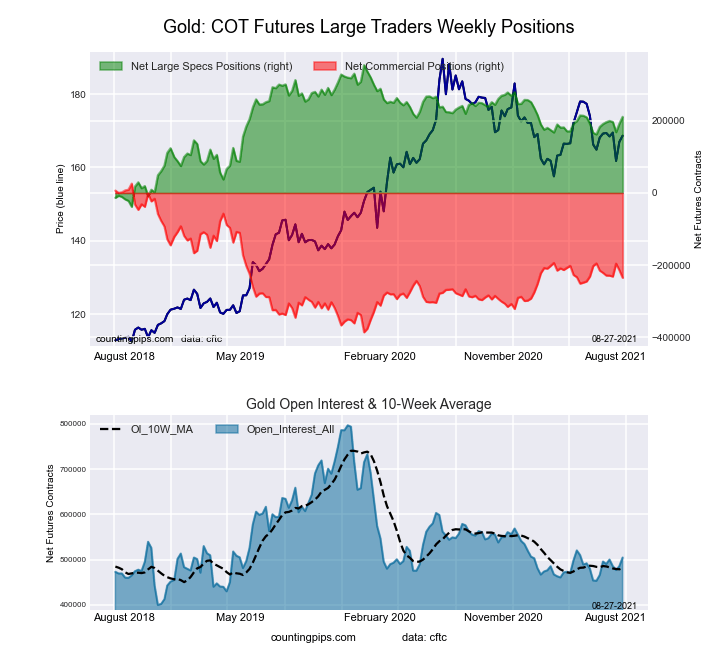 The Gold Comex Futures large speculator standing this week reached a net position of 210,653 contracts in the data reported through Tuesday. This was a weekly increase of 19,111 contracts from the previous week which had a total of 191,542 net contracts.
This week’s current strength score (the trader positioning range over the past three years, measured from 0 to 100) shows the speculators are currently Bullish with a score of 63.5 percent. The commercials are Bearish with a score of 36.7 percent and the small traders (not shown in chart) are Bearish with a score of 41.7 percent.
| Gold Futures Statistics | SPECULATORS | COMMERCIALS | SMALL TRADERS |
| – Percent of Open Interest Longs: | 59.3 | 24.4 | 8.8 |
| – Percent of Open Interest Shorts: | 17.5 | 70.9 | 4.1 |
| – Net Position: | 210,653 | -234,678 | 24,025 |
| – Gross Longs: | 299,084 | 123,101 | 44,517 |
| – Gross Shorts: | 88,431 | 357,779 | 20,492 |
| – Long to Short Ratio: | 3.4 to 1 | 0.3 to 1 | 2.2 to 1 |
| NET POSITION TREND: | |||
| – COT Index Score (3 Year Range Pct): | 63.5 | 36.7 | 41.7 |
| – COT Index Reading (3 Year Range): | Bullish | Bearish | Bearish |
| NET POSITION MOVEMENT INDEX: | |||
| – 6-Week Change in Strength Index: | 5.1 | -3.3 | -15.1 |
Free Reports:
 Sign Up for Our Stock Market Newsletter – Get updated on News, Charts & Rankings of Public Companies when you join our Stocks Newsletter
 Get our Weekly Commitment of Traders Reports - See where the biggest traders (Hedge Funds and Commercial Hedgers) are positioned in the futures markets on a weekly basis.
Silver Comex Futures:
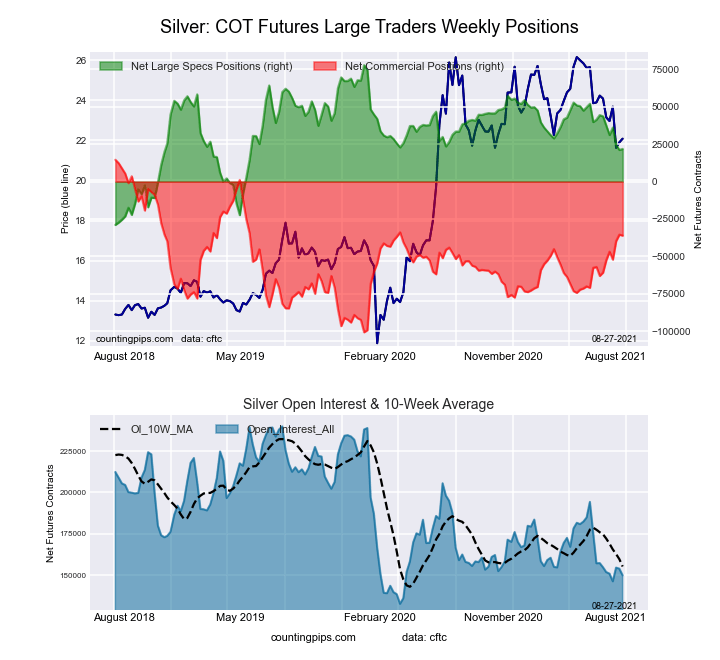 The Silver Comex Futures large speculator standing this week reached a net position of 21,861 contracts in the data reported through Tuesday. This was a weekly gain of 641 contracts from the previous week which had a total of 21,220 net contracts.
This week’s current strength score (the trader positioning range over the past three years, measured from 0 to 100) shows the speculators are currently Bearish with a score of 47.6 percent. The commercials are Bullish with a score of 56.0 percent and the small traders (not shown in chart) are Bearish with a score of 23.2 percent.
| Silver Futures Statistics | SPECULATORS | COMMERCIALS | SMALL TRADERS |
| – Percent of Open Interest Longs: | 42.3 | 33.8 | 17.7 |
| – Percent of Open Interest Shorts: | 27.7 | 57.9 | 8.2 |
| – Net Position: | 21,861 | -36,126 | 14,265 |
| – Gross Longs: | 63,311 | 50,674 | 26,586 |
| – Gross Shorts: | 41,450 | 86,800 | 12,321 |
| – Long to Short Ratio: | 1.5 to 1 | 0.6 to 1 | 2.2 to 1 |
| NET POSITION TREND: | |||
| – COT Index Score (3 Year Range Pct): | 47.6 | 56.0 | 23.2 |
| – COT Index Reading (3 Year Range): | Bearish | Bullish | Bearish |
| NET POSITION MOVEMENT INDEX: | |||
| – 6-Week Change in Strength Index: | -20.4 | 21.4 | -17.6 |
Copper Grade #1 Futures:
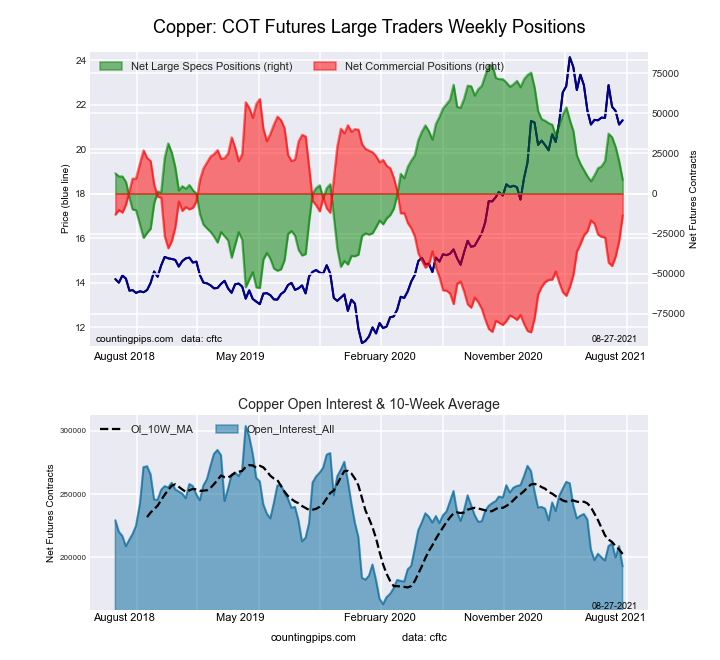 The Copper Grade #1 Futures large speculator standing this week reached a net position of 8,624 contracts in the data reported through Tuesday. This was a weekly fall of -11,456 contracts from the previous week which had a total of 20,080 net contracts.
This week’s current strength score (the trader positioning range over the past three years, measured from 0 to 100) shows the speculators are currently Bearish with a score of 48.6 percent. The commercials are Bullish with a score of 50.1 percent and the small traders (not shown in chart) are Bullish with a score of 54.1 percent.
| Copper Futures Statistics | SPECULATORS | COMMERCIALS | SMALL TRADERS |
| – Percent of Open Interest Longs: | 38.3 | 44.3 | 8.3 |
| – Percent of Open Interest Shorts: | 33.8 | 51.4 | 5.7 |
| – Net Position: | 8,624 | -13,610 | 4,986 |
| – Gross Longs: | 73,890 | 85,537 | 15,941 |
| – Gross Shorts: | 65,266 | 99,147 | 10,955 |
| – Long to Short Ratio: | 1.1 to 1 | 0.9 to 1 | 1.5 to 1 |
| NET POSITION TREND: | |||
| – COT Index Score (3 Year Range Pct): | 48.6 | 50.1 | 54.1 |
| – COT Index Reading (3 Year Range): | Bearish | Bullish | Bullish |
| NET POSITION MOVEMENT INDEX: | |||
| – 6-Week Change in Strength Index: | -6.0 | 9.2 | -29.0 |
Platinum Futures:
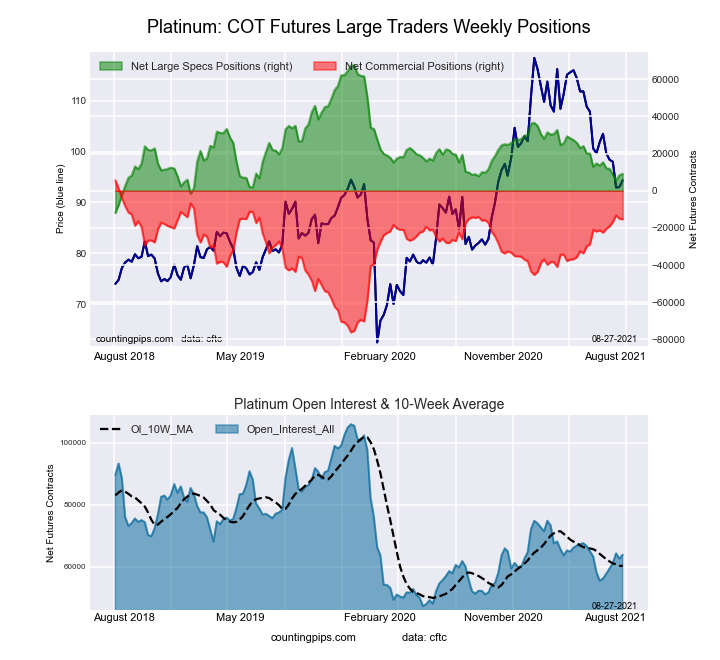 The Platinum Futures large speculator standing this week reached a net position of 9,143 contracts in the data reported through Tuesday. This was a weekly rise of 785 contracts from the previous week which had a total of 8,358 net contracts.
This week’s current strength score (the trader positioning range over the past three years, measured from 0 to 100) shows the speculators are currently Bearish with a score of 26.5 percent. The commercials are Bullish with a score of 74.3 percent and the small traders (not shown in chart) are Bearish with a score of 48.1 percent.
| Platinum Futures Statistics | SPECULATORS | COMMERCIALS | SMALL TRADERS |
| – Percent of Open Interest Longs: | 51.8 | 30.4 | 15.3 |
| – Percent of Open Interest Shorts: | 37.4 | 54.4 | 5.7 |
| – Net Position: | 9,143 | -15,311 | 6,168 |
| – Gross Longs: | 33,042 | 19,382 | 9,778 |
| – Gross Shorts: | 23,899 | 34,693 | 3,610 |
| – Long to Short Ratio: | 1.4 to 1 | 0.6 to 1 | 2.7 to 1 |
| NET POSITION TREND: | |||
| – COT Index Score (3 Year Range Pct): | 26.5 | 74.3 | 48.1 |
| – COT Index Reading (3 Year Range): | Bearish | Bullish | Bearish |
| NET POSITION MOVEMENT INDEX: | |||
| – 6-Week Change in Strength Index: | -7.8 | 8.8 | -13.5 |
Palladium Futures:
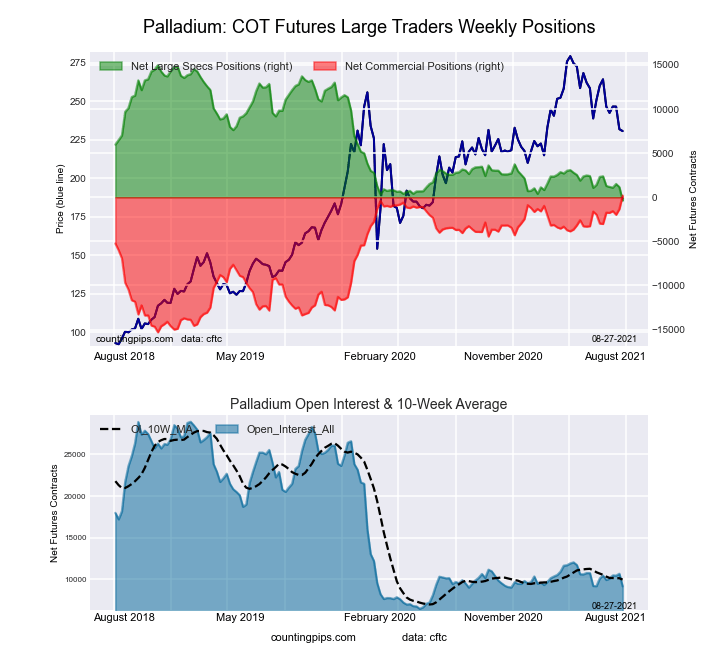 The Palladium Futures large speculator standing this week reached a net position of -366 contracts in the data reported through Tuesday. This was a weekly fall of -1,517 contracts from the previous week which had a total of 1,151 net contracts.
This week’s current strength score (the trader positioning range over the past three years, measured from 0 to 100) shows the speculators are currently Bearish-Extreme with a score of 0.0 percent. The commercials are Bullish-Extreme with a score of 100.0 percent and the small traders (not shown in chart) are Bullish with a score of 54.8 percent.
| Palladium Futures Statistics | SPECULATORS | COMMERCIALS | SMALL TRADERS |
| – Percent of Open Interest Longs: | 33.5 | 48.9 | 15.8 |
| – Percent of Open Interest Shorts: | 37.5 | 46.8 | 13.9 |
| – Net Position: | -366 | 194 | 172 |
| – Gross Longs: | 3,076 | 4,490 | 1,447 |
| – Gross Shorts: | 3,442 | 4,296 | 1,275 |
| – Long to Short Ratio: | 0.9 to 1 | 1.0 to 1 | 1.1 to 1 |
| NET POSITION TREND: | |||
| – COT Index Score (3 Year Range Pct): | 0.0 | 100.0 | 54.8 |
| – COT Index Reading (3 Year Range): | Bearish-Extreme | Bullish-Extreme | Bullish |
| NET POSITION MOVEMENT INDEX: | |||
| – 6-Week Change in Strength Index: | -17.9 | 20.8 | -27.7 |
Article By CountingPips.com – Receive our weekly COT Reports by Email
*COT Report: The COT data, released weekly to the public each Friday, is updated through the most recent Tuesday (data is 3 days old) and shows a quick view of how large speculators or non-commercials (for-profit traders) were positioned in the futures markets.
The CFTC categorizes trader positions according to commercial hedgers (traders who use futures contracts for hedging as part of the business), non-commercials (large traders who speculate to realize trading profits) and nonreportable traders (usually small traders/speculators).
Find CFTC criteria here: (http://www.cftc.gov/MarketReports/CommitmentsofTraders/ExplanatoryNotes/index.htm).

- China has shifted to using its own strategic oil reserves Jun 9, 2026
- GBP/USD Remains Under Pressure Despite Attempts to Recover Jun 9, 2026
- SpaceX IPO: Set for $75 billion liftoff Jun 8, 2026
- On Friday, the American stock market experienced one of the strongest crashes in recent times Jun 8, 2026
- EUR/USD at April Lows: What’s Next for the Pair? Jun 8, 2026
- The ceasefire between Israel and Lebanon has reduced the geopolitical premium Jun 5, 2026
- EUR/USD: All Eyes on Non-Farm Payrolls Jun 5, 2026
- The escalation of the conflict in the Middle East put pressure on US and European stock indices Jun 4, 2026
- Gold Remains Under Pressure, but a Rebound Is Still Possible Jun 4, 2026
- Bitcoin drops below the psychological $70,000 level. The US stock indices hit new record highs Jun 3, 2026