The weakness of the US economy increases pressure on its main benchmarks, such as the New Zealand dollar.
Last Thursday, two negative reports were published which depreciated the US dollar. These reports were on the number of unemployment claims, at 5% higher than expected by the market, and the GDP for the second quarter, which remained at 6.5% compared to a forecast of 8.5%.
In addition, the worsening coronavirus situation in the country attracts negative sentiment towards the USD, and detracts from the potential for the country’s recovery.
This contrasts with the situation in New Zealand, which, while the country is virtually coronavirus-free, strict security measures for passenger and merchandise entry into the country are affecting its fundamental.
Free Reports:
 Sign Up for Our Stock Market Newsletter – Get updated on News, Charts & Rankings of Public Companies when you join our Stocks Newsletter
 Get our Weekly Commitment of Traders Reports - See where the biggest traders (Hedge Funds and Commercial Hedgers) are positioned in the futures markets on a weekly basis.
In recent hours, the government has decreed the effective suspension of the air travel bubble with Australia following the resurgence that has occurred in the neighbouring country.
All eyes are on the quarterly report on the evolution of employment in New Zealand that will be published next Wednesday, August 4.
This report could increase pressure on the Reserve Bank of New Zealand (RBNZ) to carry out a possible interest rate hike which some analysts had expected to have occurred in its last announcement in mid-July.

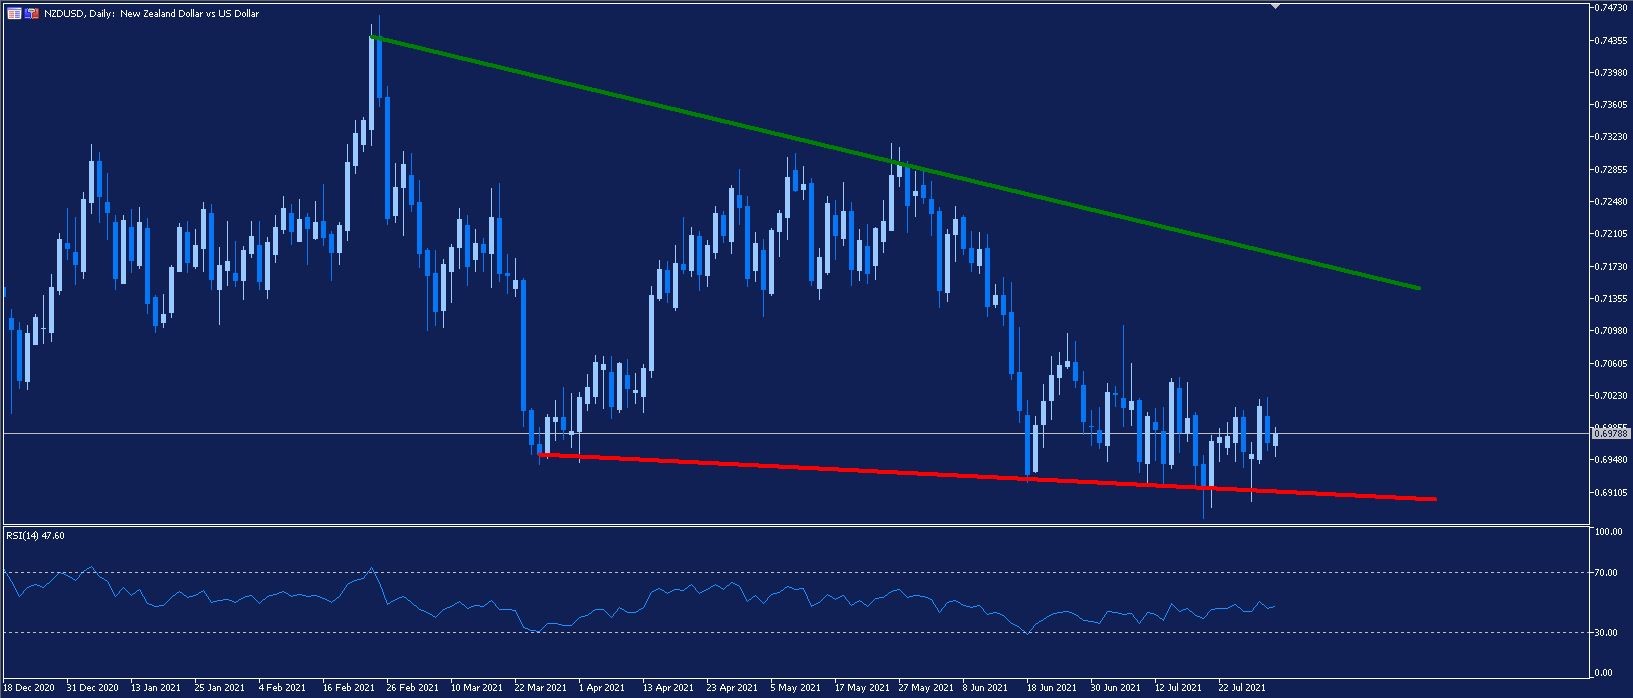
Source: Admirals MetaTrader 5, NZDUSD, daily – Data range: from 18 December 2020 to 2 August 2021, conducted on 2 August 2021 at 9:30 am CET. Please note: Past performance is not a reliable indicator of future results.
On NZD/USD daily chart above, it can clearly be seen that since the end of February, the pair has formed a wedge pattern with a downtrend.
This pattern is characterized by the fact that both the support and the resistance of this figure are marking increasingly lower levels. However, the fall in resistance is higher than that of the support, with both reference levels tending to converge.
Since June 18, the pair has been very close to the support level, and fails to recover positions. On that day, the overselling recorded in the RSI indicator served as a reference for traders to close their sell positions.
There have been some subsequent bearish attacks and they have even managed to overcome this support in a timely manner, but without consolidating and quickly returning to the original figure.
At the moment, the pair is looking for a new direction, so it would be interesting to monitor the support of this wedge located close to 0.691 USD per New Zealand dollar.
If it manages to stay above this level for several days, it is possible that buyers will re-enter the pair looking for the top of this bearish wedge, located close to 0.715 USD per New Zealand dollar.
Did you know that you have at your disposal the Technical Ideas Lookup tool from Trading Central to find trading ideas on the NZD/USD and on thousands of different instruments?
Start the free download by clicking on the following banner:
INFORMATION ABOUT ANALYTICAL MATERIALS:
The given data provides additional information regarding all analysis, estimates, prognosis, forecasts, market reviews, weekly outlooks or other similar assessments or information (hereinafter “Analysis”) published on the websites of Admiral Markets investment firms operating under the Admiral Markets trademark (hereinafter “Admiral Markets”) Before making any investment decisions please pay close attention to the following:
- This is a marketing communication. The content is published for informative purposes only and is in no way to be construed as investment advice or recommendation. It has not been prepared in accordance with legal requirements designed to promote the independence of investment research, and that it is not subject to any prohibition on dealing ahead of the dissemination of investment research.
- Any investment decision is made by each client alone whereas Admiral Markets shall not be responsible for any loss or damage arising from any such decision, whether or not based on the content.
- With view to protecting the interests of our clients and the objectivity of the Analysis, Admiral Markets has established relevant internal procedures for prevention and management of conflicts of interest.
- The Analysis is prepared by an independent analyst, Javier Olivan (analyst), (hereinafter “Author”) based on their personal estimations.
- Whilst every reasonable effort is taken to ensure that all sources of the content are reliable and that all information is presented, as much as possible, in an understandable, timely, precise and complete manner, Admiral Markets does not guarantee the accuracy or completeness of any information contained within the Analysis.
- Any kind of past or modeled performance of financial instruments indicated within the content should not be construed as an express or implied promise, guarantee or implication by Admiral Markets for any future performance. The value of the financial instrument may both increase and decrease and the preservation of the asset value is not guaranteed.
Leveraged products (including contracts for difference) are speculative in nature and may result in losses or profit. Before you start trading, please ensure that you fully understand the risks involved.

- NZD/USD Hits Yearly Low Amid US Dollar Strength Nov 26, 2024
- Trump plans to raise tariffs by 10% on goods from China and 25% on goods from Mexico and Canada Nov 26, 2024
- Fast fashion may seem cheap, but it’s taking a costly toll on the planet − and on millions of young customers Nov 25, 2024
- “Trump trades” and geopolitics are the key factors driving market activity Nov 25, 2024
- EUR/USD Amid Slowing European Economy Nov 25, 2024
- COT Metals Charts: Weekly Speculator Changes led by Platinum Nov 23, 2024
- COT Bonds Charts: Speculator Bets led lower by 5-Year & 10-Year Bonds Nov 23, 2024
- COT Soft Commodities Charts: Speculator Bets led lower by Soybean Oil, Soybean Meal & Cotton Nov 23, 2024
- COT Stock Market Charts: Speculator Changes led by S&P500 & Nasdaq Minis Nov 23, 2024
- Bitcoin price is approaching 100,000. Natural gas prices rise due to declining inventories and cold weather Nov 22, 2024

