
By CountingPips.com COT Home | Data Tables | Data Downloads | Newsletter
Here are the latest charts and statistics for the Commitment of Traders (COT) data published by the Commodities Futures Trading Commission (CFTC).
The latest COT data is updated through Tuesday July 13 2021 and shows a quick view of how large traders (for-profit speculators and commercial entities) were positioned in the futures markets.
CORN Futures:
 The CORN large speculator standing this week was a net position of 312,979 contracts in the data reported through Tuesday. This was a weekly decline of -13,835 contracts from the previous week which had a total of 326,814 net contracts.
This week’s current strength score (the trader positioning range over the past three years, measured from 0 to 100) shows the speculators are currently Bullish with a score of 70.0 percent. The commercials are Bearish with a score of 35.6 percent and the small traders (not shown in chart) are Bearish-Extreme with a score of 2.7 percent.
| CORN Futures Statistics | SPECULATORS | COMMERCIALS | SMALL TRADERS |
| – Percent of Open Interest Longs: | 27.3 | 48.7 | 8.6 |
| – Percent of Open Interest Shorts: | 6.3 | 65.7 | 12.5 |
| – Net Position: | 312,979 | -254,581 | -58,398 |
| – Gross Longs: | 407,517 | 727,476 | 128,163 |
| – Gross Shorts: | 94,538 | 982,057 | 186,561 |
| – Long to Short Ratio: | 4.3 to 1 | 0.7 to 1 | 0.7 to 1 |
| NET POSITION TREND: | |||
| – COT Index Score (3 Year Range Pct): | 70.0 | 35.6 | 2.7 |
| – COT Index Reading (3 Year Range): | Bullish | Bearish | Bearish-Extreme |
| NET POSITION MOVEMENT INDEX: | |||
| – 6-Week Change in Strength Index: | -17.8 | 21.4 | -6.9 |
Free Reports:
 Get our Weekly Commitment of Traders Reports - See where the biggest traders (Hedge Funds and Commercial Hedgers) are positioned in the futures markets on a weekly basis.
 Download Our Metatrader 4 Indicators – Put Our Free MetaTrader 4 Custom Indicators on your charts when you join our Weekly Newsletter
SUGAR Futures:
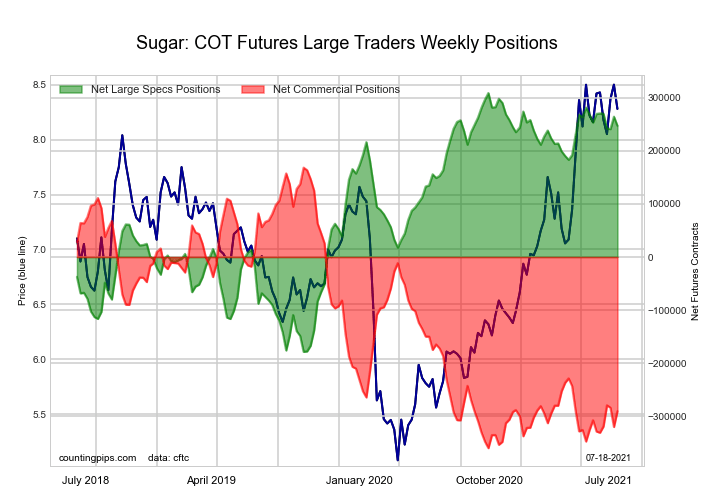 The SUGAR large speculator standing this week was a net position of 246,981 contracts in the data reported through Tuesday. This was a weekly decrease of -17,024 contracts from the previous week which had a total of 264,005 net contracts.
This week’s current strength score (the trader positioning range over the past three years, measured from 0 to 100) shows the speculators are currently Bullish-Extreme with a score of 87.4 percent. The commercials are Bearish-Extreme with a score of 13.2 percent and the small traders (not shown in chart) are Bullish with a score of 61.1 percent.
| SUGAR Futures Statistics | SPECULATORS | COMMERCIALS | SMALL TRADERS |
| – Percent of Open Interest Longs: | 31.4 | 44.6 | 8.7 |
| – Percent of Open Interest Shorts: | 4.8 | 75.9 | 4.1 |
| – Net Position: | 246,981 | -290,070 | 43,089 |
| – Gross Longs: | 291,348 | 414,260 | 80,869 |
| – Gross Shorts: | 44,367 | 704,330 | 37,780 |
| – Long to Short Ratio: | 6.6 to 1 | 0.6 to 1 | 2.1 to 1 |
| NET POSITION TREND: | |||
| – COT Index Score (3 Year Range Pct): | 87.4 | 13.2 | 61.1 |
| – COT Index Reading (3 Year Range): | Bullish-Extreme | Bearish-Extreme | Bullish |
| NET POSITION MOVEMENT INDEX: | |||
| – 6-Week Change in Strength Index: | -4.6 | 7.2 | -19.7 |
COFFEE Futures:
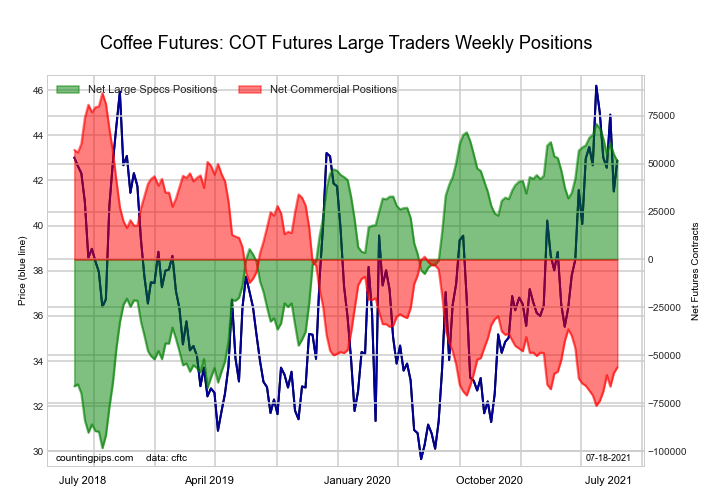 The COFFEE large speculator standing this week was a net position of 51,225 contracts in the data reported through Tuesday. This was a weekly decline of -3,756 contracts from the previous week which had a total of 54,981 net contracts.
This week’s current strength score (the trader positioning range over the past three years, measured from 0 to 100) shows the speculators are currently Bullish-Extreme with a score of 88.5 percent. The commercials are Bearish-Extreme with a score of 12.3 percent and the small traders (not shown in chart) are Bearish with a score of 23.3 percent.
| COFFEE Futures Statistics | SPECULATORS | COMMERCIALS | SMALL TRADERS |
| – Percent of Open Interest Longs: | 28.6 | 50.0 | 4.2 |
| – Percent of Open Interest Shorts: | 10.1 | 70.4 | 2.4 |
| – Net Position: | 51,225 | -56,273 | 5,048 |
| – Gross Longs: | 79,105 | 138,178 | 11,695 |
| – Gross Shorts: | 27,880 | 194,451 | 6,647 |
| – Long to Short Ratio: | 2.8 to 1 | 0.7 to 1 | 1.8 to 1 |
| NET POSITION TREND: | |||
| – COT Index Score (3 Year Range Pct): | 88.5 | 12.3 | 23.3 |
| – COT Index Reading (3 Year Range): | Bullish-Extreme | Bearish-Extreme | Bearish |
| NET POSITION MOVEMENT INDEX: | |||
| – 6-Week Change in Strength Index: | -11.5 | 12.3 | -3.4 |
SOYBEANS Futures:
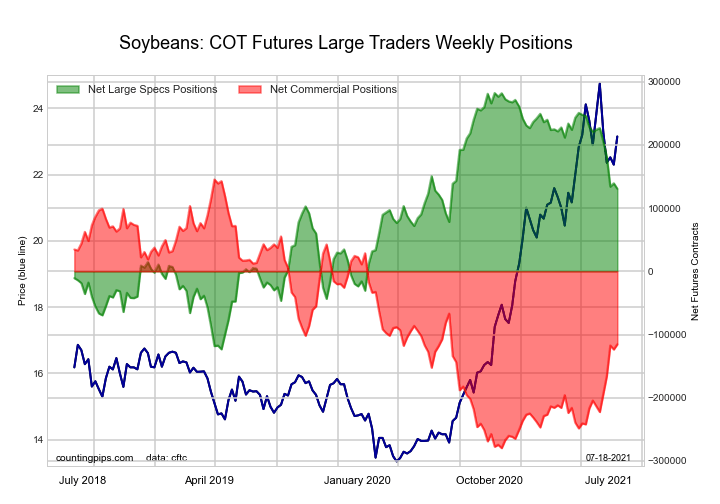 The SOYBEANS large speculator standing this week was a net position of 130,640 contracts in the data reported through Tuesday. This was a weekly fall of -8,624 contracts from the previous week which had a total of 139,264 net contracts.
This week’s current strength score (the trader positioning range over the past three years, measured from 0 to 100) shows the speculators are currently Bullish with a score of 62.7 percent. The commercials are Bearish with a score of 38.6 percent and the small traders (not shown in chart) are Bearish with a score of 46.7 percent.
| SOYBEANS Futures Statistics | SPECULATORS | COMMERCIALS | SMALL TRADERS |
| – Percent of Open Interest Longs: | 28.5 | 48.1 | 7.3 |
| – Percent of Open Interest Shorts: | 9.3 | 65.1 | 9.5 |
| – Net Position: | 130,640 | -115,525 | -15,115 |
| – Gross Longs: | 194,306 | 328,362 | 49,591 |
| – Gross Shorts: | 63,666 | 443,887 | 64,706 |
| – Long to Short Ratio: | 3.1 to 1 | 0.7 to 1 | 0.8 to 1 |
| NET POSITION TREND: | |||
| – COT Index Score (3 Year Range Pct): | 62.7 | 38.6 | 46.7 |
| – COT Index Reading (3 Year Range): | Bullish | Bearish | Bearish |
| NET POSITION MOVEMENT INDEX: | |||
| – 6-Week Change in Strength Index: | -23.0 | 23.0 | -7.5 |
SOYBEAN OIL Futures:
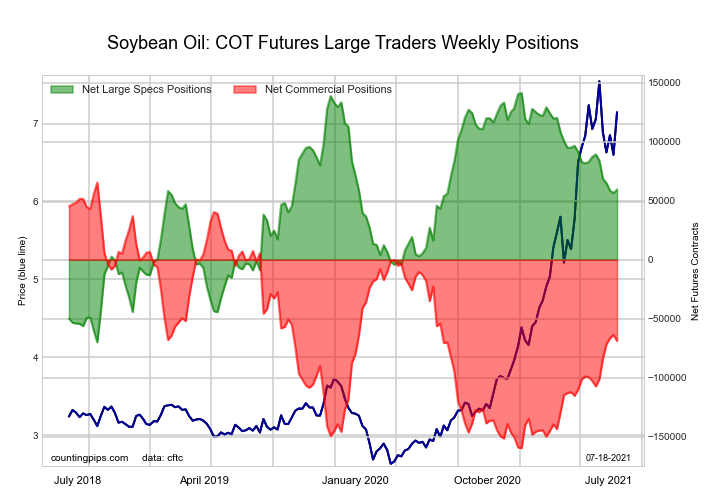 The SOYBEAN OIL large speculator standing this week was a net position of 59,517 contracts in the data reported through Tuesday. This was a weekly advance of 3,102 contracts from the previous week which had a total of 56,415 net contracts.
This week’s current strength score (the trader positioning range over the past three years, measured from 0 to 100) shows the speculators are currently Bullish with a score of 61.3 percent. The commercials are Bearish with a score of 40.4 percent and the small traders (not shown in chart) are Bearish with a score of 47.7 percent.
| SOYBEAN OIL Futures Statistics | SPECULATORS | COMMERCIALS | SMALL TRADERS |
| – Percent of Open Interest Longs: | 19.8 | 50.9 | 7.2 |
| – Percent of Open Interest Shorts: | 7.4 | 65.2 | 5.3 |
| – Net Position: | 59,517 | -68,690 | 9,173 |
| – Gross Longs: | 95,068 | 243,983 | 34,536 |
| – Gross Shorts: | 35,551 | 312,673 | 25,363 |
| – Long to Short Ratio: | 2.7 to 1 | 0.8 to 1 | 1.4 to 1 |
| NET POSITION TREND: | |||
| – COT Index Score (3 Year Range Pct): | 61.3 | 40.4 | 47.7 |
| – COT Index Reading (3 Year Range): | Bullish | Bearish | Bearish |
| NET POSITION MOVEMENT INDEX: | |||
| – 6-Week Change in Strength Index: | -14.1 | 17.1 | -32.9 |
SOYBEAN MEAL Futures:
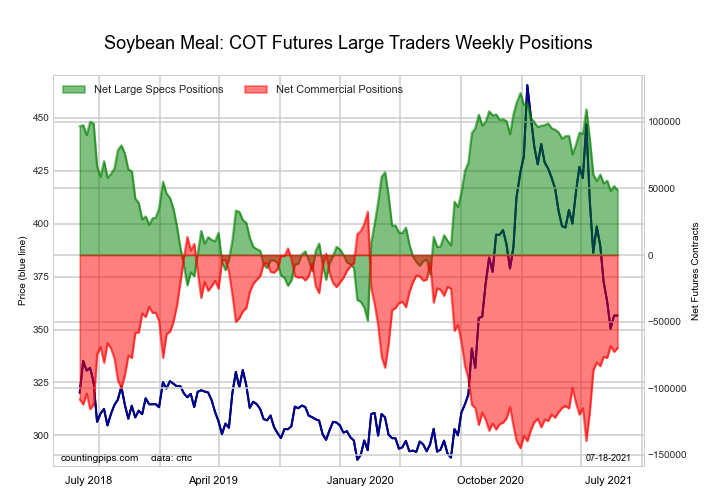 The SOYBEAN MEAL large speculator standing this week was a net position of 48,830 contracts in the data reported through Tuesday. This was a weekly decline of -2,951 contracts from the previous week which had a total of 51,781 net contracts.
This week’s current strength score (the trader positioning range over the past three years, measured from 0 to 100) shows the speculators are currently Bullish with a score of 57.4 percent. The commercials are Bearish with a score of 42.4 percent and the small traders (not shown in chart) are Bullish with a score of 54.5 percent.
| SOYBEAN MEAL Futures Statistics | SPECULATORS | COMMERCIALS | SMALL TRADERS |
| – Percent of Open Interest Longs: | 22.6 | 52.9 | 12.7 |
| – Percent of Open Interest Shorts: | 9.4 | 71.8 | 7.0 |
| – Net Position: | 48,830 | -69,762 | 20,932 |
| – Gross Longs: | 83,364 | 195,406 | 46,883 |
| – Gross Shorts: | 34,534 | 265,168 | 25,951 |
| – Long to Short Ratio: | 2.4 to 1 | 0.7 to 1 | 1.8 to 1 |
| NET POSITION TREND: | |||
| – COT Index Score (3 Year Range Pct): | 57.4 | 42.4 | 54.5 |
| – COT Index Reading (3 Year Range): | Bullish | Bearish | Bullish |
| NET POSITION MOVEMENT INDEX: | |||
| – 6-Week Change in Strength Index: | -3.9 | 6.2 | -16.9 |
LIVE CATTLE Futures:
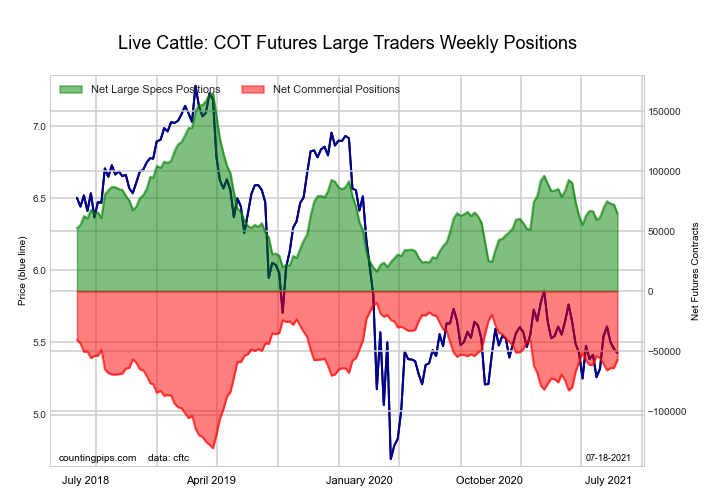 The LIVE CATTLE large speculator standing this week was a net position of 64,657 contracts in the data reported through Tuesday. This was a weekly reduction of -7,469 contracts from the previous week which had a total of 72,126 net contracts.
This week’s current strength score (the trader positioning range over the past three years, measured from 0 to 100) shows the speculators are currently Bearish with a score of 32.4 percent. The commercials are Bullish with a score of 60.9 percent and the small traders (not shown in chart) are Bullish with a score of 68.7 percent.
| LIVE CATTLE Futures Statistics | SPECULATORS | COMMERCIALS | SMALL TRADERS |
| – Percent of Open Interest Longs: | 35.8 | 39.3 | 10.0 |
| – Percent of Open Interest Shorts: | 14.0 | 58.5 | 12.6 |
| – Net Position: | 64,657 | -57,076 | -7,581 |
| – Gross Longs: | 106,260 | 116,738 | 29,798 |
| – Gross Shorts: | 41,603 | 173,814 | 37,379 |
| – Long to Short Ratio: | 2.6 to 1 | 0.7 to 1 | 0.8 to 1 |
| NET POSITION TREND: | |||
| – COT Index Score (3 Year Range Pct): | 32.4 | 60.9 | 68.7 |
| – COT Index Reading (3 Year Range): | Bearish | Bullish | Bullish |
| NET POSITION MOVEMENT INDEX: | |||
| – 6-Week Change in Strength Index: | 3.5 | -2.6 | -4.8 |
LEAN HOGS Futures:
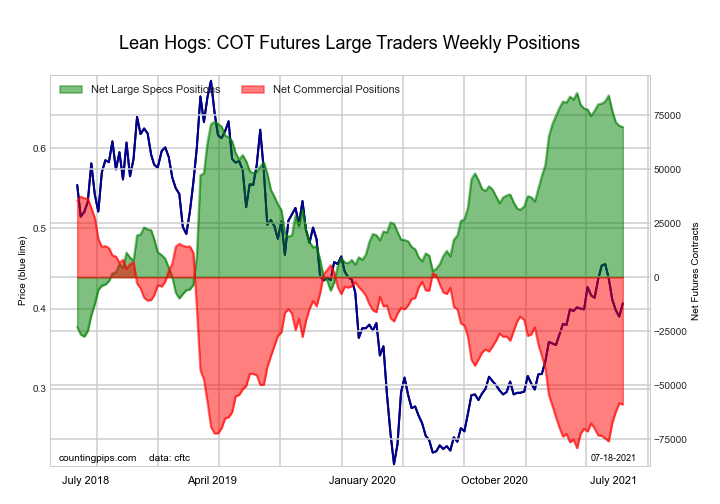 The LEAN HOGS large speculator standing this week was a net position of 69,471 contracts in the data reported through Tuesday. This was a weekly decline of -575 contracts from the previous week which had a total of 70,046 net contracts.
This week’s current strength score (the trader positioning range over the past three years, measured from 0 to 100) shows the speculators are currently Bullish-Extreme with a score of 86.0 percent. The commercials are Bearish-Extreme with a score of 17.4 percent and the small traders (not shown in chart) are Bearish with a score of 27.5 percent.
| LEAN HOGS Futures Statistics | SPECULATORS | COMMERCIALS | SMALL TRADERS |
| – Percent of Open Interest Longs: | 40.9 | 31.9 | 8.4 |
| – Percent of Open Interest Shorts: | 14.3 | 54.4 | 12.4 |
| – Net Position: | 69,471 | -58,875 | -10,596 |
| – Gross Longs: | 107,080 | 83,730 | 21,975 |
| – Gross Shorts: | 37,609 | 142,605 | 32,571 |
| – Long to Short Ratio: | 2.8 to 1 | 0.6 to 1 | 0.7 to 1 |
| NET POSITION TREND: | |||
| – COT Index Score (3 Year Range Pct): | 86.0 | 17.4 | 27.5 |
| – COT Index Reading (3 Year Range): | Bullish-Extreme | Bearish-Extreme | Bearish |
| NET POSITION MOVEMENT INDEX: | |||
| – 6-Week Change in Strength Index: | -9.6 | 12.4 | -17.3 |
COTTON Futures:
 The COTTON large speculator standing this week was a net position of 73,593 contracts in the data reported through Tuesday. This was a weekly increase of 4,055 contracts from the previous week which had a total of 69,538 net contracts.
This week’s current strength score (the trader positioning range over the past three years, measured from 0 to 100) shows the speculators are currently Bullish with a score of 74.8 percent. The commercials are Bearish with a score of 23.0 percent and the small traders (not shown in chart) are Bullish with a score of 76.3 percent.
| COTTON Futures Statistics | SPECULATORS | COMMERCIALS | SMALL TRADERS |
| – Percent of Open Interest Longs: | 38.8 | 42.9 | 7.3 |
| – Percent of Open Interest Shorts: | 6.3 | 79.7 | 2.9 |
| – Net Position: | 73,593 | -83,474 | 9,881 |
| – Gross Longs: | 87,911 | 97,182 | 16,449 |
| – Gross Shorts: | 14,318 | 180,656 | 6,568 |
| – Long to Short Ratio: | 6.1 to 1 | 0.5 to 1 | 2.5 to 1 |
| NET POSITION TREND: | |||
| – COT Index Score (3 Year Range Pct): | 74.8 | 23.0 | 76.3 |
| – COT Index Reading (3 Year Range): | Bullish | Bearish | Bullish |
| NET POSITION MOVEMENT INDEX: | |||
| – 6-Week Change in Strength Index: | 6.4 | -7.4 | 14.1 |
COCOA Futures:
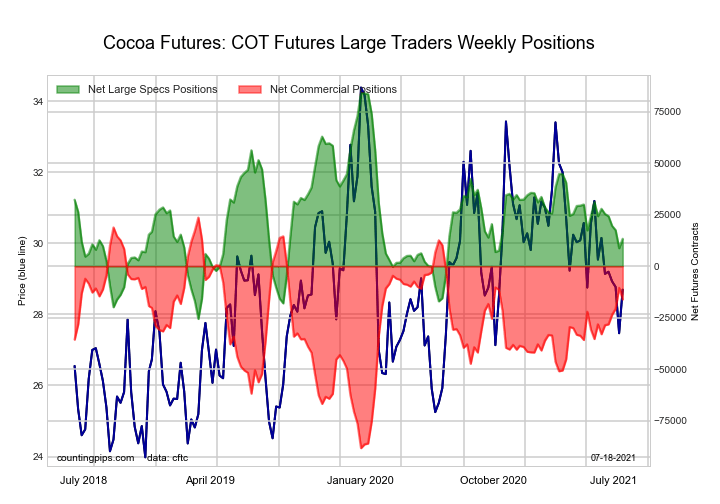 The COCOA large speculator standing this week was a net position of 13,326 contracts in the data reported through Tuesday. This was a weekly rise of 4,559 contracts from the previous week which had a total of 8,767 net contracts.
This week’s current strength score (the trader positioning range over the past three years, measured from 0 to 100) shows the speculators are currently Bearish with a score of 35.5 percent. The commercials are Bullish with a score of 64.5 percent and the small traders (not shown in chart) are Bearish with a score of 39.9 percent.
| COCOA Futures Statistics | SPECULATORS | COMMERCIALS | SMALL TRADERS |
| – Percent of Open Interest Longs: | 27.3 | 48.2 | 4.7 |
| – Percent of Open Interest Shorts: | 22.0 | 54.6 | 3.6 |
| – Net Position: | 13,326 | -16,092 | 2,766 |
| – Gross Longs: | 68,772 | 121,390 | 11,767 |
| – Gross Shorts: | 55,446 | 137,482 | 9,001 |
| – Long to Short Ratio: | 1.2 to 1 | 0.9 to 1 | 1.3 to 1 |
| NET POSITION TREND: | |||
| – COT Index Score (3 Year Range Pct): | 35.5 | 64.5 | 39.9 |
| – COT Index Reading (3 Year Range): | Bearish | Bullish | Bearish |
| NET POSITION MOVEMENT INDEX: | |||
| – 6-Week Change in Strength Index: | -13.3 | 15.1 | -26.6 |
WHEAT Futures:
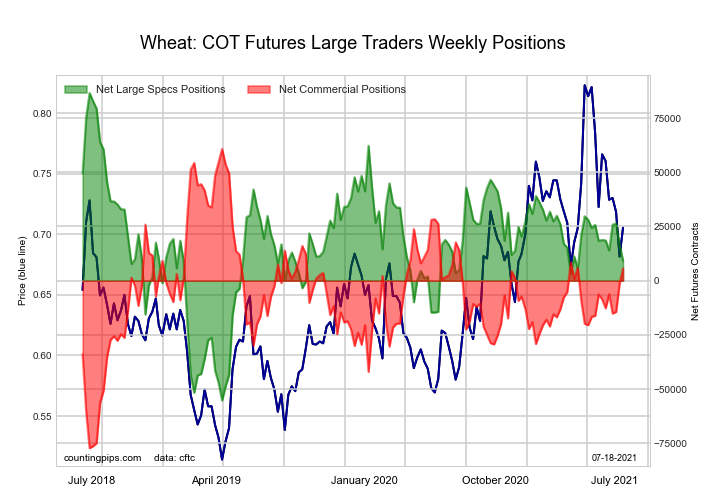 The WHEAT large speculator standing this week was a net position of 9,120 contracts in the data reported through Tuesday. This was a weekly decline of -7,477 contracts from the previous week which had a total of 16,597 net contracts.
This week’s current strength score (the trader positioning range over the past three years, measured from 0 to 100) shows the speculators are currently Bearish with a score of 45.4 percent. The commercials are Bullish with a score of 60.1 percent and the small traders (not shown in chart) are Bearish with a score of 30.8 percent.
| WHEAT Futures Statistics | SPECULATORS | COMMERCIALS | SMALL TRADERS |
| – Percent of Open Interest Longs: | 31.8 | 42.1 | 7.3 |
| – Percent of Open Interest Shorts: | 29.1 | 40.4 | 11.7 |
| – Net Position: | 9,120 | 5,707 | -14,827 |
| – Gross Longs: | 106,833 | 141,635 | 24,666 |
| – Gross Shorts: | 97,713 | 135,928 | 39,493 |
| – Long to Short Ratio: | 1.1 to 1 | 1.0 to 1 | 0.6 to 1 |
| NET POSITION TREND: | |||
| – COT Index Score (3 Year Range Pct): | 45.4 | 60.1 | 30.8 |
| – COT Index Reading (3 Year Range): | Bearish | Bullish | Bearish |
| NET POSITION MOVEMENT INDEX: | |||
| – 6-Week Change in Strength Index: | -6.8 | 10.3 | -21.9 |
Article By CountingPips.com – Receive our weekly COT Reports by Email
*COT Report: The COT data, released weekly to the public each Friday, is updated through the most recent Tuesday (data is 3 days old) and shows a quick view of how large speculators or non-commercials (for-profit traders) were positioned in the futures markets.
The CFTC categorizes trader positions according to commercial hedgers (traders who use futures contracts for hedging as part of the business), non-commercials (large traders who speculate to realize trading profits) and nonreportable traders (usually small traders/speculators).
Find CFTC criteria here: (http://www.cftc.gov/MarketReports/CommitmentsofTraders/ExplanatoryNotes/index.htm).

- COT Metals Charts: Speculator Bets led by Steel Jun 14, 2026
- COT Bonds Charts: Speculator Bets led by 2-Year Bonds & Ultra 10-Year Bonds Jun 14, 2026
- COT Energy Charts: Speculator Bets led by Brent Oil Jun 14, 2026
- COT Soft Commodities Charts: Weekly Speculator Bets led lower by Corn and Soybean Meal Jun 14, 2026
- Today investors’ focus is directed at the historic IPO of SpaceX Jun 12, 2026
- USD/JPY Continues Its Climb: Is There a Limit? Jun 11, 2026
- Investors launched broad profit‑taking in the technology sector. The Bank of Canada kept its rate at 2.25% Jun 11, 2026
- Gold (XAU/USD) Faces Persistent Selling Pressure Jun 10, 2026
- The US technology sector once again came under a wave of selling Jun 10, 2026
- China has shifted to using its own strategic oil reserves Jun 9, 2026