
By CountingPips.com COT Home | Data Tables | Data Downloads | Newsletter
Here are the latest charts and statistics for the Commitment of Traders (COT) data published by the Commodities Futures Trading Commission (CFTC).
The latest COT data is updated through Tuesday July 06 2021 and shows a quick view of how large traders (for-profit speculators and commercial entities) were positioned in the futures markets.
CORN Futures:
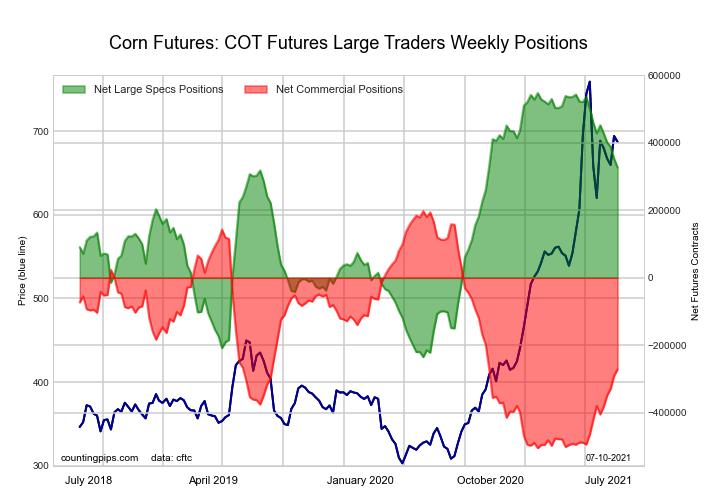 The CORN large speculator standing this week was a net position of 326,814 contracts in the data reported through Tuesday. This was a weekly fall of -26,153 contracts from the previous week which had a total of 352,967 net contracts.
This week’s current strength score (the trader positioning range over the past three years, measured from 0 to 100) shows the speculators are currently Bullish with a score of 71.8 percent. The commercials are Bearish with a score of 33.2 percent and the small traders (not shown in chart) are Bearish-Extreme with a score of 4.6 percent.
| CORN Futures Statistics | SPECULATORS | COMMERCIALS | SMALL TRADERS |
| – Percent of Open Interest Longs: | 28.6 | 48.3 | 8.6 |
| – Percent of Open Interest Shorts: | 7.0 | 66.2 | 12.3 |
| – Net Position: | 326,814 | -271,509 | -55,305 |
| – Gross Longs: | 432,234 | 730,546 | 130,766 |
| – Gross Shorts: | 105,420 | 1,002,055 | 186,071 |
| – Long to Short Ratio: | 4.1 to 1 | 0.7 to 1 | 0.7 to 1 |
| NET POSITION TREND: | |||
| – COT Index Score (3 Year Range Pct): | 71.8 | 33.2 | 4.6 |
| – COT Index Reading (3 Year Range): | Bullish | Bearish | Bearish-Extreme |
| NET POSITION MOVEMENT INDEX: | |||
| – 6-Week Change in Strength Index: | -13.0 | 15.4 | -3.9 |
Free Reports:
 Download Our Metatrader 4 Indicators – Put Our Free MetaTrader 4 Custom Indicators on your charts when you join our Weekly Newsletter
 Get our Weekly Commitment of Traders Reports - See where the biggest traders (Hedge Funds and Commercial Hedgers) are positioned in the futures markets on a weekly basis.
SUGAR Futures:
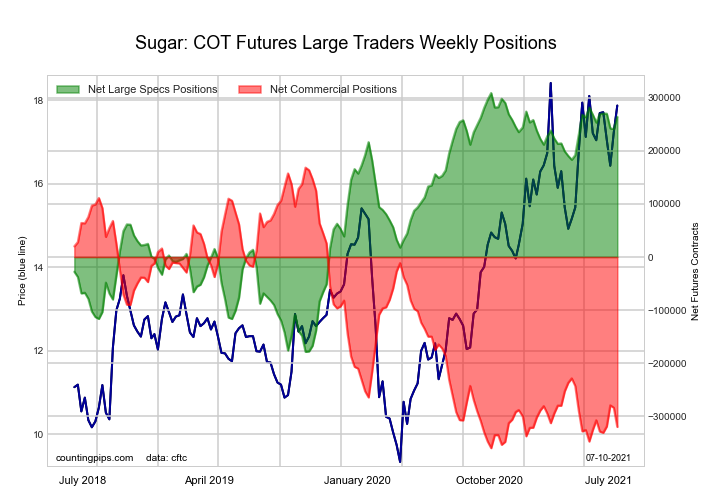 The SUGAR large speculator standing this week was a net position of 264,005 contracts in the data reported through Tuesday. This was a weekly advance of 23,277 contracts from the previous week which had a total of 240,728 net contracts.
This week’s current strength score (the trader positioning range over the past three years, measured from 0 to 100) shows the speculators are currently Bullish-Extreme with a score of 90.9 percent. The commercials are Bearish-Extreme with a score of 7.6 percent and the small traders (not shown in chart) are Bullish with a score of 76.6 percent.
| SUGAR Futures Statistics | SPECULATORS | COMMERCIALS | SMALL TRADERS |
| – Percent of Open Interest Longs: | 32.6 | 43.0 | 9.4 |
| – Percent of Open Interest Shorts: | 4.3 | 77.3 | 3.5 |
| – Net Position: | 264,005 | -319,625 | 55,620 |
| – Gross Longs: | 303,961 | 401,037 | 88,050 |
| – Gross Shorts: | 39,956 | 720,662 | 32,430 |
| – Long to Short Ratio: | 7.6 to 1 | 0.6 to 1 | 2.7 to 1 |
| NET POSITION TREND: | |||
| – COT Index Score (3 Year Range Pct): | 90.9 | 7.6 | 76.6 |
| – COT Index Reading (3 Year Range): | Bullish-Extreme | Bearish-Extreme | Bullish |
| NET POSITION MOVEMENT INDEX: | |||
| – 6-Week Change in Strength Index: | 2.3 | -2.4 | 1.9 |
COFFEE Futures:
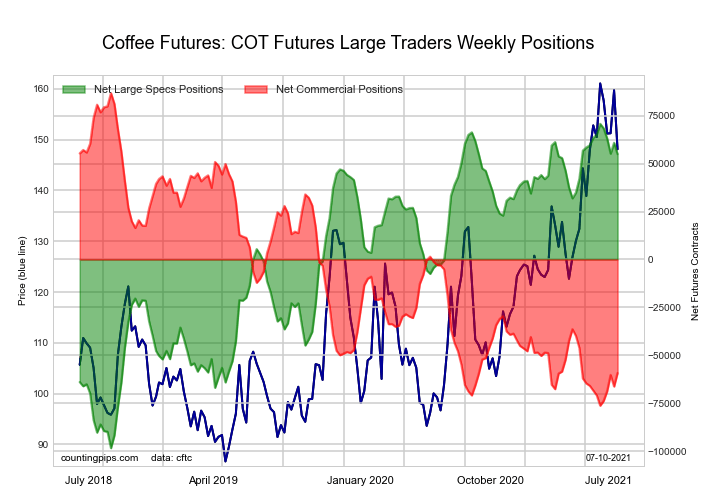 The COFFEE large speculator standing this week was a net position of 54,981 contracts in the data reported through Tuesday. This was a weekly reduction of -5,895 contracts from the previous week which had a total of 60,876 net contracts.
This week’s current strength score (the trader positioning range over the past three years, measured from 0 to 100) shows the speculators are currently Bullish-Extreme with a score of 90.7 percent. The commercials are Bearish-Extreme with a score of 10.4 percent and the small traders (not shown in chart) are Bearish-Extreme with a score of 18.0 percent.
| COFFEE Futures Statistics | SPECULATORS | COMMERCIALS | SMALL TRADERS |
| – Percent of Open Interest Longs: | 30.1 | 47.1 | 4.0 |
| – Percent of Open Interest Shorts: | 10.6 | 68.1 | 2.5 |
| – Net Position: | 54,981 | -59,276 | 4,295 |
| – Gross Longs: | 84,984 | 133,215 | 11,375 |
| – Gross Shorts: | 30,003 | 192,491 | 7,080 |
| – Long to Short Ratio: | 2.8 to 1 | 0.7 to 1 | 1.6 to 1 |
| NET POSITION TREND: | |||
| – COT Index Score (3 Year Range Pct): | 90.7 | 10.4 | 18.0 |
| – COT Index Reading (3 Year Range): | Bullish-Extreme | Bearish-Extreme | Bearish-Extreme |
| NET POSITION MOVEMENT INDEX: | |||
| – 6-Week Change in Strength Index: | -6.0 | 7.1 | -10.4 |
SOYBEANS Futures:
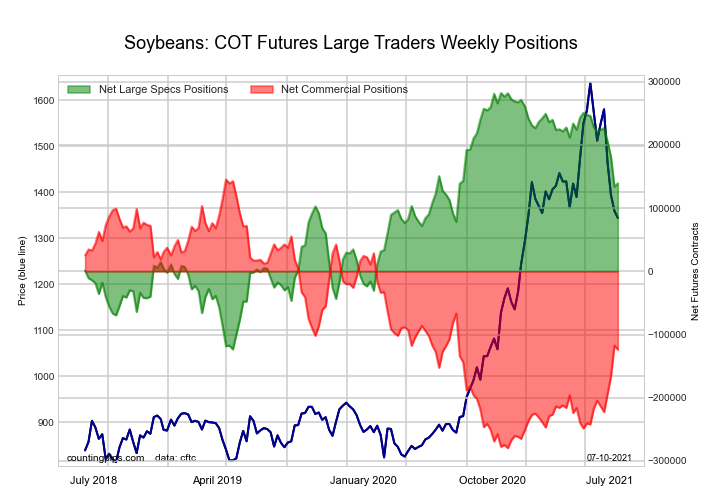 The SOYBEANS large speculator standing this week was a net position of 139,264 contracts in the data reported through Tuesday. This was a weekly gain of 5,253 contracts from the previous week which had a total of 134,011 net contracts.
This week’s current strength score (the trader positioning range over the past three years, measured from 0 to 100) shows the speculators are currently Bullish with a score of 64.8 percent. The commercials are Bearish with a score of 36.7 percent and the small traders (not shown in chart) are Bearish with a score of 45.9 percent.
| SOYBEANS Futures Statistics | SPECULATORS | COMMERCIALS | SMALL TRADERS |
| – Percent of Open Interest Longs: | 29.3 | 48.2 | 7.3 |
| – Percent of Open Interest Shorts: | 9.1 | 66.1 | 9.6 |
| – Net Position: | 139,264 | -123,663 | -15,601 |
| – Gross Longs: | 202,163 | 332,819 | 50,389 |
| – Gross Shorts: | 62,899 | 456,482 | 65,990 |
| – Long to Short Ratio: | 3.2 to 1 | 0.7 to 1 | 0.8 to 1 |
| NET POSITION TREND: | |||
| – COT Index Score (3 Year Range Pct): | 64.8 | 36.7 | 45.9 |
| – COT Index Reading (3 Year Range): | Bullish | Bearish | Bearish |
| NET POSITION MOVEMENT INDEX: | |||
| – 6-Week Change in Strength Index: | -20.2 | 19.0 | 1.7 |
SOYBEAN OIL Futures:
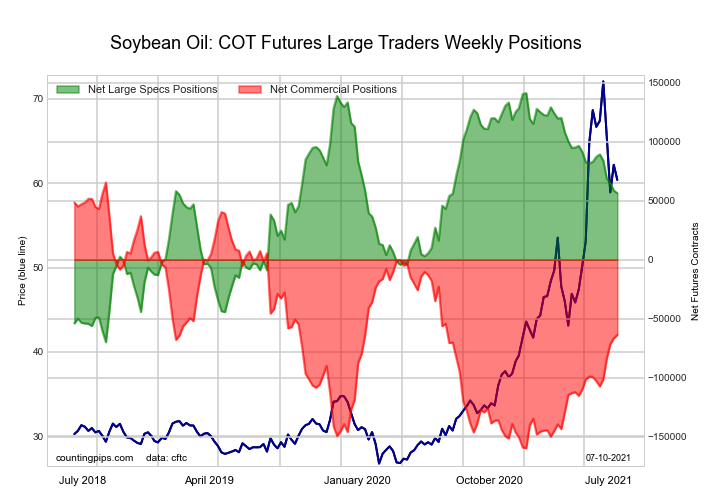 The SOYBEAN OIL large speculator standing this week was a net position of 56,415 contracts in the data reported through Tuesday. This was a weekly lowering of -2,155 contracts from the previous week which had a total of 58,570 net contracts.
This week’s current strength score (the trader positioning range over the past three years, measured from 0 to 100) shows the speculators are currently Bullish with a score of 59.8 percent. The commercials are Bearish with a score of 42.7 percent and the small traders (not shown in chart) are Bearish with a score of 40.3 percent.
| SOYBEAN OIL Futures Statistics | SPECULATORS | COMMERCIALS | SMALL TRADERS |
| – Percent of Open Interest Longs: | 19.1 | 51.8 | 6.7 |
| – Percent of Open Interest Shorts: | 7.5 | 64.8 | 5.2 |
| – Net Position: | 56,415 | -63,623 | 7,208 |
| – Gross Longs: | 92,864 | 252,369 | 32,638 |
| – Gross Shorts: | 36,449 | 315,992 | 25,430 |
| – Long to Short Ratio: | 2.5 to 1 | 0.8 to 1 | 1.3 to 1 |
| NET POSITION TREND: | |||
| – COT Index Score (3 Year Range Pct): | 59.8 | 42.7 | 40.3 |
| – COT Index Reading (3 Year Range): | Bullish | Bearish | Bearish |
| NET POSITION MOVEMENT INDEX: | |||
| – 6-Week Change in Strength Index: | -14.6 | 17.4 | -30.8 |
SOYBEAN MEAL Futures:
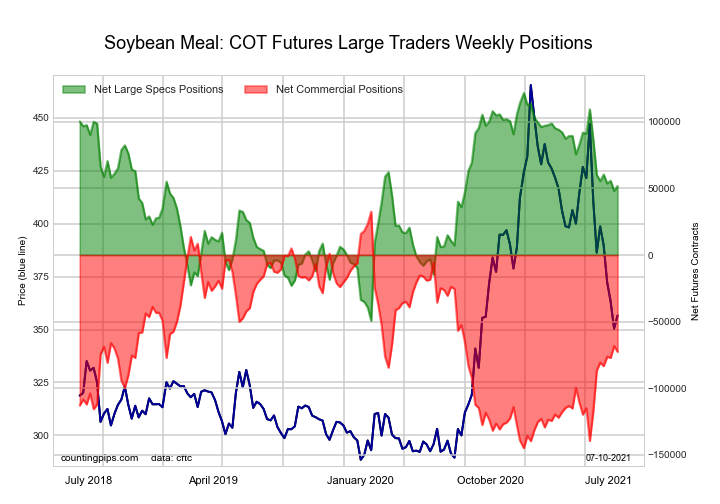 The SOYBEAN MEAL large speculator standing this week was a net position of 51,781 contracts in the data reported through Tuesday. This was a weekly gain of 3,572 contracts from the previous week which had a total of 48,209 net contracts.
This week’s current strength score (the trader positioning range over the past three years, measured from 0 to 100) shows the speculators are currently Bullish with a score of 59.1 percent. The commercials are Bearish with a score of 40.8 percent and the small traders (not shown in chart) are Bullish with a score of 54.2 percent.
| SOYBEAN MEAL Futures Statistics | SPECULATORS | COMMERCIALS | SMALL TRADERS |
| – Percent of Open Interest Longs: | 21.8 | 51.1 | 12.3 |
| – Percent of Open Interest Shorts: | 8.1 | 70.3 | 6.8 |
| – Net Position: | 51,781 | -72,645 | 20,864 |
| – Gross Longs: | 82,443 | 193,760 | 46,511 |
| – Gross Shorts: | 30,662 | 266,405 | 25,647 |
| – Long to Short Ratio: | 2.7 to 1 | 0.7 to 1 | 1.8 to 1 |
| NET POSITION TREND: | |||
| – COT Index Score (3 Year Range Pct): | 59.1 | 40.8 | 54.2 |
| – COT Index Reading (3 Year Range): | Bullish | Bearish | Bullish |
| NET POSITION MOVEMENT INDEX: | |||
| – 6-Week Change in Strength Index: | -5.0 | 7.9 | -22.2 |
LIVE CATTLE Futures:
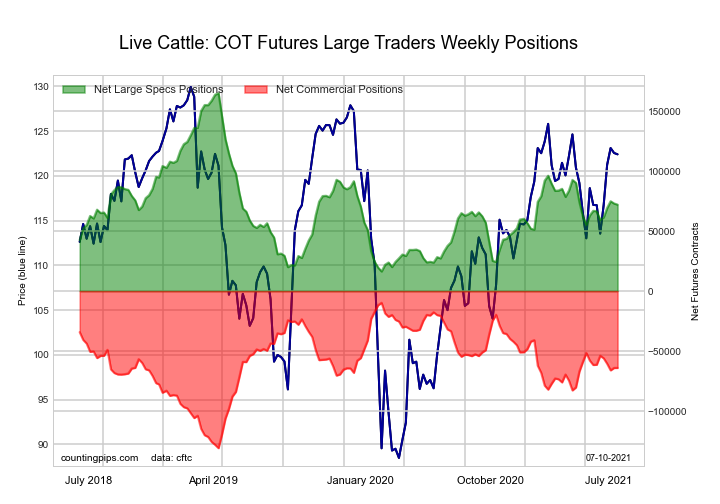 The LIVE CATTLE large speculator standing this week was a net position of 72,126 contracts in the data reported through Tuesday. This was a weekly decline of -947 contracts from the previous week which had a total of 73,073 net contracts.
This week’s current strength score (the trader positioning range over the past three years, measured from 0 to 100) shows the speculators are currently Bearish with a score of 37.4 percent. The commercials are Bullish with a score of 55.2 percent and the small traders (not shown in chart) are Bullish with a score of 67.3 percent.
| LIVE CATTLE Futures Statistics | SPECULATORS | COMMERCIALS | SMALL TRADERS |
| – Percent of Open Interest Longs: | 37.1 | 38.5 | 9.2 |
| – Percent of Open Interest Shorts: | 13.2 | 59.8 | 11.9 |
| – Net Position: | 72,126 | -63,972 | -8,154 |
| – Gross Longs: | 111,751 | 116,138 | 27,713 |
| – Gross Shorts: | 39,625 | 180,110 | 35,867 |
| – Long to Short Ratio: | 2.8 to 1 | 0.6 to 1 | 0.8 to 1 |
| NET POSITION TREND: | |||
| – COT Index Score (3 Year Range Pct): | 37.4 | 55.2 | 67.3 |
| – COT Index Reading (3 Year Range): | Bearish | Bullish | Bullish |
| NET POSITION MOVEMENT INDEX: | |||
| – 6-Week Change in Strength Index: | 3.7 | -2.2 | -7.0 |
LEAN HOGS Futures:
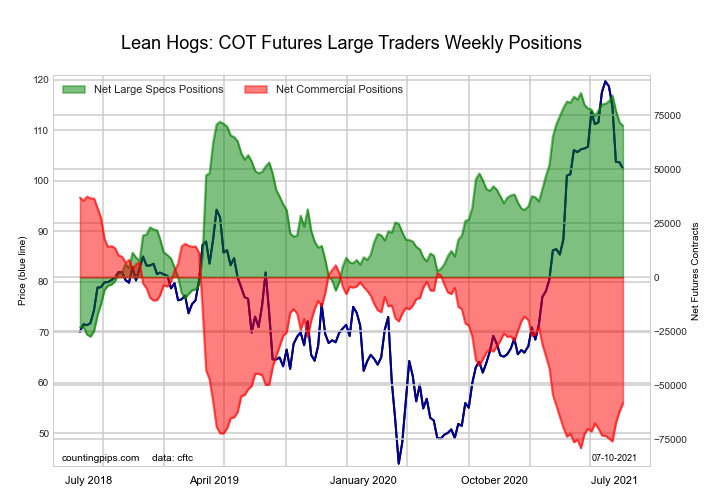 The LEAN HOGS large speculator standing this week was a net position of 70,046 contracts in the data reported through Tuesday. This was a weekly fall of -1,653 contracts from the previous week which had a total of 71,699 net contracts.
This week’s current strength score (the trader positioning range over the past three years, measured from 0 to 100) shows the speculators are currently Bullish-Extreme with a score of 86.5 percent. The commercials are Bearish-Extreme with a score of 17.9 percent and the small traders (not shown in chart) are Bearish with a score of 22.2 percent.
| LEAN HOGS Futures Statistics | SPECULATORS | COMMERCIALS | SMALL TRADERS |
| – Percent of Open Interest Longs: | 39.5 | 33.1 | 8.1 |
| – Percent of Open Interest Shorts: | 13.0 | 55.2 | 12.5 |
| – Net Position: | 70,046 | -58,317 | -11,729 |
| – Gross Longs: | 104,371 | 87,546 | 21,297 |
| – Gross Shorts: | 34,325 | 145,863 | 33,026 |
| – Long to Short Ratio: | 3.0 to 1 | 0.6 to 1 | 0.6 to 1 |
| NET POSITION TREND: | |||
| – COT Index Score (3 Year Range Pct): | 86.5 | 17.9 | 22.2 |
| – COT Index Reading (3 Year Range): | Bullish-Extreme | Bearish-Extreme | Bearish |
| NET POSITION MOVEMENT INDEX: | |||
| – 6-Week Change in Strength Index: | -8.8 | 12.8 | -23.4 |
COTTON Futures:
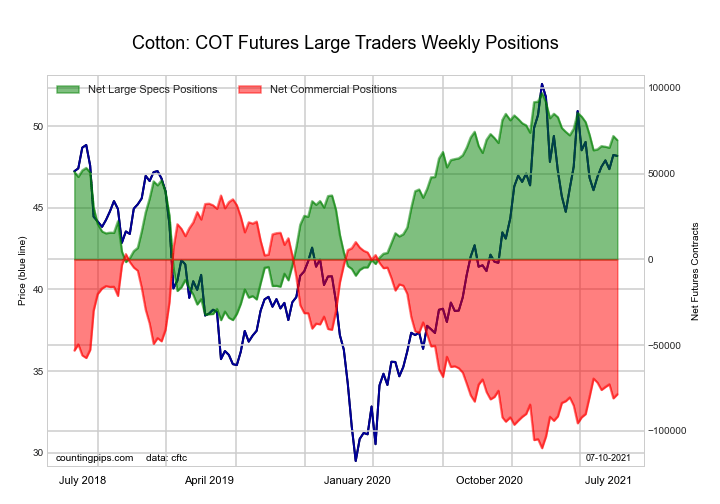 The COTTON large speculator standing this week was a net position of 69,538 contracts in the data reported through Tuesday. This was a weekly fall of -2,414 contracts from the previous week which had a total of 71,952 net contracts.
This week’s current strength score (the trader positioning range over the past three years, measured from 0 to 100) shows the speculators are currently Bullish with a score of 72.0 percent. The commercials are Bearish with a score of 26.1 percent and the small traders (not shown in chart) are Bullish with a score of 71.6 percent.
| COTTON Futures Statistics | SPECULATORS | COMMERCIALS | SMALL TRADERS |
| – Percent of Open Interest Longs: | 37.2 | 43.6 | 6.8 |
| – Percent of Open Interest Shorts: | 5.8 | 79.2 | 2.7 |
| – Net Position: | 69,538 | -78,685 | 9,147 |
| – Gross Longs: | 82,348 | 96,528 | 15,147 |
| – Gross Shorts: | 12,810 | 175,213 | 6,000 |
| – Long to Short Ratio: | 6.4 to 1 | 0.6 to 1 | 2.5 to 1 |
| NET POSITION TREND: | |||
| – COT Index Score (3 Year Range Pct): | 72.0 | 26.1 | 71.6 |
| – COT Index Reading (3 Year Range): | Bullish | Bearish | Bullish |
| NET POSITION MOVEMENT INDEX: | |||
| – 6-Week Change in Strength Index: | 4.0 | -5.9 | 21.0 |
COCOA Futures:
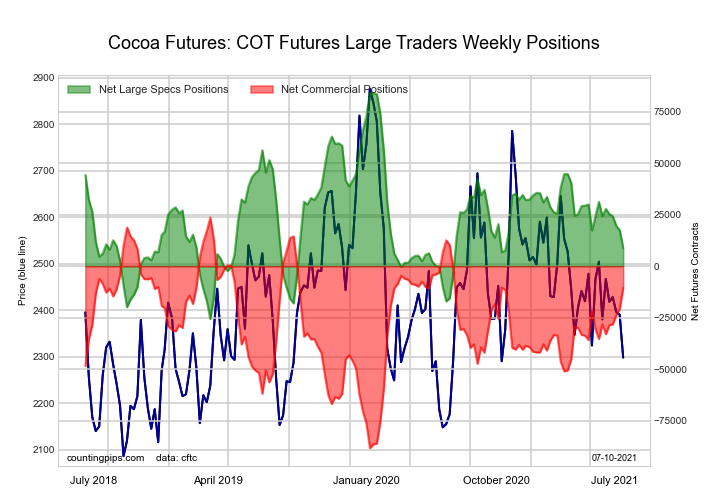 The COCOA large speculator standing this week was a net position of 8,767 contracts in the data reported through Tuesday. This was a weekly lowering of -8,747 contracts from the previous week which had a total of 17,514 net contracts.
This week’s current strength score (the trader positioning range over the past three years, measured from 0 to 100) shows the speculators are currently Bearish with a score of 31.3 percent. The commercials are Bullish with a score of 69.5 percent and the small traders (not shown in chart) are Bearish with a score of 27.8 percent.
| COCOA Futures Statistics | SPECULATORS | COMMERCIALS | SMALL TRADERS |
| – Percent of Open Interest Longs: | 26.7 | 48.1 | 4.9 |
| – Percent of Open Interest Shorts: | 23.2 | 52.4 | 4.2 |
| – Net Position: | 8,767 | -10,468 | 1,701 |
| – Gross Longs: | 65,899 | 118,691 | 12,070 |
| – Gross Shorts: | 57,132 | 129,159 | 10,369 |
| – Long to Short Ratio: | 1.2 to 1 | 0.9 to 1 | 1.2 to 1 |
| NET POSITION TREND: | |||
| – COT Index Score (3 Year Range Pct): | 31.3 | 69.5 | 27.8 |
| – COT Index Reading (3 Year Range): | Bearish | Bullish | Bearish |
| NET POSITION MOVEMENT INDEX: | |||
| – 6-Week Change in Strength Index: | -14.2 | 15.8 | -24.8 |
WHEAT Futures:
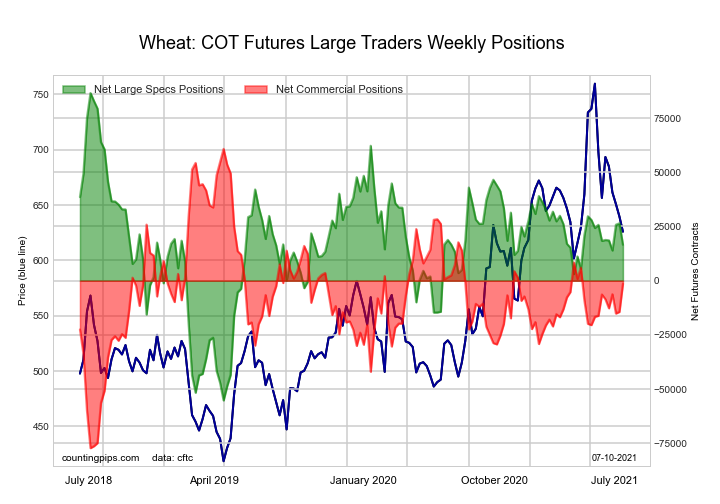 The WHEAT large speculator standing this week was a net position of 16,597 contracts in the data reported through Tuesday. This was a weekly decline of -9,849 contracts from the previous week which had a total of 26,446 net contracts.
This week’s current strength score (the trader positioning range over the past three years, measured from 0 to 100) shows the speculators are currently Bullish with a score of 50.7 percent. The commercials are Bullish with a score of 55.0 percent and the small traders (not shown in chart) are Bearish with a score of 28.8 percent.
| WHEAT Futures Statistics | SPECULATORS | COMMERCIALS | SMALL TRADERS |
| – Percent of Open Interest Longs: | 31.1 | 41.6 | 6.8 |
| – Percent of Open Interest Shorts: | 26.2 | 42.0 | 11.4 |
| – Net Position: | 16,597 | -1,367 | -15,230 |
| – Gross Longs: | 104,413 | 139,776 | 22,986 |
| – Gross Shorts: | 87,816 | 141,143 | 38,216 |
| – Long to Short Ratio: | 1.2 to 1 | 1.0 to 1 | 0.6 to 1 |
| NET POSITION TREND: | |||
| – COT Index Score (3 Year Range Pct): | 50.7 | 55.0 | 28.8 |
| – COT Index Reading (3 Year Range): | Bullish | Bullish | Bearish |
| NET POSITION MOVEMENT INDEX: | |||
| – 6-Week Change in Strength Index: | -1.3 | 3.6 | -15.2 |
Article By CountingPips.com – Receive our weekly COT Reports by Email
*COT Report: The COT data, released weekly to the public each Friday, is updated through the most recent Tuesday (data is 3 days old) and shows a quick view of how large speculators or non-commercials (for-profit traders) were positioned in the futures markets.
The CFTC categorizes trader positions according to commercial hedgers (traders who use futures contracts for hedging as part of the business), non-commercials (large traders who speculate to realize trading profits) and nonreportable traders (usually small traders/speculators).
Find CFTC criteria here: (http://www.cftc.gov/MarketReports/CommitmentsofTraders/ExplanatoryNotes/index.htm).

- The United States and Iran have signed a peace agreement – oil has fallen to 80 dollars per barrel. Jun 15, 2026
- COT Metals Charts: Speculator Bets led by Steel Jun 14, 2026
- COT Bonds Charts: Speculator Bets led by 2-Year Bonds & Ultra 10-Year Bonds Jun 14, 2026
- COT Energy Charts: Speculator Bets led by Brent Oil Jun 14, 2026
- COT Soft Commodities Charts: Weekly Speculator Bets led lower by Corn and Soybean Meal Jun 14, 2026
- Today investors’ focus is directed at the historic IPO of SpaceX Jun 12, 2026
- USD/JPY Continues Its Climb: Is There a Limit? Jun 11, 2026
- Investors launched broad profit‑taking in the technology sector. The Bank of Canada kept its rate at 2.25% Jun 11, 2026
- Gold (XAU/USD) Faces Persistent Selling Pressure Jun 10, 2026
- The US technology sector once again came under a wave of selling Jun 10, 2026