
Article By RoboForex.com
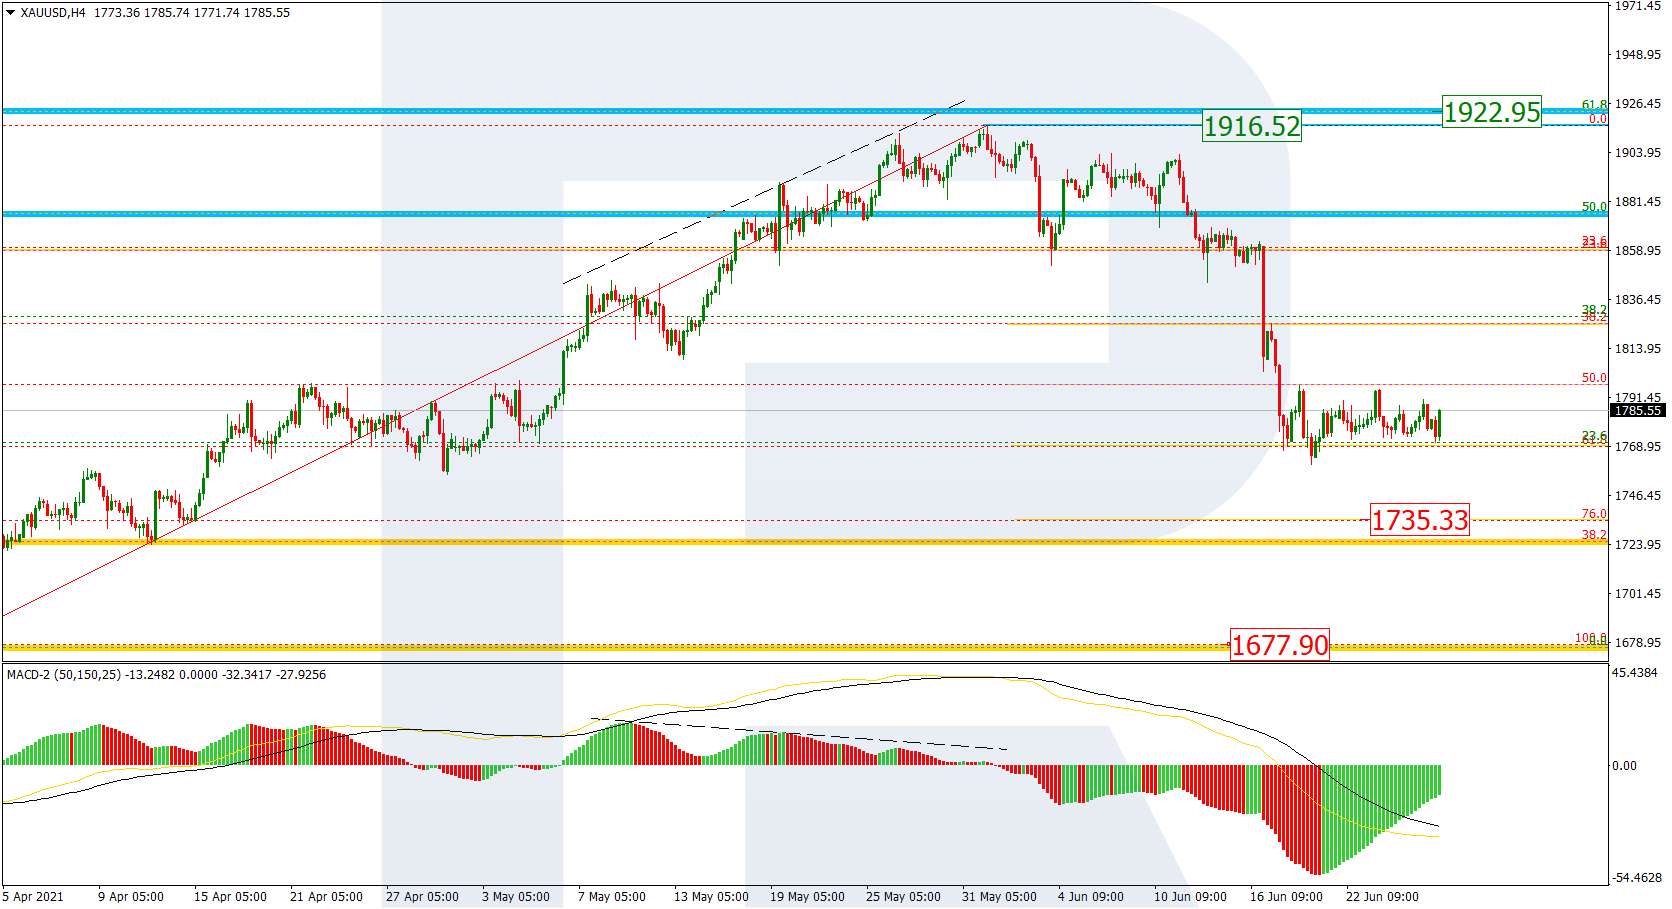
XAUUSD, “Gold vs US Dollar”
As we can see in the H4 chart, XAUUSD is correcting after finishing a wave to the downside. Possibly, the pair may complete the pullback and resume falling. The previous decline has reached 61.8% fibo, so the next one may reach 76.0% fibo and the low at 1736.33 and 1676.78 respectively. At the same time, a breakout of the resistance at 1916.52 may lead to a further rising movement towards the mid-term targets, which are 61.8% and 76.0% fibo at 1922.95 and 1979.00 respectively but this scenario is rather unlikely.

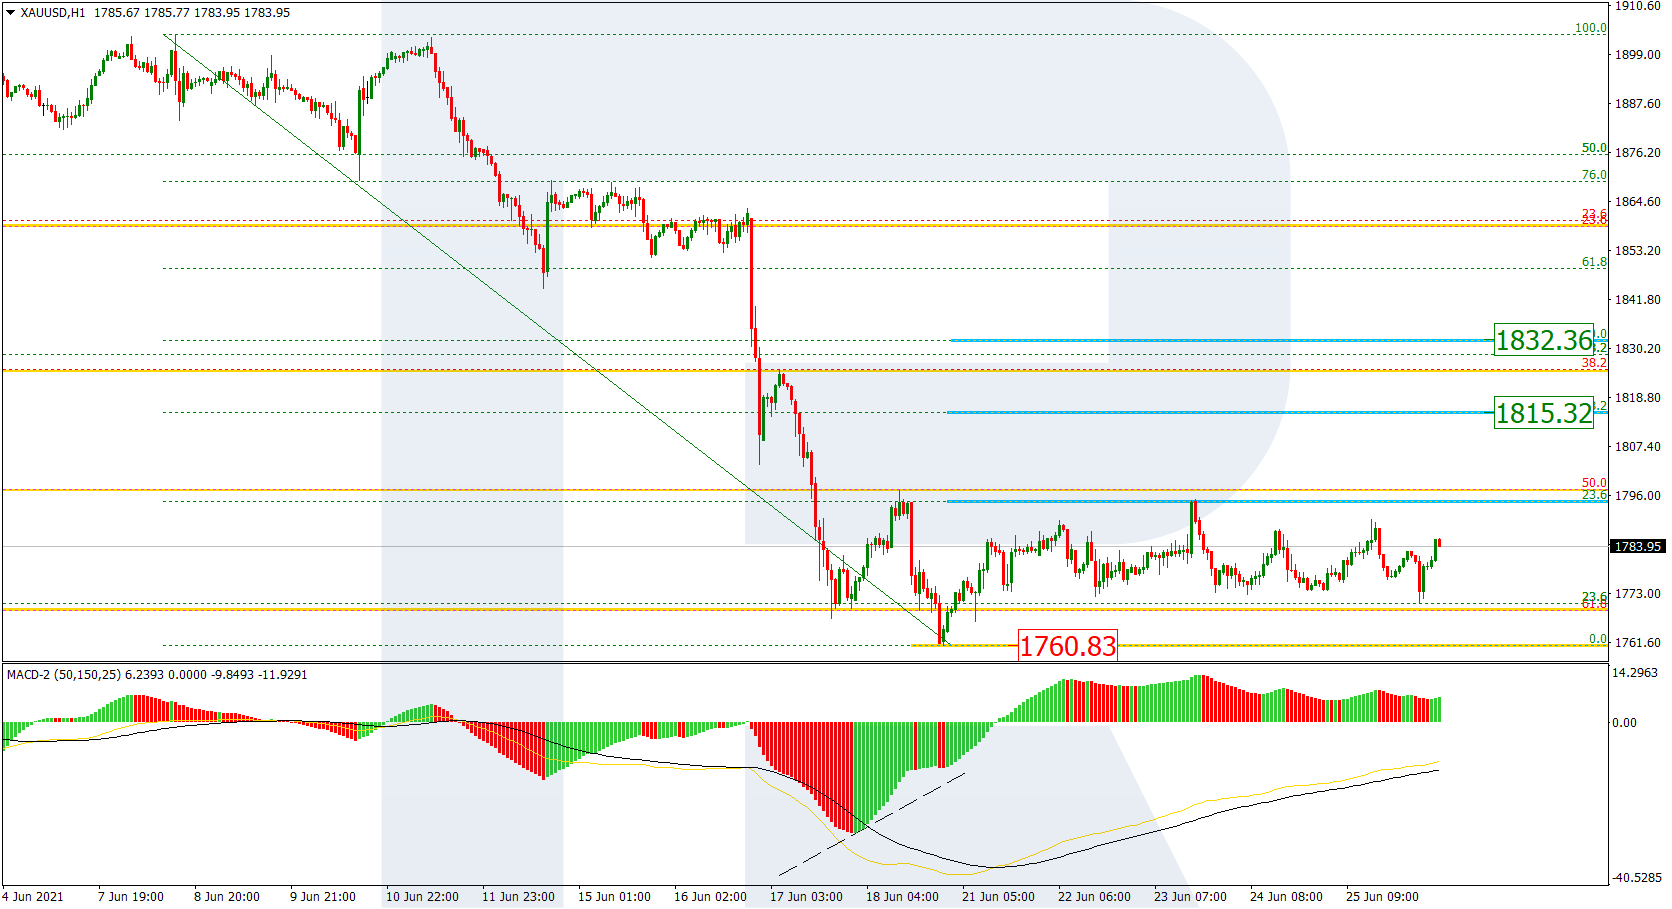
The H1 chart shows a more detailed structure of the current correction. After testing 23.6% fibo, the pair may continue growing towards 38.2% and 50.0% fibo at 1815.32 and 1832.37 respectively. The support is the low at 1760.83. If the price breaks this level, the asset will complete the correction and resume trading downwards.
Free Reports:
 Download Our Metatrader 4 Indicators – Put Our Free MetaTrader 4 Custom Indicators on your charts when you join our Weekly Newsletter
 Get our Weekly Commitment of Traders Reports - See where the biggest traders (Hedge Funds and Commercial Hedgers) are positioned in the futures markets on a weekly basis.
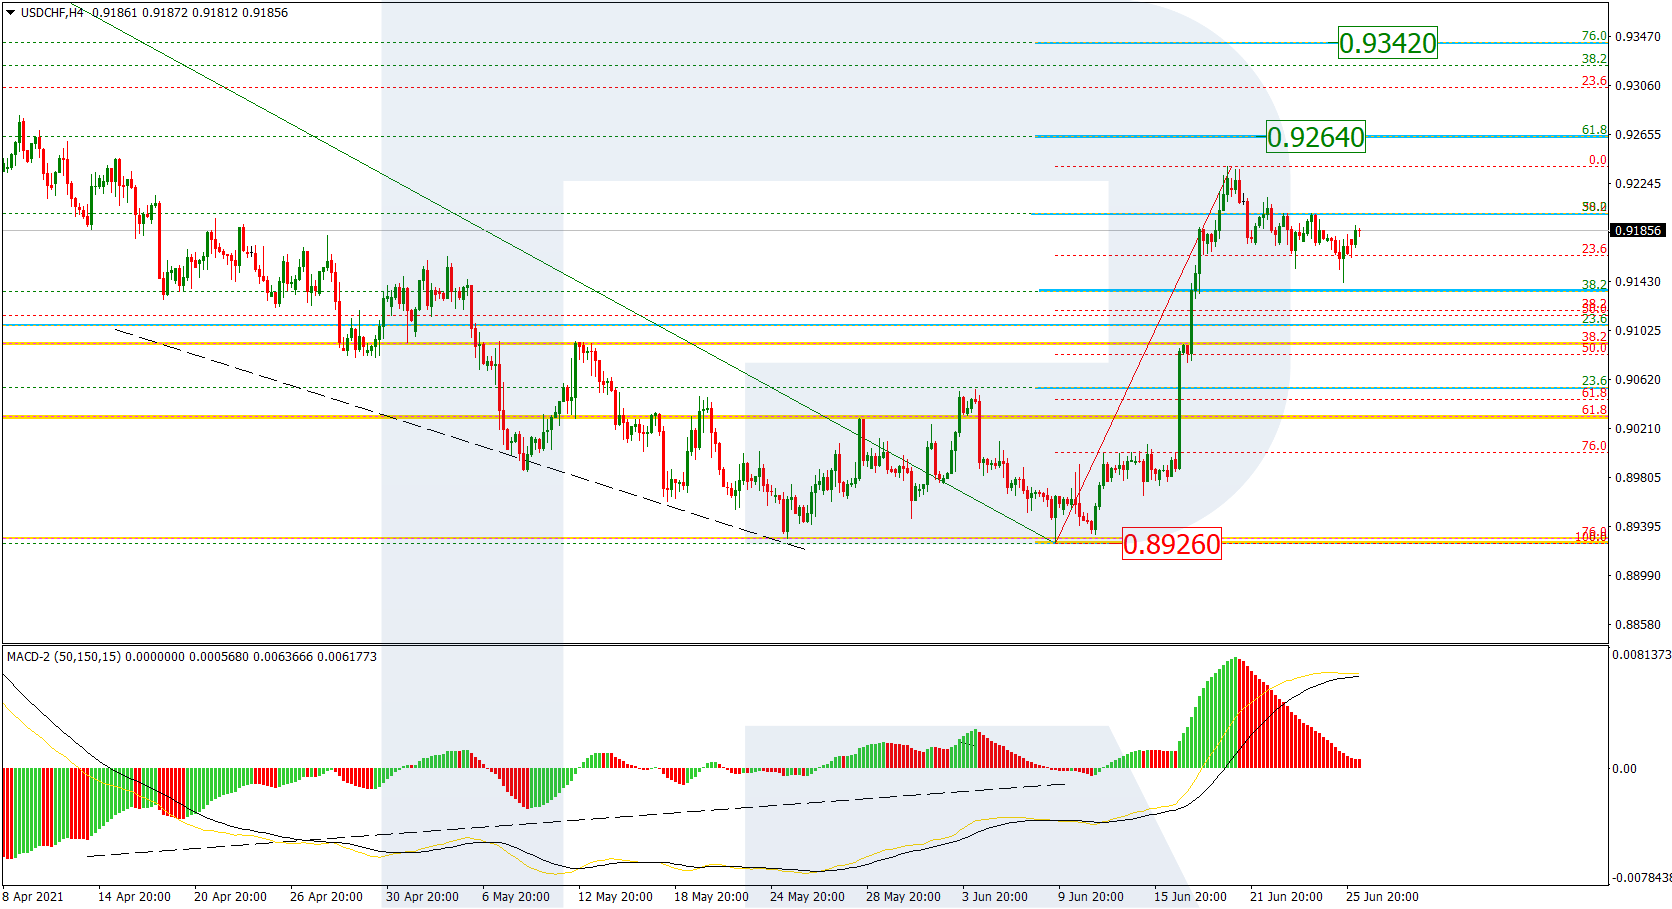
USDCHF, “US Dollar vs Swiss Franc”
As we can see in the H4 chart, USDCHF is trying to finish the correction and start a new rising impulse towards 61.8% and 76.0% fibo at 0.9264 and 0.9342 respectively. The key support is the low at 0.8926.
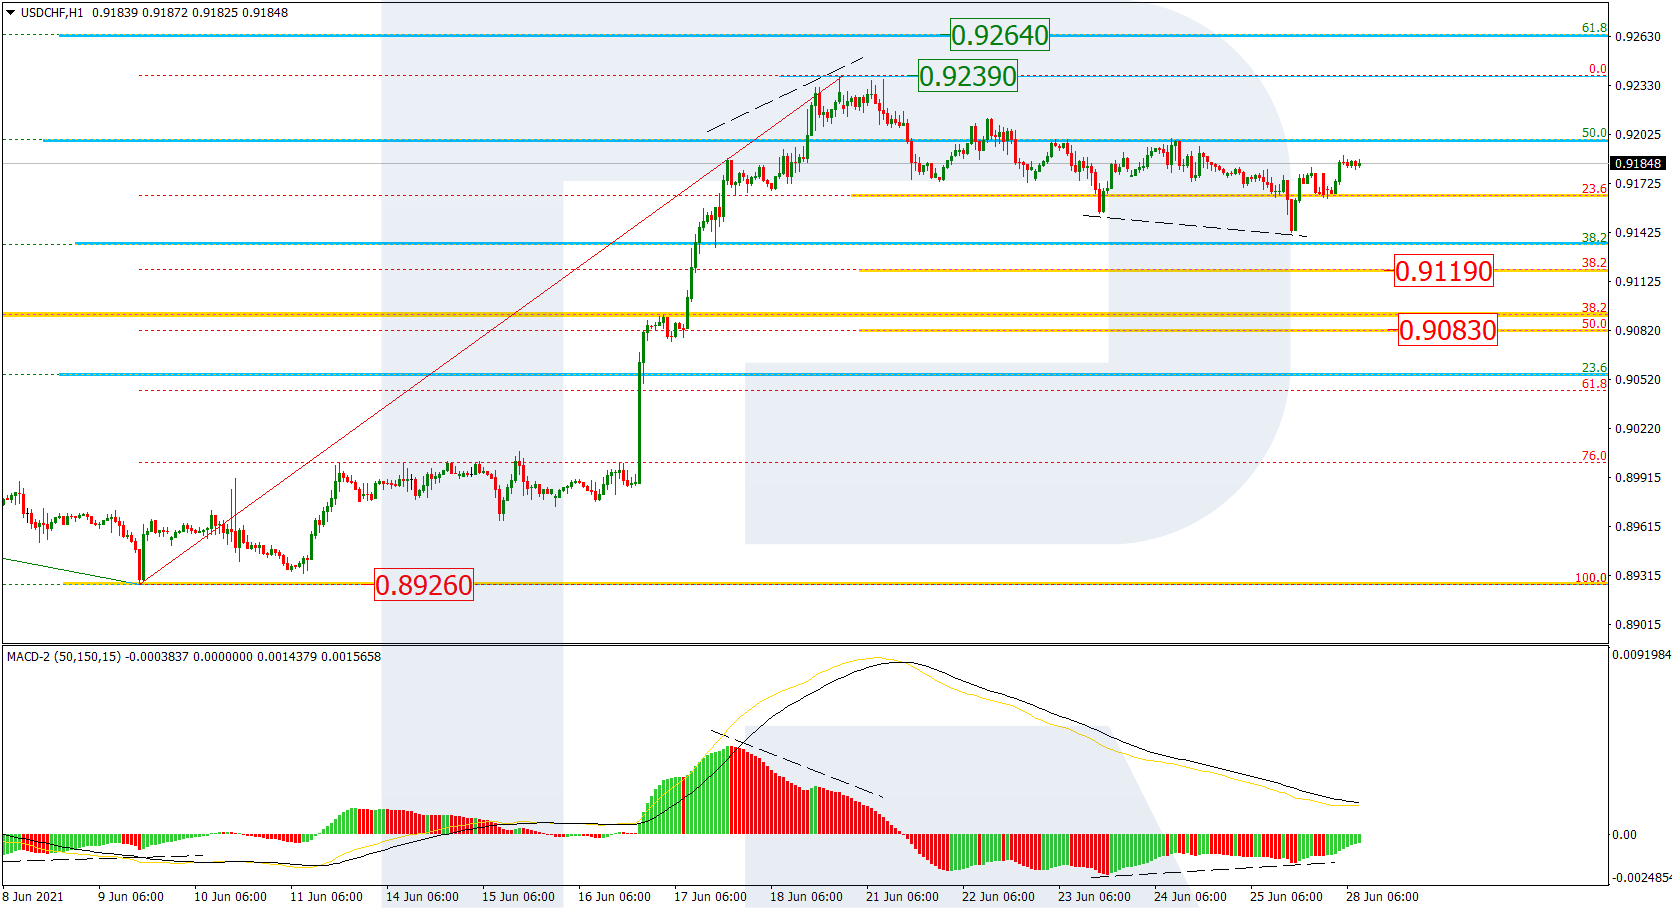
In the H1 chart, after breaking 23.6% fibo, USDCHF has failed to reach 38.2% fibo at 0.9119. At the same time, a convergence on MACD may hint at a new rising impulse towards the high at 0.9239. On the other hand, if the price forms a new structure to the downside, its targets will be 38.2% and 50.0% fibo at 0.9119 and 0.9083 respectively.
Article By RoboForex.com
Attention!
Forecasts presented in this section only reflect the author’s private opinion and should not be considered as guidance for trading. RoboForex LP bears no responsibility for trading results based on trading recommendations described in these analytical reviews.

- The United States and Iran have signed a peace agreement – oil has fallen to 80 dollars per barrel. Jun 15, 2026
- COT Metals Charts: Speculator Bets led by Steel Jun 14, 2026
- COT Bonds Charts: Speculator Bets led by 2-Year Bonds & Ultra 10-Year Bonds Jun 14, 2026
- COT Energy Charts: Speculator Bets led by Brent Oil Jun 14, 2026
- COT Soft Commodities Charts: Weekly Speculator Bets led lower by Corn and Soybean Meal Jun 14, 2026
- Today investors’ focus is directed at the historic IPO of SpaceX Jun 12, 2026
- USD/JPY Continues Its Climb: Is There a Limit? Jun 11, 2026
- Investors launched broad profit‑taking in the technology sector. The Bank of Canada kept its rate at 2.25% Jun 11, 2026
- Gold (XAU/USD) Faces Persistent Selling Pressure Jun 10, 2026
- The US technology sector once again came under a wave of selling Jun 10, 2026