
Article By RoboForex.com
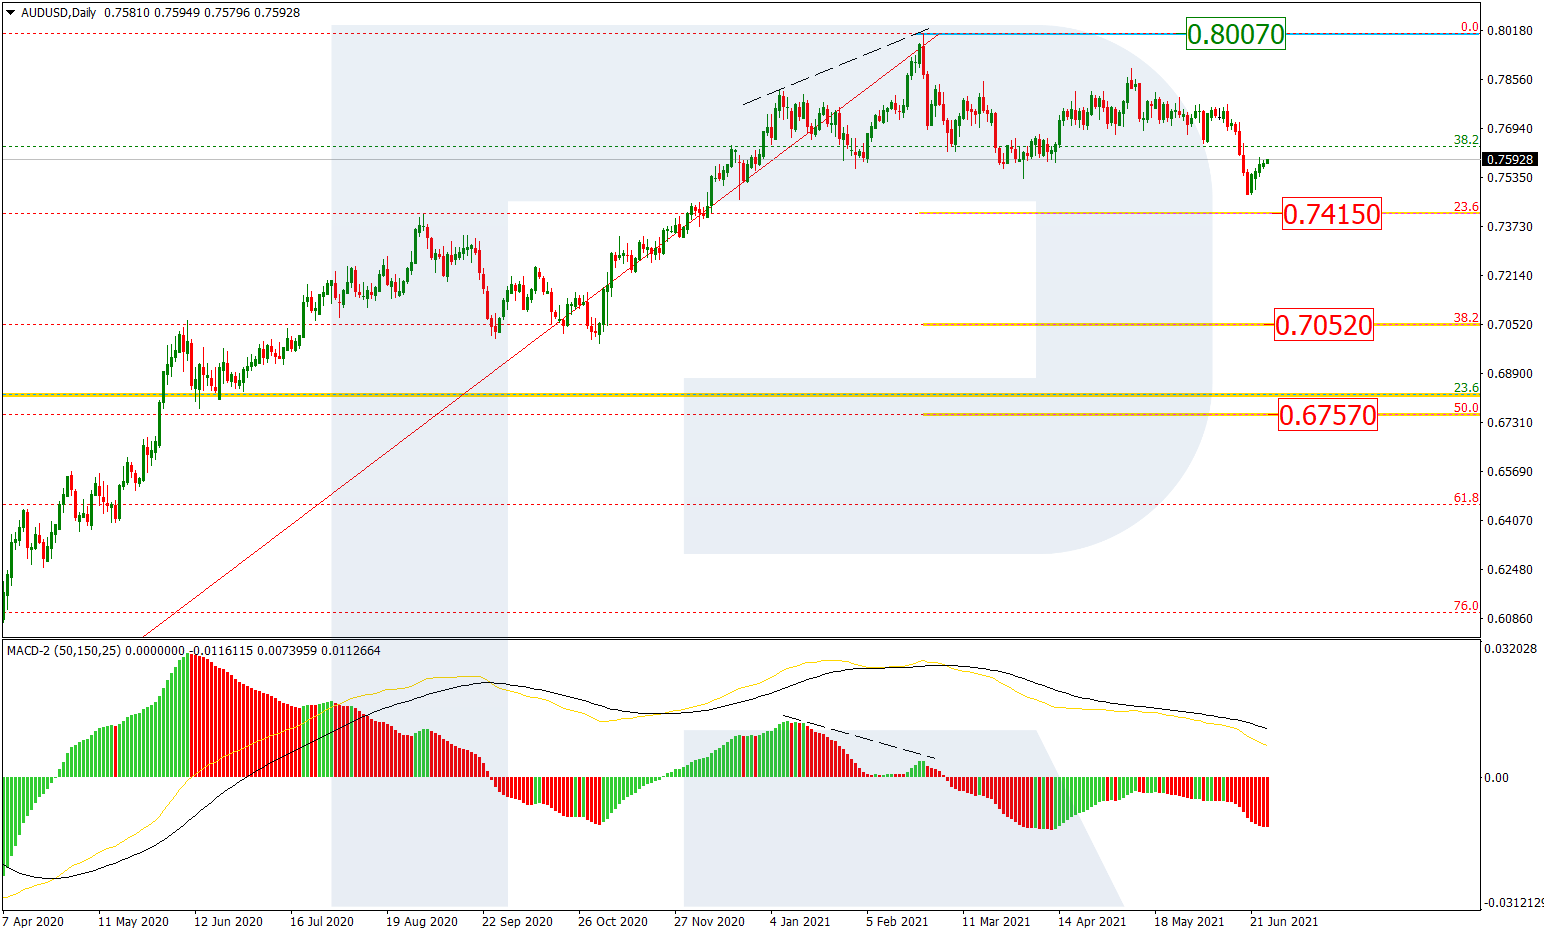
AUDUSD, “Australian Dollar vs US Dollar”
As we can see in the daily chart, there is a new descending correctional wave after a divergence on MACD. After failing to reach 23.6%% fibo at 0.7415, the asset has corrected. The next downside targets may be 38.2% and 50.0% fibo at 0.7052 and 0.6757 respectively. The resistance is the high at 0.8007.

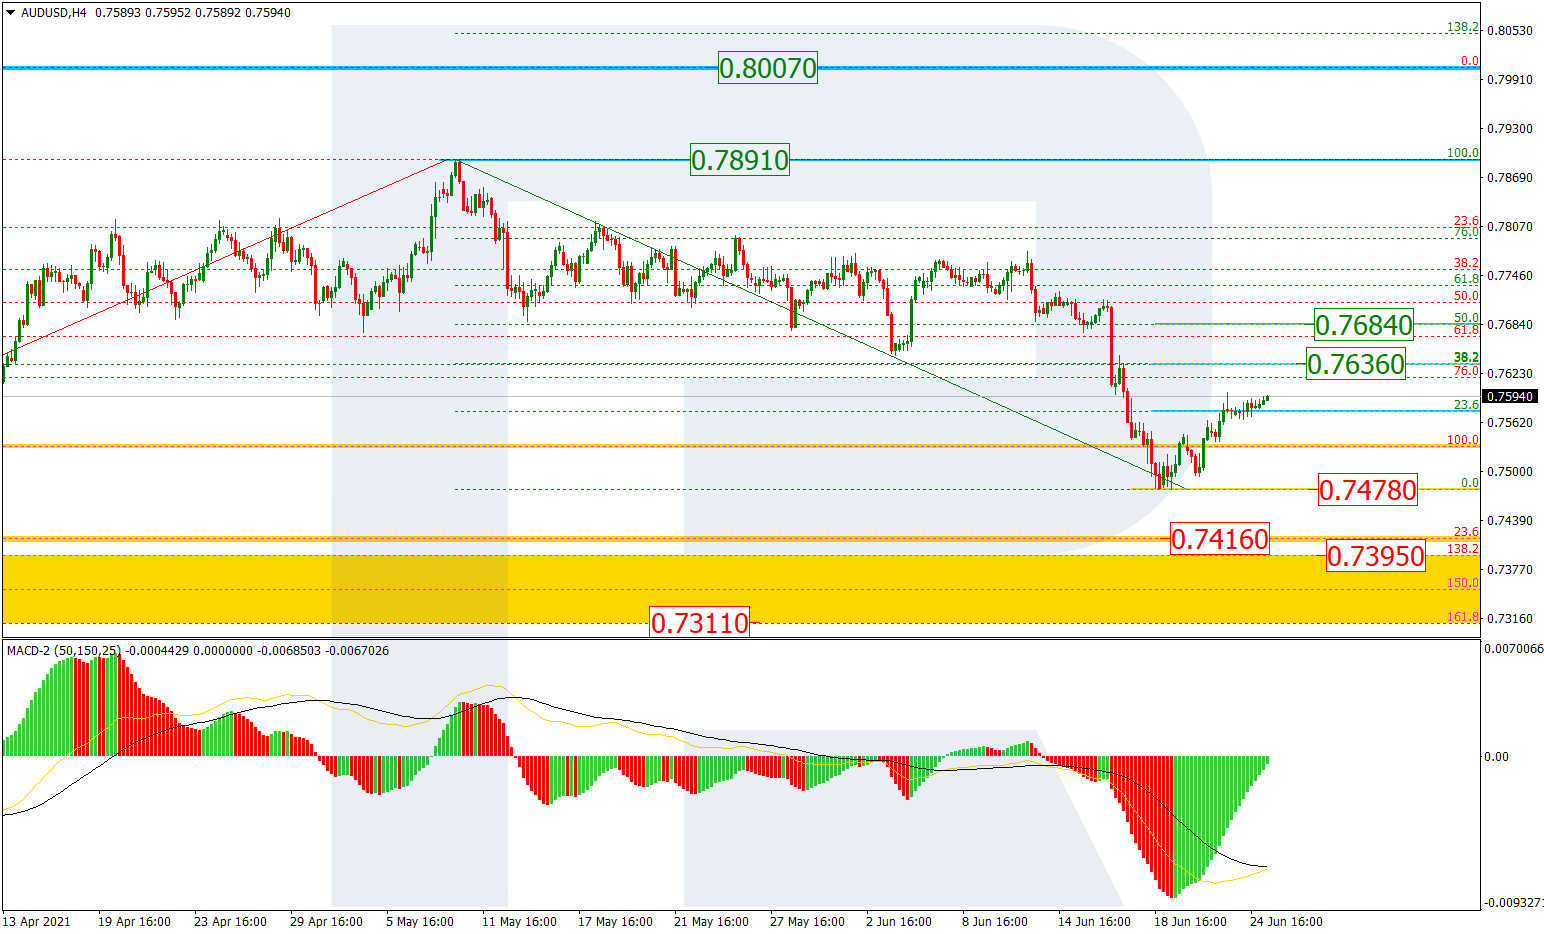
The H4 chart of AUDUSD shows a correctional uptrend after the previous descending wave, which has already reached 23,6% fibo and may later continue towards 38.2% and 50.0% fibo at 0.7636 and 0.7684 respectively. After completing the correction, AUDUSD may resume falling to break the support at 0.7478 and then continue falling towards the post-correctional extension area between 138.2% and 161.8% fibo at 0.7395 and 0.7311 respectively. The local resistance is at 0.7891.
Free Reports:
 Sign Up for Our Stock Market Newsletter – Get updated on News, Charts & Rankings of Public Companies when you join our Stocks Newsletter
 Get our Weekly Commitment of Traders Reports - See where the biggest traders (Hedge Funds and Commercial Hedgers) are positioned in the futures markets on a weekly basis.
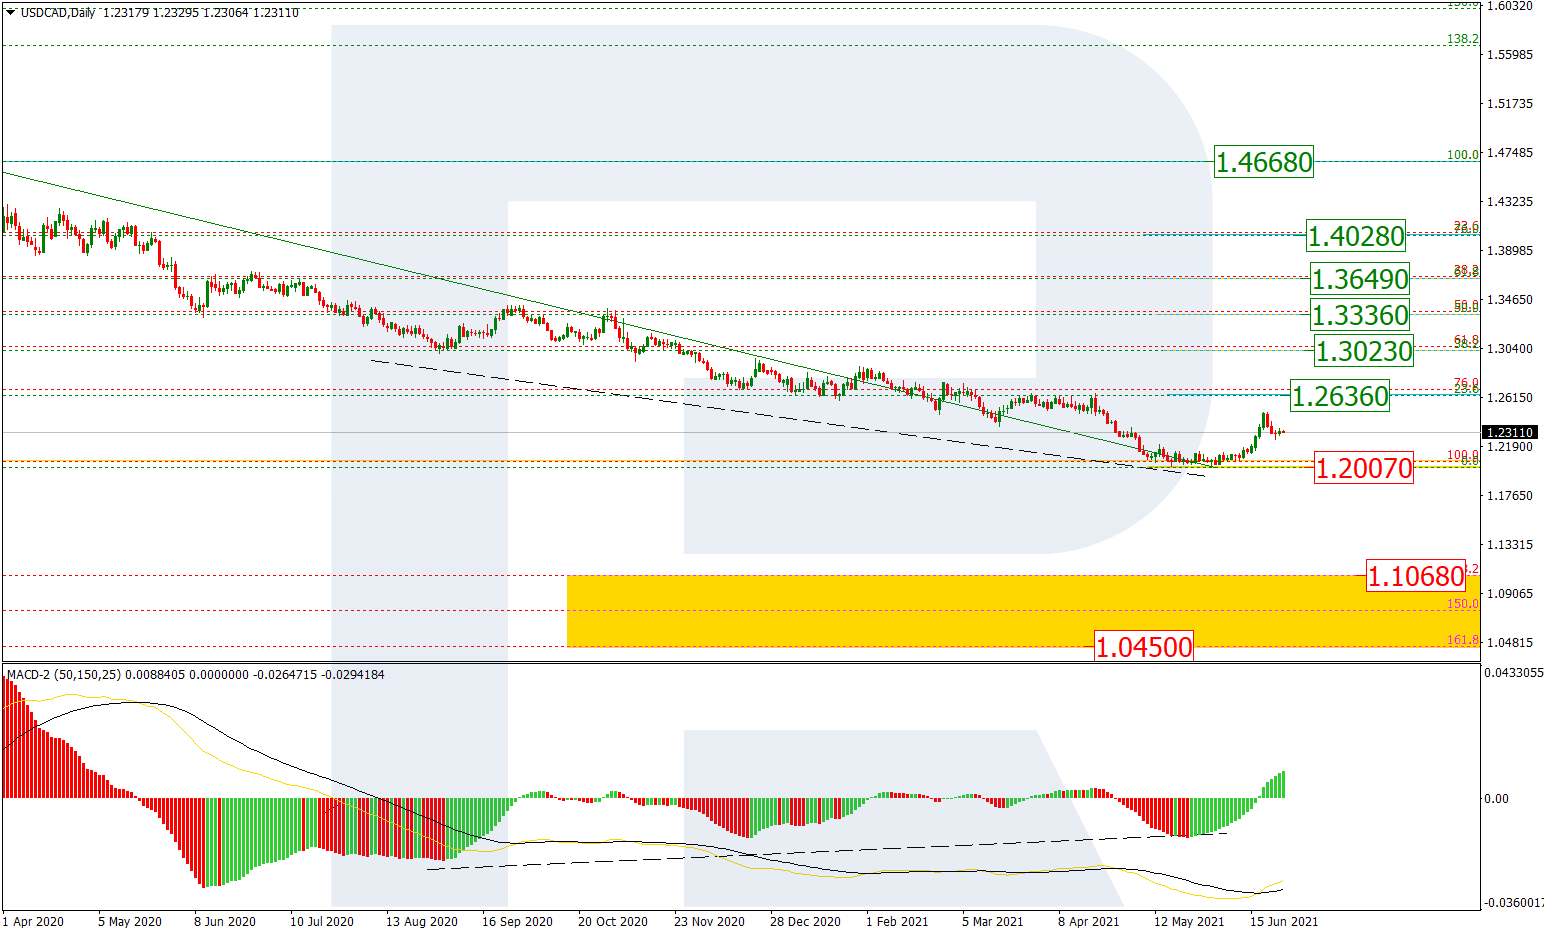
USDCAD, “US Dollar vs Canadian Dollar”
As we can see in the daily chart, USDCAD is moving upwards after a convergence on MACD to reach 23.6%, 38.2%, 50.0%, 61.8%, and 76.0% fibo at 1.2636, 1.3023, 1.3336, 1.3649, and 1.4028 respectively. At the same time, there is a possibility that the price may break the low at 1.2007 and then continue falling towards the post-correctional extension area between 138.2% and 161.8% fibo at 1.1068 and 1.0450 respectively.
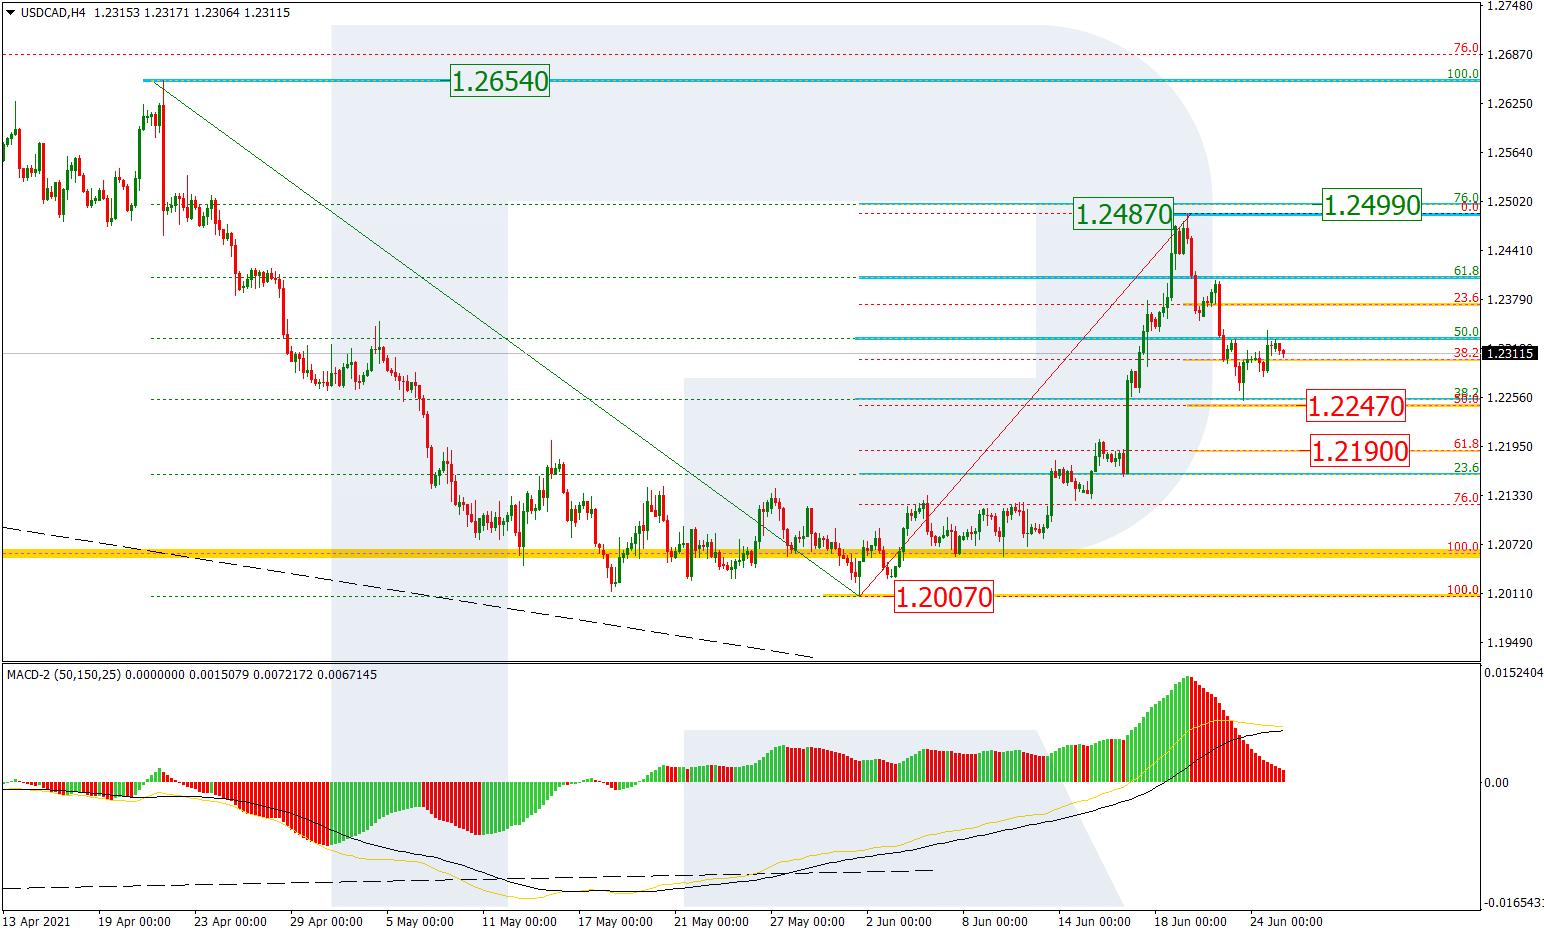
The H4 chart shows a descending correction after the previous ascending impulse. The pair is heading towards 50.0% and 61.8% fibo at 1.2247 and 1.2190 respectively. After the pullback is over, the asset may resume growing to break the high at a.2487 and then reach 76.0% fibo and the fractal at 1.2499 and 1.2654 respectively.
Article By RoboForex.com
Attention!
Forecasts presented in this section only reflect the author’s private opinion and should not be considered as guidance for trading. RoboForex LP bears no responsibility for trading results based on trading recommendations described in these analytical reviews.

- The United States and Iran have signed a peace agreement – oil has fallen to 80 dollars per barrel. Jun 15, 2026
- COT Metals Charts: Speculator Bets led by Steel Jun 14, 2026
- COT Bonds Charts: Speculator Bets led by 2-Year Bonds & Ultra 10-Year Bonds Jun 14, 2026
- COT Energy Charts: Speculator Bets led by Brent Oil Jun 14, 2026
- COT Soft Commodities Charts: Weekly Speculator Bets led lower by Corn and Soybean Meal Jun 14, 2026
- Today investors’ focus is directed at the historic IPO of SpaceX Jun 12, 2026
- USD/JPY Continues Its Climb: Is There a Limit? Jun 11, 2026
- Investors launched broad profit‑taking in the technology sector. The Bank of Canada kept its rate at 2.25% Jun 11, 2026
- Gold (XAU/USD) Faces Persistent Selling Pressure Jun 10, 2026
- The US technology sector once again came under a wave of selling Jun 10, 2026