
Article By RoboForex.com
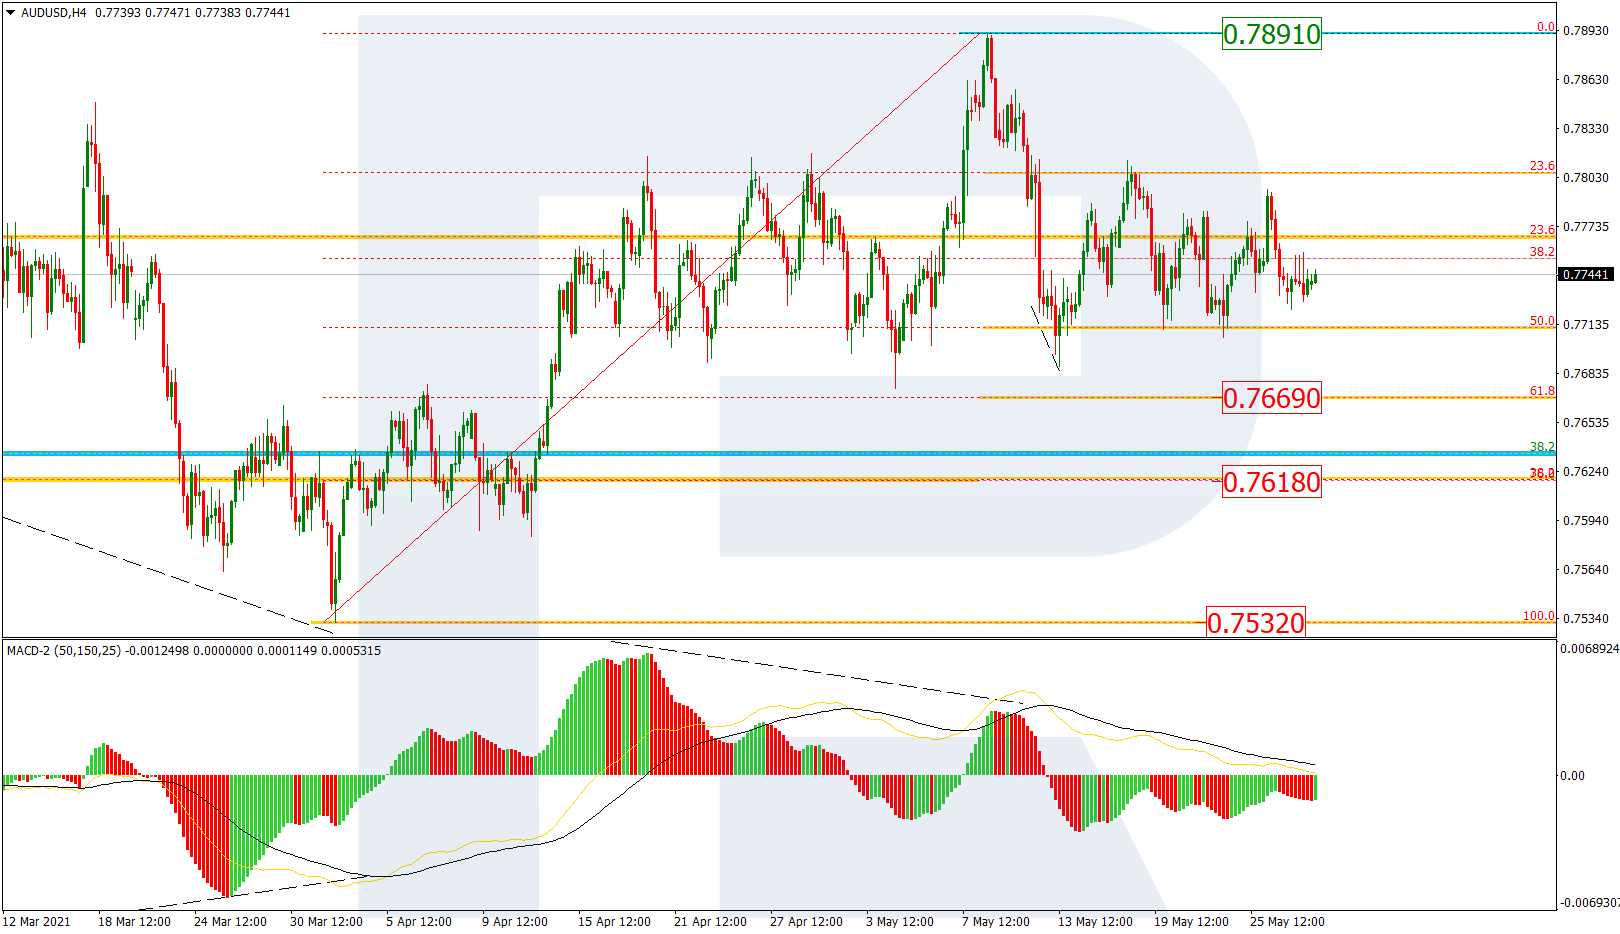
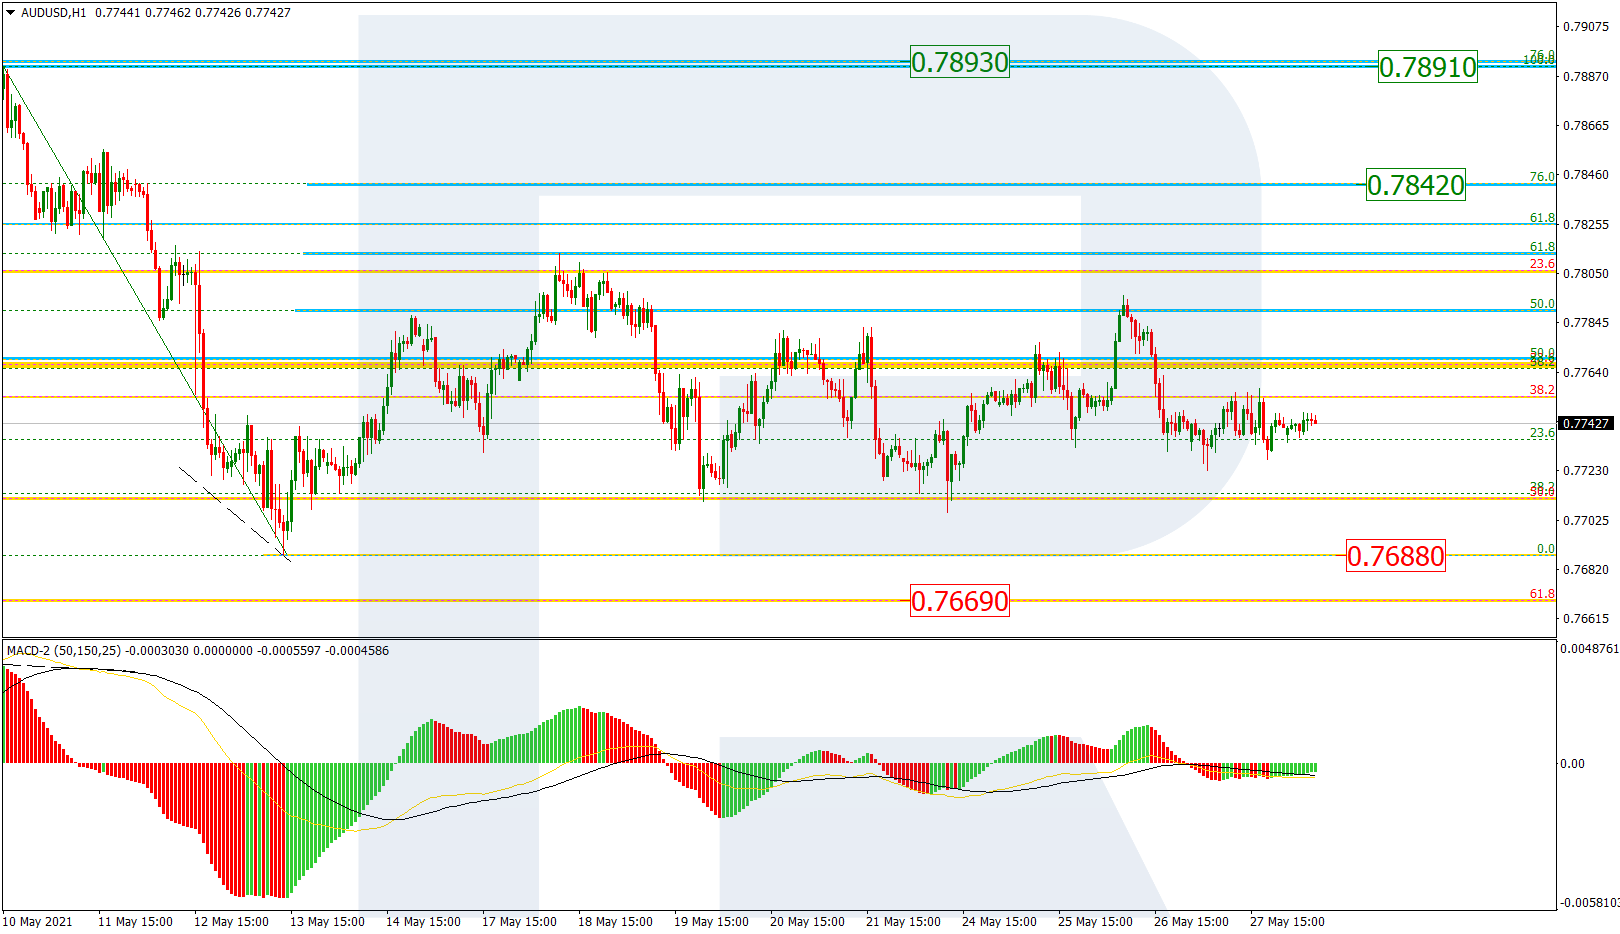
AUDUSD, “Australian Dollar vs US Dollar”
As we can see in the H4 chart, AUDUSD is still consolidating a divergence on MACD and, judging by the fact that the lows are slowly climbing down, may soon break this consolidation range to the downside. And if the first descending correctional wave earlier reached 50.0% fibo, then the next one may head towards 61.8% and 76.0% fibo at 0.7669 and 0.7618 respectively, as well as the low at 0.7532. However, one shouldn’t exclude a possibility of a further uptrend to reach the high at 0.7891.

The H1 chart of UADUSD shows a more detailed structure of the current consolidation. After growing and reaching 61.8% fibo, the pair is moving between the low at 0.7688 and 50.0% fibo. The next rising wave may head towards 76.0% fibo at 0.7842, a breakout of which, in its turn, may lead to a further uptrend to reach the high 0.7891 and the long-term 76.0% fibo at 0.7893. The most probable scenario for the nearest future implies a decline towards the low and 61.8% fibo at 0.7688 and 0.7669 respectively.
Free Reports:
 Download Our Metatrader 4 Indicators – Put Our Free MetaTrader 4 Custom Indicators on your charts when you join our Weekly Newsletter
 Get our Weekly Commitment of Traders Reports - See where the biggest traders (Hedge Funds and Commercial Hedgers) are positioned in the futures markets on a weekly basis.
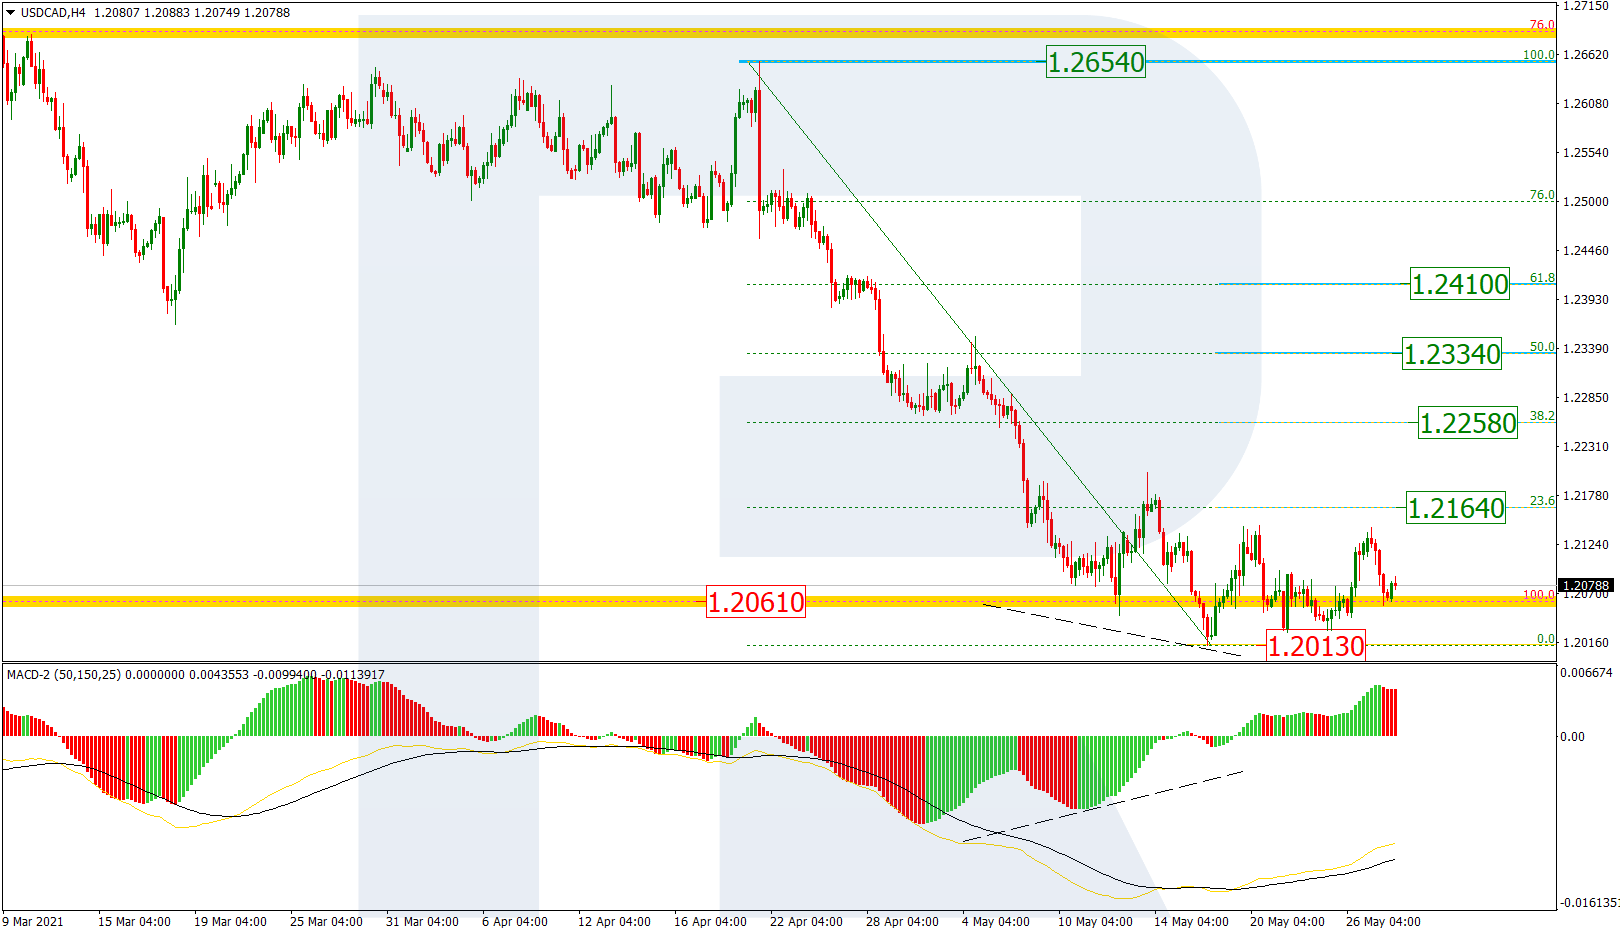
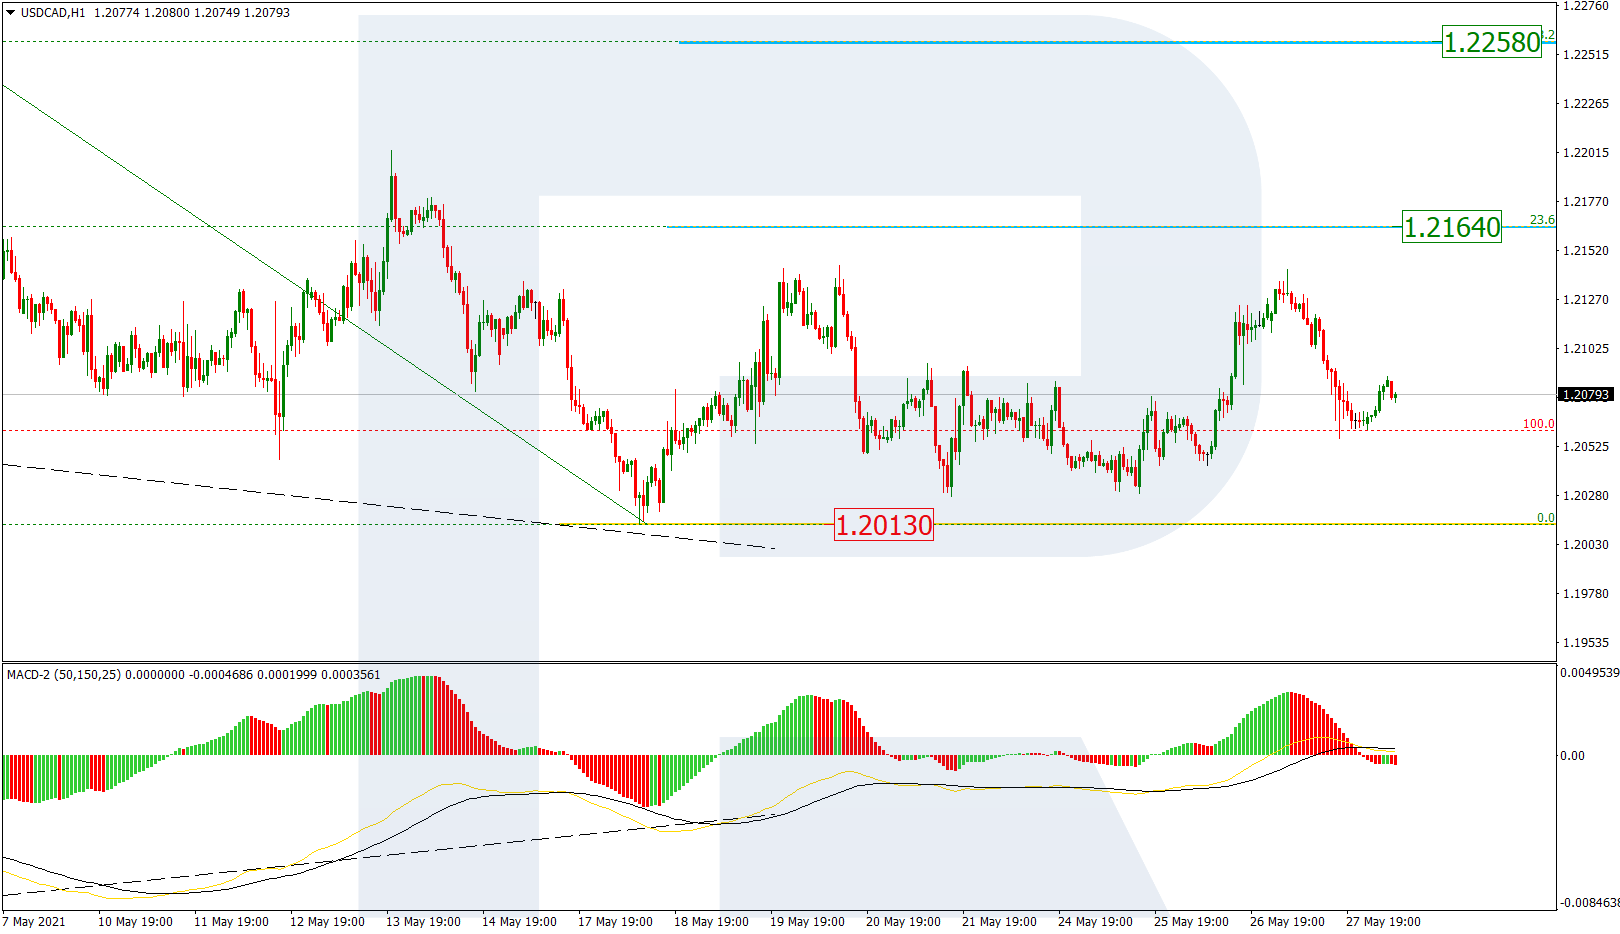
USDCAD, “US Dollar vs Canadian Dollar”
In the H4 chart, the pair is still testing the fractal at 1.2061. At the same time, there is a convergence on MACD, which made the price correct upwards and reach 23.6% but failed twice. After finally breaking this level, the asset may continue the correction towards 38.2%, 50.0%, and 61.8% fibo at 1.2258, 1.2334, and 1.2410 respectively. The support is the low at 1.2013.
As we can see in the H1 chart, USDCAD is moving sideways. So far, the price is stuck between the low and 23.6% fibo at 1.2013 and 1.2164 respectively.
Article By RoboForex.com
Attention!
Forecasts presented in this section only reflect the author’s private opinion and should not be considered as guidance for trading. RoboForex LP bears no responsibility for trading results based on trading recommendations described in these analytical reviews.

- The United States and Iran have signed a peace agreement – oil has fallen to 80 dollars per barrel. Jun 15, 2026
- COT Metals Charts: Speculator Bets led by Steel Jun 14, 2026
- COT Bonds Charts: Speculator Bets led by 2-Year Bonds & Ultra 10-Year Bonds Jun 14, 2026
- COT Energy Charts: Speculator Bets led by Brent Oil Jun 14, 2026
- COT Soft Commodities Charts: Weekly Speculator Bets led lower by Corn and Soybean Meal Jun 14, 2026
- Today investors’ focus is directed at the historic IPO of SpaceX Jun 12, 2026
- USD/JPY Continues Its Climb: Is There a Limit? Jun 11, 2026
- Investors launched broad profit‑taking in the technology sector. The Bank of Canada kept its rate at 2.25% Jun 11, 2026
- Gold (XAU/USD) Faces Persistent Selling Pressure Jun 10, 2026
- The US technology sector once again came under a wave of selling Jun 10, 2026