
Article By RoboForex.com
AUDUSD, “Australian Dollar vs US Dollar”
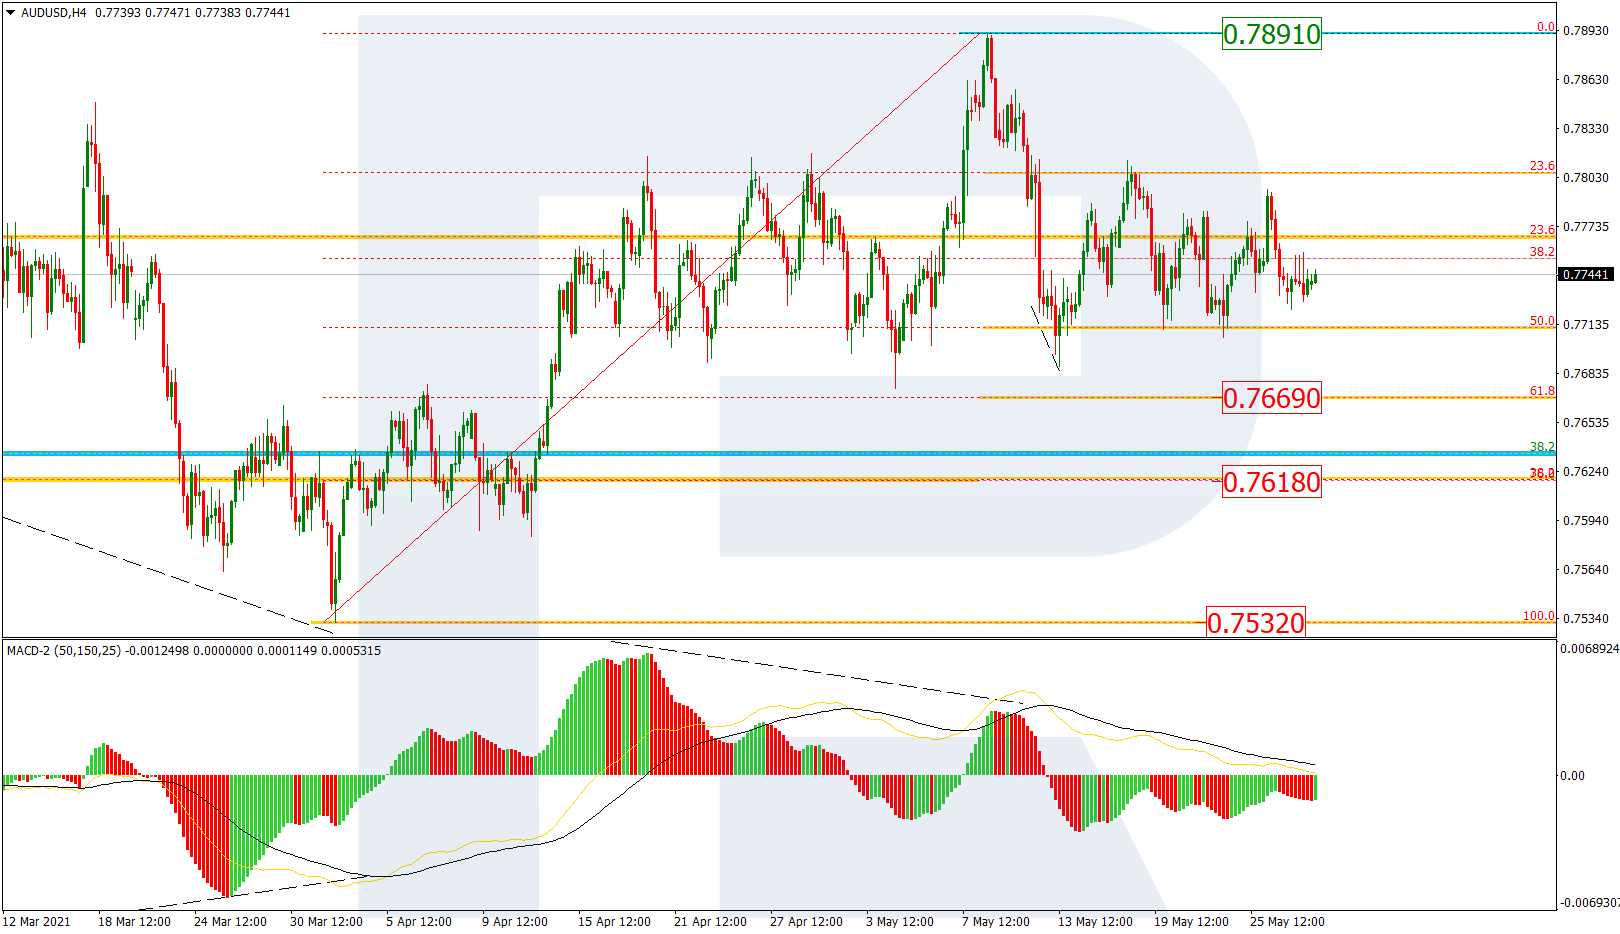
As we can see in the H4 chart, AUDUSD is still consolidating a divergence on MACD and, judging by the fact that the lows are slowly climbing down, may soon break this consolidation range to the downside. And if the first descending correctional wave earlier reached 50.0% fibo, then the next one may head towards 61.8% and 76.0% fibo at 0.7669 and 0.7618 respectively, as well as the low at 0.7532. However, one shouldn’t exclude a possibility of a further uptrend to reach the high at 0.7891.

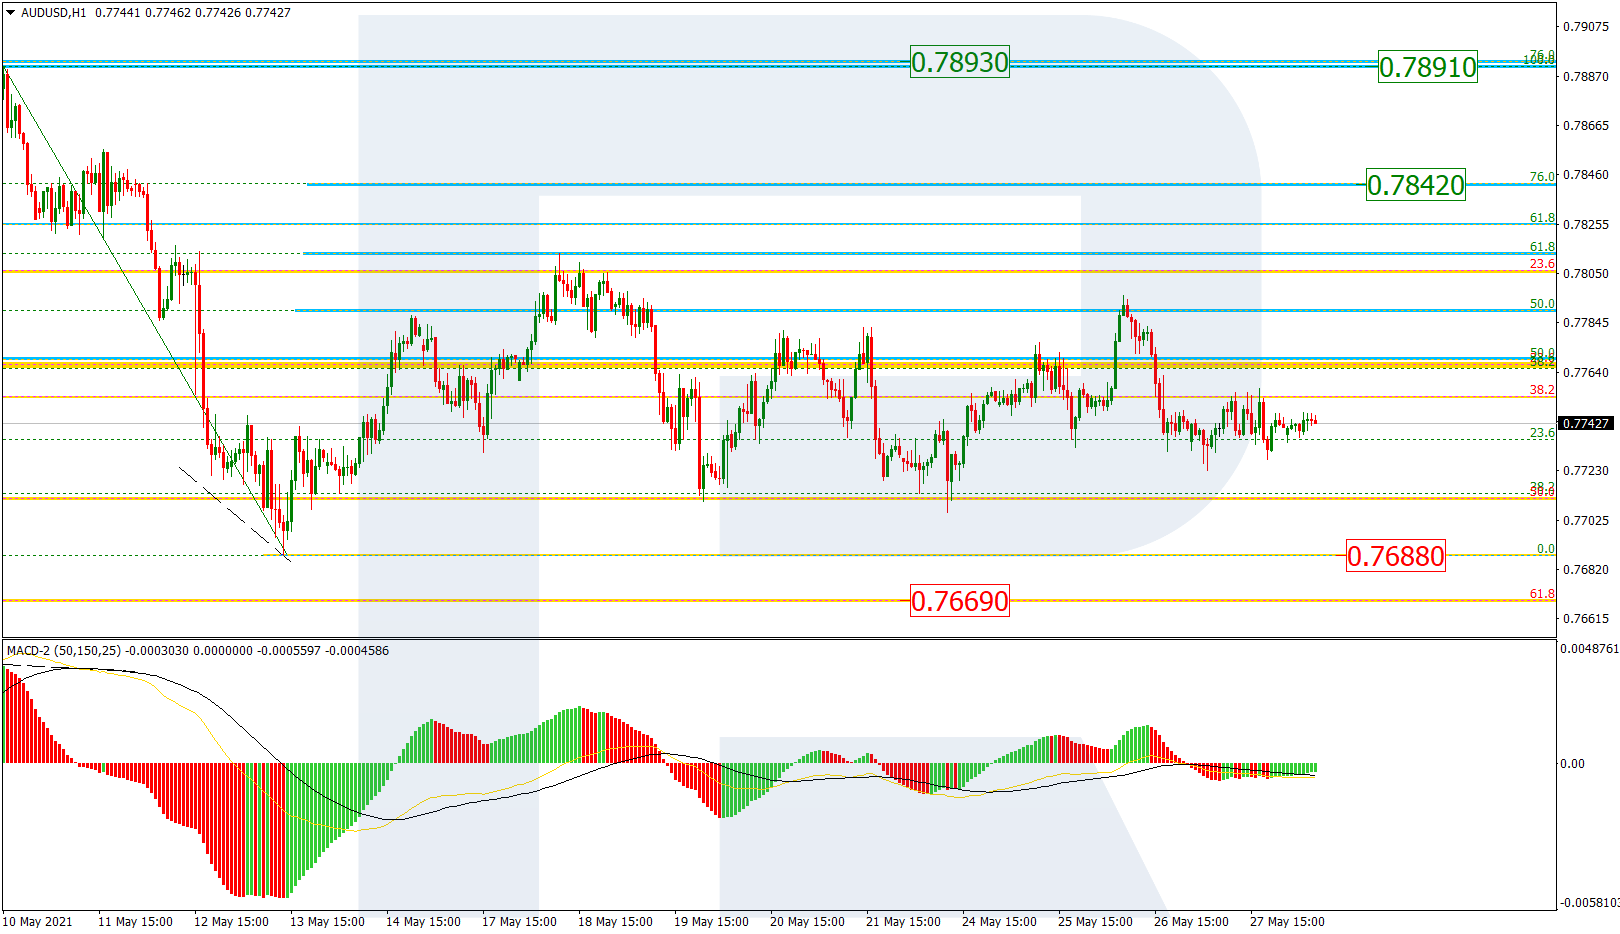
The H1 chart of UADUSD shows a more detailed structure of the current consolidation. After growing and reaching 61.8% fibo, the pair is moving between the low at 0.7688 and 50.0% fibo. The next rising wave may head towards 76.0% fibo at 0.7842, a breakout of which, in its turn, may lead to a further uptrend to reach the high 0.7891 and the long-term 76.0% fibo at 0.7893. The most probable scenario for the nearest future implies a decline towards the low and 61.8% fibo at 0.7688 and 0.7669 respectively.
Free Reports:
 Download Our Metatrader 4 Indicators – Put Our Free MetaTrader 4 Custom Indicators on your charts when you join our Weekly Newsletter
 Get our Weekly Commitment of Traders Reports - See where the biggest traders (Hedge Funds and Commercial Hedgers) are positioned in the futures markets on a weekly basis.
USDCAD, “US Dollar vs Canadian Dollar”
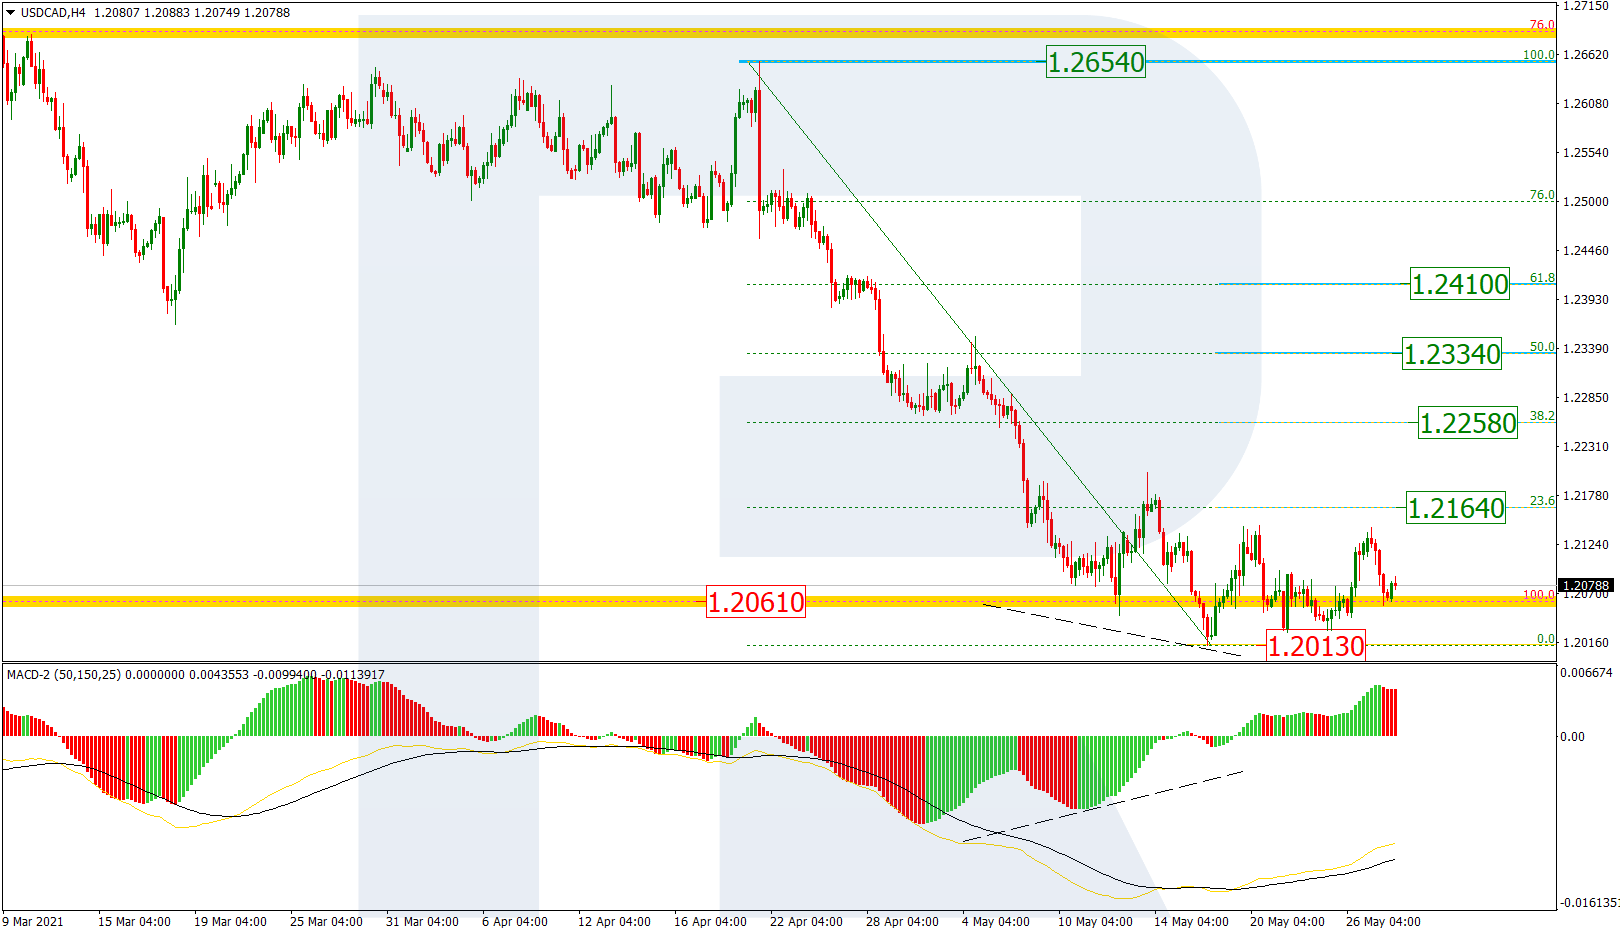
In the H4 chart, the pair is still testing the fractal at 1.2061. At the same time, there is a convergence on MACD, which made the price correct upwards and reach 23.6% but failed twice. After finally breaking this level, the asset may continue the correction towards 38.2%, 50.0%, and 61.8% fibo at 1.2258, 1.2334, and 1.2410 respectively. The support is the low at 1.2013.
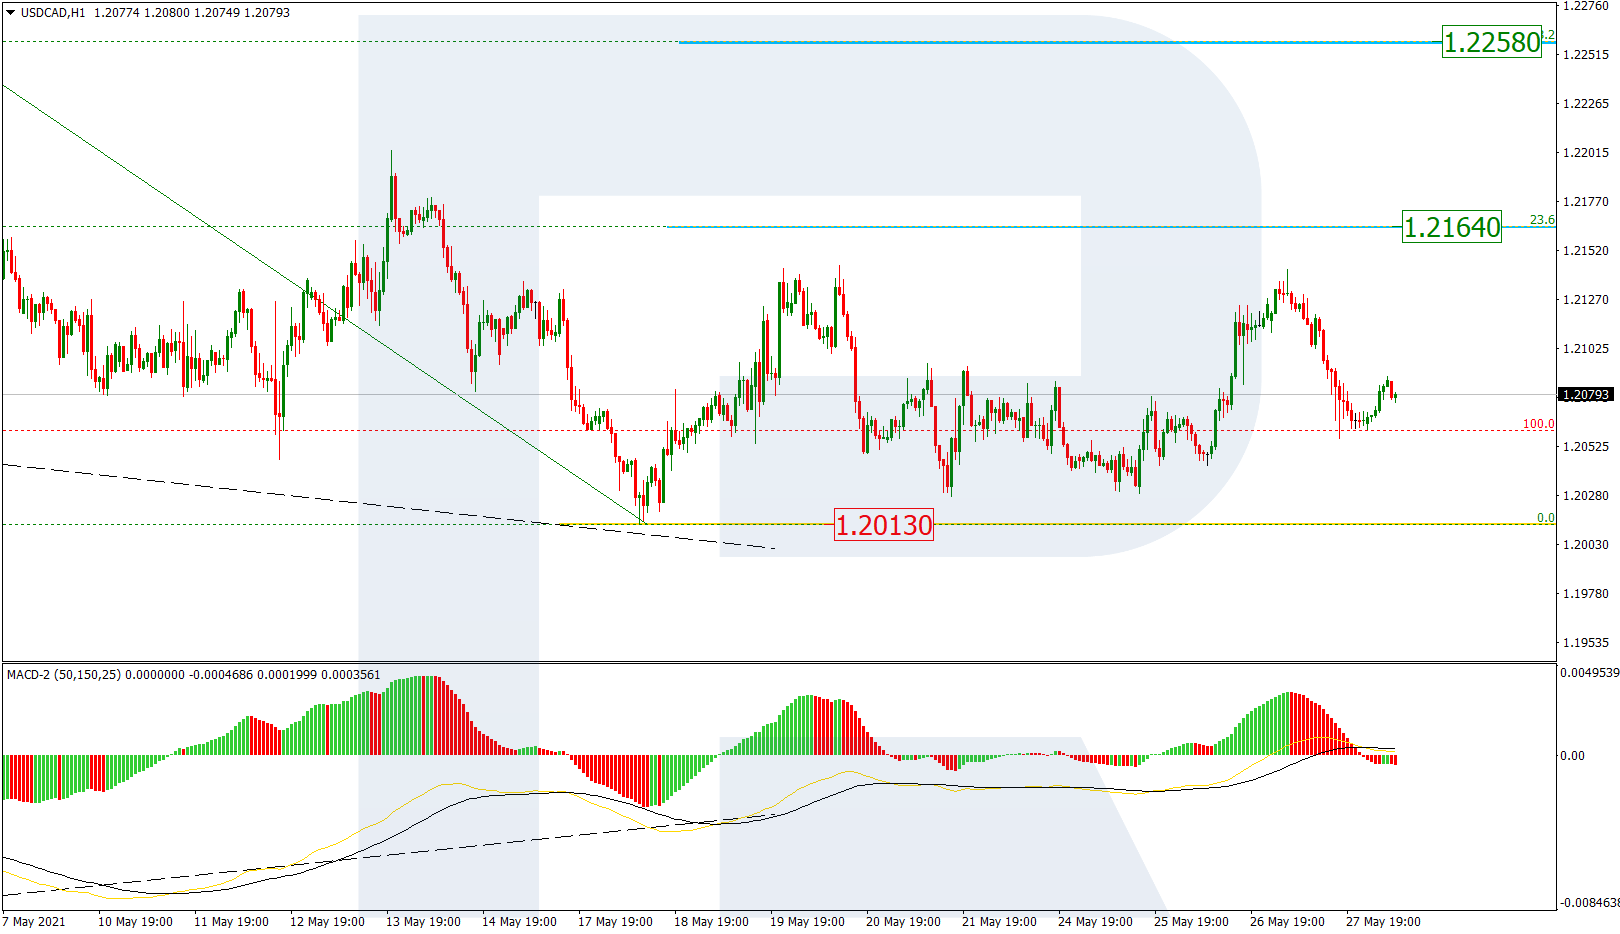
As we can see in the H1 chart, USDCAD is moving sideways. So far, the price is stuck between the low and 23.6% fibo at 1.2013 and 1.2164 respectively.
Article By RoboForex.com
Attention!
Forecasts presented in this section only reflect the author’s private opinion and should not be considered as guidance for trading. RoboForex LP bears no responsibility for trading results based on trading recommendations described in these analytical reviews.

- RoboForex Brings Full-Scale Trading to Telegram Jul 7, 2026
- Your Bourse Integrates TradingView Charts and Trading Platform Library with Trade Server Jul 7, 2026
- Yen Still Under Pressure: Markets Await Action from Authorities Jul 7, 2026
- Germany’s DAX Index has updated its all‑time high. OPEC+ countries have agreed to increase production Jul 7, 2026
- Oil prices have stabilized. The Canadian dollar continues to trade near yearly lows. Jul 6, 2026
- EUR/USD in a Narrow Range: Focus on Fed Minutes Jul 6, 2026
- Oil prices have fallen to pre‑war levels. AI companies continue to sell off Jul 3, 2026
- Gold Rises Sharply as Markets Reassess Fed Rate Outlook Jul 3, 2026
- The Eurozone has shown a significant slowdown in inflation. Australia has recorded its largest trade deficit since 2015 Jul 2, 2026
- Natural gas prices are rising amid increasing electricity consumption Jul 1, 2026