
By CountingPips.com COT Home | Data Tables | Data Downloads | Newsletter
Here are the latest charts and statistics for the Commitment of Traders (COT) data published by the Commodities Futures Trading Commission (CFTC).
The latest COT data is updated through Tuesday April 20 2021 and shows a quick view of how large traders (for-profit speculators and commercial entities) were positioned in the futures markets.
Gold Comex Futures Futures:

The Gold Comex Futures large speculator standing this week reached a net position of 181,498 contracts in the data reported through Tuesday. This was a weekly advance of 624 contracts from the previous week which had a total of 180,874 net contracts.
This week’s current strength score (the trader positioning range over the past three years, measured from 0 to 100) shows the speculators are currently Bullish with a score of 56.1 percent. The commercials are Bearish with a score of 41.9 percent and the small traders (not shown in chart) are Bullish with a score of 60.5 percent.
| Gold Futures Statistics | SPECULATORS | COMMERCIALS | SMALL TRADERS |
| – Percent of Open Interest Longs: | 58.5 | 21.4 | 10.7 |
| – Percent of Open Interest Shorts: | 20.0 | 66.6 | 4.0 |
| – Net Position: | 181,498 | -213,193 | 31,695 |
| – Gross Longs: | 275,985 | 100,905 | 50,373 |
| – Gross Shorts: | 94,487 | 314,098 | 18,678 |
| – Long to Short Ratio: | 2.9 to 1 | 0.3 to 1 | 2.7 to 1 |
| NET POSITION TREND: | |||
| – COT Index Score (3 Year Range Pct): | 56.1 | 41.9 | 60.5 |
| – COT Index Reading (3 Year Range): | Bullish | Bearish | Bullish |
| NET POSITION MOVEMENT INDEX: | |||
| – 6-Week Change in Strength Index: | 1.6 | -1.3 | -2.5 |
Free Reports:
 Get our Weekly Commitment of Traders Reports - See where the biggest traders (Hedge Funds and Commercial Hedgers) are positioned in the futures markets on a weekly basis.
 Sign Up for Our Stock Market Newsletter – Get updated on News, Charts & Rankings of Public Companies when you join our Stocks Newsletter
Silver Comex Futures Futures:

The Silver Comex Futures large speculator standing this week reached a net position of 41,681 contracts in the data reported through Tuesday. This was a weekly lift of 5,257 contracts from the previous week which had a total of 36,424 net contracts.
This week’s current strength score (the trader positioning range over the past three years, measured from 0 to 100) shows the speculators are currently Bullish with a score of 66.1 percent. The commercials are Bearish with a score of 34.4 percent and the small traders (not shown in chart) are Bullish with a score of 54.4 percent.
| Silver Futures Statistics | SPECULATORS | COMMERCIALS | SMALL TRADERS |
| – Percent of Open Interest Longs: | 44.4 | 31.7 | 17.9 |
| – Percent of Open Interest Shorts: | 19.8 | 67.7 | 6.4 |
| – Net Position: | 41,681 | -61,117 | 19,436 |
| – Gross Longs: | 75,167 | 53,628 | 30,326 |
| – Gross Shorts: | 33,486 | 114,745 | 10,890 |
| – Long to Short Ratio: | 2.2 to 1 | 0.5 to 1 | 2.8 to 1 |
| NET POSITION TREND: | |||
| – COT Index Score (3 Year Range Pct): | 66.1 | 34.4 | 54.4 |
| – COT Index Reading (3 Year Range): | Bullish | Bearish | Bullish |
| NET POSITION MOVEMENT INDEX: | |||
| – 6-Week Change in Strength Index: | 5.2 | -5.2 | 2.5 |
Copper Grade #1 Futures Futures:
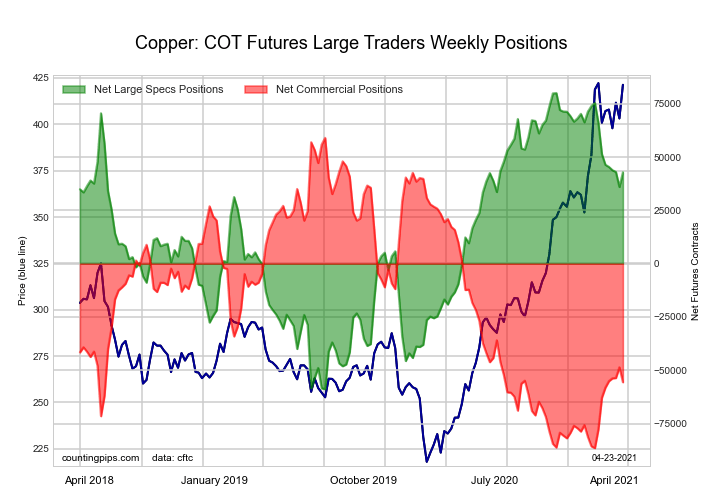
The Copper Grade #1 Futures large speculator standing this week reached a net position of 42,863 contracts in the data reported through Tuesday. This was a weekly lift of 6,868 contracts from the previous week which had a total of 35,995 net contracts.
This week’s current strength score (the trader positioning range over the past three years, measured from 0 to 100) shows the speculators are currently Bullish with a score of 73.2 percent. The commercials are Bearish with a score of 21.2 percent and the small traders (not shown in chart) are Bullish-Extreme with a score of 100.0 percent.
| Copper Futures Statistics | SPECULATORS | COMMERCIALS | SMALL TRADERS |
| – Percent of Open Interest Longs: | 44.2 | 29.9 | 10.2 |
| – Percent of Open Interest Shorts: | 27.0 | 52.3 | 5.0 |
| – Net Position: | 42,863 | -55,616 | 12,753 |
| – Gross Longs: | 109,912 | 74,326 | 25,244 |
| – Gross Shorts: | 67,049 | 129,942 | 12,491 |
| – Long to Short Ratio: | 1.6 to 1 | 0.6 to 1 | 2.0 to 1 |
| NET POSITION TREND: | |||
| – COT Index Score (3 Year Range Pct): | 73.2 | 21.2 | 100.0 |
| – COT Index Reading (3 Year Range): | Bullish | Bearish | Bullish-Extreme |
| NET POSITION MOVEMENT INDEX: | |||
| – 6-Week Change in Strength Index: | -6.1 | 5.0 | 7.5 |
Platinum Futures Futures:

The Platinum Futures large speculator standing this week reached a net position of 25,685 contracts in the data reported through Tuesday. This was a weekly increase of 1,053 contracts from the previous week which had a total of 24,632 net contracts.
This week’s current strength score (the trader positioning range over the past three years, measured from 0 to 100) shows the speculators are currently Bearish with a score of 47.3 percent. The commercials are Bullish with a score of 51.0 percent and the small traders (not shown in chart) are Bullish-Extreme with a score of 87.0 percent.
| Platinum Futures Statistics | SPECULATORS | COMMERCIALS | SMALL TRADERS |
| – Percent of Open Interest Longs: | 58.5 | 18.6 | 16.6 |
| – Percent of Open Interest Shorts: | 18.1 | 72.7 | 2.8 |
| – Net Position: | 25,685 | -34,420 | 8,735 |
| – Gross Longs: | 37,215 | 11,841 | 10,538 |
| – Gross Shorts: | 11,530 | 46,261 | 1,803 |
| – Long to Short Ratio: | 3.2 to 1 | 0.3 to 1 | 5.8 to 1 |
| NET POSITION TREND: | |||
| – COT Index Score (3 Year Range Pct): | 47.3 | 51.0 | 87.0 |
| – COT Index Reading (3 Year Range): | Bearish | Bullish | Bullish-Extreme |
| NET POSITION MOVEMENT INDEX: | |||
| – 6-Week Change in Strength Index: | -3.0 | 2.9 | -0.1 |
Palladium Futures Futures:
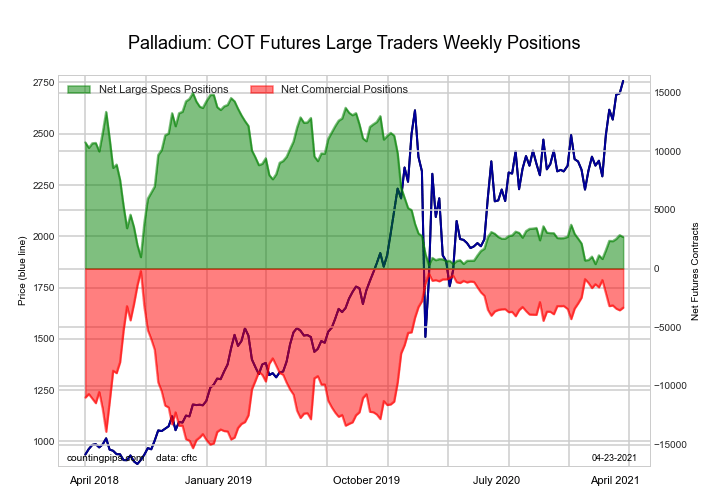
The Palladium Futures large speculator standing this week reached a net position of 2,695 contracts in the data reported through Tuesday. This was a weekly fall of -158 contracts from the previous week which had a total of 2,853 net contracts.
This week’s current strength score (the trader positioning range over the past three years, measured from 0 to 100) shows the speculators are currently Bearish-Extreme with a score of 16.4 percent. The commercials are Bullish with a score of 79.3 percent and the small traders (not shown in chart) are Bullish-Extreme with a score of 82.1 percent.
| Palladium Futures Statistics | SPECULATORS | COMMERCIALS | SMALL TRADERS |
| – Percent of Open Interest Longs: | 50.5 | 31.8 | 12.6 |
| – Percent of Open Interest Shorts: | 27.4 | 60.4 | 7.1 |
| – Net Position: | 2,695 | -3,329 | 634 |
| – Gross Longs: | 5,887 | 3,706 | 1,464 |
| – Gross Shorts: | 3,192 | 7,035 | 830 |
| – Long to Short Ratio: | 1.8 to 1 | 0.5 to 1 | 1.8 to 1 |
| NET POSITION TREND: | |||
| – COT Index Score (3 Year Range Pct): | 16.4 | 79.3 | 82.1 |
| – COT Index Reading (3 Year Range): | Bearish-Extreme | Bullish | Bullish-Extreme |
| NET POSITION MOVEMENT INDEX: | |||
| – 6-Week Change in Strength Index: | 12.7 | -15.6 | 28.3 |
Article By CountingPips.com – Receive our weekly COT Reports by Email
*COT Report: The COT data, released weekly to the public each Friday, is updated through the most recent Tuesday (data is 3 days old) and shows a quick view of how large speculators or non-commercials (for-profit traders) were positioned in the futures markets.
The CFTC categorizes trader positions according to commercial hedgers (traders who use futures contracts for hedging as part of the business), non-commercials (large traders who speculate to realize trading profits) and nonreportable traders (usually small traders/speculators).
Find CFTC criteria here: (http://www.cftc.gov/MarketReports/CommitmentsofTraders/ExplanatoryNotes/index.htm).

- USD/JPY Continues Its Climb: Is There a Limit? Jun 11, 2026
- Investors launched broad profit‑taking in the technology sector. The Bank of Canada kept its rate at 2.25% Jun 11, 2026
- Gold (XAU/USD) Faces Persistent Selling Pressure Jun 10, 2026
- The US technology sector once again came under a wave of selling Jun 10, 2026
- China has shifted to using its own strategic oil reserves Jun 9, 2026
- GBP/USD Remains Under Pressure Despite Attempts to Recover Jun 9, 2026
- SpaceX IPO: Set for $75 billion liftoff Jun 8, 2026
- On Friday, the American stock market experienced one of the strongest crashes in recent times Jun 8, 2026
- EUR/USD at April Lows: What’s Next for the Pair? Jun 8, 2026
- The ceasefire between Israel and Lebanon has reduced the geopolitical premium Jun 5, 2026