
By CountingPips.com COT Home | Data Tables | Data Downloads | Newsletter
Here are the latest charts and statistics for the Commitment of Traders (COT) data published by the Commodities Futures Trading Commission (CFTC).
The latest COT data is updated through Tuesday April 20 2021 and shows a quick view of how large traders (for-profit speculators and commercial entities) were positioned in the futures markets.
WTI Crude Oil Futures Futures:
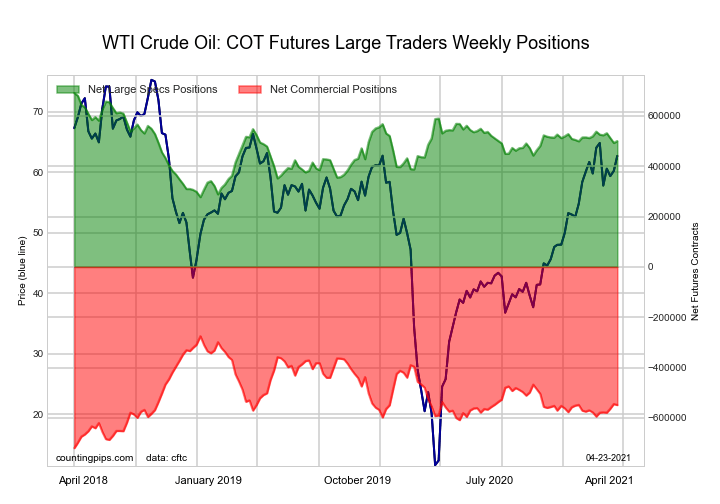
The WTI Crude Oil Futures large speculator standing this week resulted in a net position of 499,983 contracts in the data reported through Tuesday. This was a weekly gain of 7,305 contracts from the previous week which had a total of 492,678 net contracts.
This week’s current strength score (the trader positioning range over the past three years, measured from 0 to 100) shows the speculators are currently Bullish with a score of 53.9 percent. The commercials are Bearish with a score of 38.5 percent and the small traders (not shown in chart) are Bullish-Extreme with a score of 84.2 percent.
Free Reports:
 Download Our Metatrader 4 Indicators – Put Our Free MetaTrader 4 Custom Indicators on your charts when you join our Weekly Newsletter
 Get our Weekly Commitment of Traders Reports - See where the biggest traders (Hedge Funds and Commercial Hedgers) are positioned in the futures markets on a weekly basis.
| WTI Crude Oil Futures Statistics | SPECULATORS | COMMERCIALS | SMALL TRADERS |
| – Percent of Open Interest Longs: | 27.7 | 35.2 | 4.4 |
| – Percent of Open Interest Shorts: | 6.4 | 58.6 | 2.3 |
| – Net Position: | 499,983 | -548,874 | 48,891 |
| – Gross Longs: | 650,867 | 826,122 | 102,805 |
| – Gross Shorts: | 150,884 | 1,374,996 | 53,914 |
| – Long to Short Ratio: | 4.3 to 1 | 0.6 to 1 | 1.9 to 1 |
| NET POSITION TREND: | |||
| – COT Index Score (3 Year Range Pct): | 53.9 | 38.5 | 84.2 |
| – COT Index Reading (3 Year Range): | Bullish | Bearish | Bullish-Extreme |
| NET POSITION MOVEMENT INDEX: | |||
| – 6-Week Change in Strength Index: | -9.1 | 10.3 | -11.7 |
Brent Crude Oil Futures Futures:

The Brent Crude Oil Futures large speculator standing this week resulted in a net position of -26,711 contracts in the data reported through Tuesday. This was a weekly advance of 326 contracts from the previous week which had a total of -27,037 net contracts.
This week’s current strength score (the trader positioning range over the past three years, measured from 0 to 100) shows the speculators are currently Bullish with a score of 67.2 percent. The commercials are Bearish with a score of 31.9 percent and the small traders (not shown in chart) are Bearish with a score of 43.9 percent.
| Brent Crude Oil Futures Statistics | SPECULATORS | COMMERCIALS | SMALL TRADERS |
| – Percent of Open Interest Longs: | 17.3 | 45.9 | 4.7 |
| – Percent of Open Interest Shorts: | 30.0 | 34.7 | 3.2 |
| – Net Position: | -26,711 | 23,565 | 3,146 |
| – Gross Longs: | 36,462 | 96,687 | 9,903 |
| – Gross Shorts: | 63,173 | 73,122 | 6,757 |
| – Long to Short Ratio: | 0.6 to 1 | 1.3 to 1 | 1.5 to 1 |
| NET POSITION TREND: | |||
| – COT Index Score (3 Year Range Pct): | 67.2 | 31.9 | 43.9 |
| – COT Index Reading (3 Year Range): | Bullish | Bearish | Bearish |
| NET POSITION MOVEMENT INDEX: | |||
| – 6-Week Change in Strength Index: | -10.3 | 7.4 | 10.1 |
Natural Gas Futures Futures:
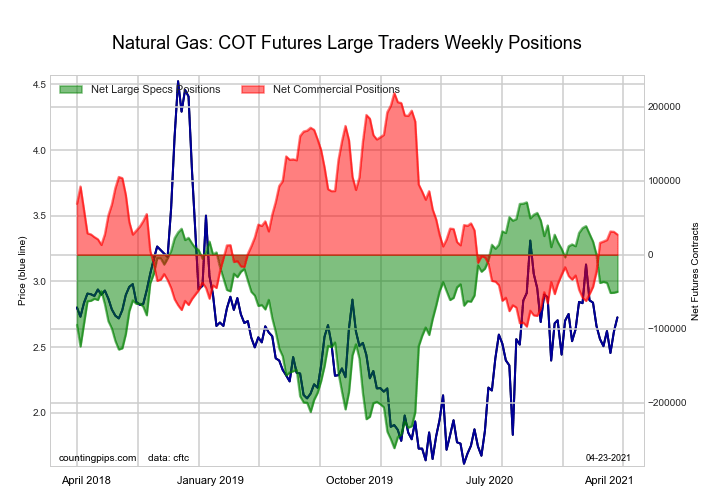
The Natural Gas Futures large speculator standing this week resulted in a net position of -50,082 contracts in the data reported through Tuesday. This was a weekly boost of 1,194 contracts from the previous week which had a total of -51,276 net contracts.
This week’s current strength score (the trader positioning range over the past three years, measured from 0 to 100) shows the speculators are currently Bullish with a score of 63.6 percent. The commercials are Bearish with a score of 39.4 percent and the small traders (not shown in chart) are Bearish with a score of 20.3 percent.
| Natural Gas Futures Statistics | SPECULATORS | COMMERCIALS | SMALL TRADERS |
| – Percent of Open Interest Longs: | 20.8 | 42.8 | 4.8 |
| – Percent of Open Interest Shorts: | 25.0 | 40.5 | 2.9 |
| – Net Position: | -50,082 | 27,301 | 22,781 |
| – Gross Longs: | 245,628 | 507,193 | 57,176 |
| – Gross Shorts: | 295,710 | 479,892 | 34,395 |
| – Long to Short Ratio: | 0.8 to 1 | 1.1 to 1 | 1.7 to 1 |
| NET POSITION TREND: | |||
| – COT Index Score (3 Year Range Pct): | 63.6 | 39.4 | 20.3 |
| – COT Index Reading (3 Year Range): | Bullish | Bearish | Bearish |
| NET POSITION MOVEMENT INDEX: | |||
| – 6-Week Change in Strength Index: | -15.1 | 15.8 | 0.3 |
Gasoline Blendstock Futures Futures:
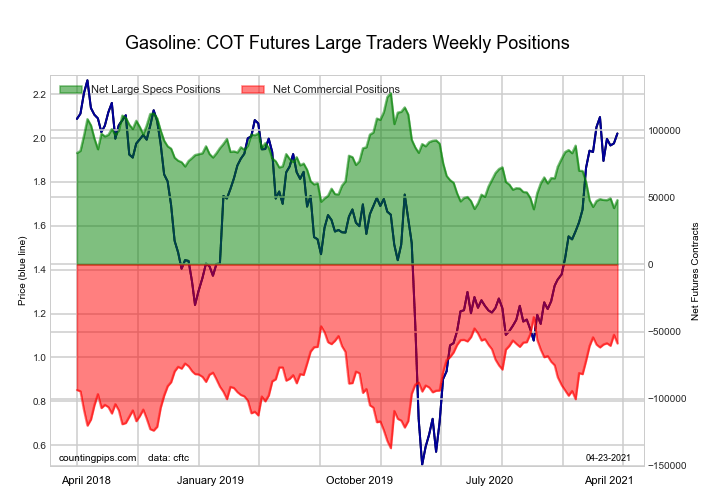
The Gasoline Blendstock Futures large speculator standing this week resulted in a net position of 48,021 contracts in the data reported through Tuesday. This was a weekly lift of 5,987 contracts from the previous week which had a total of 42,034 net contracts.
This week’s current strength score (the trader positioning range over the past three years, measured from 0 to 100) shows the speculators are currently Bearish-Extreme with a score of 7.9 percent. The commercials are Bullish with a score of 79.9 percent and the small traders (not shown in chart) are Bullish with a score of 76.3 percent.
| Nasdaq Mini Futures Statistics | SPECULATORS | COMMERCIALS | SMALL TRADERS |
| – Percent of Open Interest Longs: | 23.9 | 47.1 | 6.6 |
| – Percent of Open Interest Shorts: | 11.6 | 62.2 | 3.8 |
| – Net Position: | 48,021 | -58,855 | 10,834 |
| – Gross Longs: | 93,054 | 183,094 | 25,546 |
| – Gross Shorts: | 45,033 | 241,949 | 14,712 |
| – Long to Short Ratio: | 2.1 to 1 | 0.8 to 1 | 1.7 to 1 |
| NET POSITION TREND: | |||
| – COT Index Score (3 Year Range Pct): | 7.9 | 79.9 | 76.3 |
| – COT Index Reading (3 Year Range): | Bearish-Extreme | Bullish | Bullish |
| NET POSITION MOVEMENT INDEX: | |||
| – 6-Week Change in Strength Index: | 0.8 | 0.9 | -9.2 |
#2 Heating Oil NY-Harbor Futures Futures:
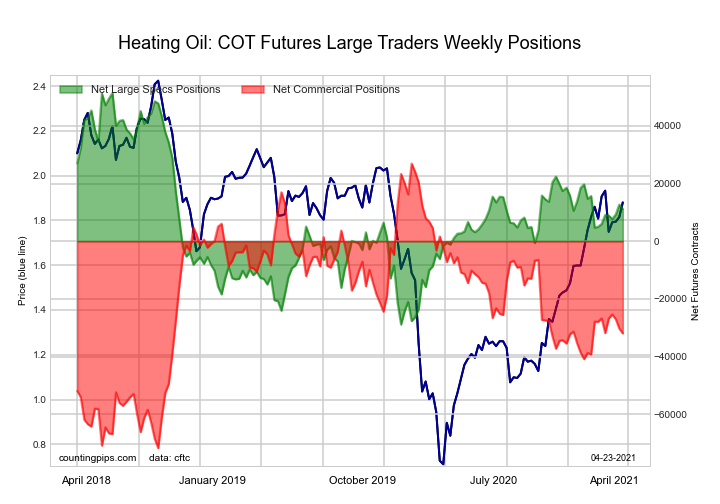
The #2 Heating Oil NY-Harbor Futures large speculator standing this week resulted in a net position of 11,157 contracts in the data reported through Tuesday. This was a weekly lowering of -1,545 contracts from the previous week which had a total of 12,702 net contracts.
This week’s current strength score (the trader positioning range over the past three years, measured from 0 to 100) shows the speculators are currently Bearish with a score of 49.9 percent. The commercials are Bearish with a score of 40.3 percent and the small traders (not shown in chart) are Bullish-Extreme with a score of 83.1 percent.
| Heating Oil Futures Statistics | SPECULATORS | COMMERCIALS | SMALL TRADERS |
| – Percent of Open Interest Longs: | 16.4 | 48.3 | 11.4 |
| – Percent of Open Interest Shorts: | 13.6 | 56.3 | 6.2 |
| – Net Position: | 11,157 | -31,912 | 20,755 |
| – Gross Longs: | 65,411 | 193,124 | 45,422 |
| – Gross Shorts: | 54,254 | 225,036 | 24,667 |
| – Long to Short Ratio: | 1.2 to 1 | 0.9 to 1 | 1.8 to 1 |
| NET POSITION TREND: | |||
| – COT Index Score (3 Year Range Pct): | 49.9 | 40.3 | 83.1 |
| – COT Index Reading (3 Year Range): | Bearish | Bearish | Bullish-Extreme |
| NET POSITION MOVEMENT INDEX: | |||
| – 6-Week Change in Strength Index: | 6.4 | -5.3 | 0.3 |
Bloomberg Commodity Index Futures Futures:
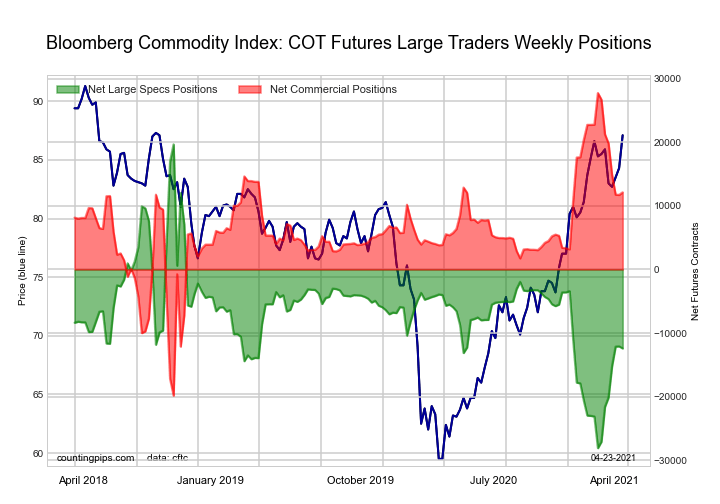
The Bloomberg Commodity Index Futures large speculator standing this week resulted in a net position of -12,426 contracts in the data reported through Tuesday. This was a weekly decline of -325 contracts from the previous week which had a total of -12,101 net contracts.
This week’s current strength score (the trader positioning range over the past three years, measured from 0 to 100) shows the speculators are currently Bearish with a score of 32.8 percent. The commercials are Bullish with a score of 67.2 percent and the small traders (not shown in chart) are Bullish with a score of 64.3 percent.
| Bloomberg Index Futures Statistics | SPECULATORS | COMMERCIALS | SMALL TRADERS |
| – Percent of Open Interest Longs: | 50.3 | 48.1 | 1.1 |
| – Percent of Open Interest Shorts: | 87.3 | 12.0 | 0.2 |
| – Net Position: | -12,426 | 12,124 | 302 |
| – Gross Longs: | 16,908 | 16,164 | 370 |
| – Gross Shorts: | 29,334 | 4,040 | 68 |
| – Long to Short Ratio: | 0.6 to 1 | 4.0 to 1 | 5.4 to 1 |
| NET POSITION TREND: | |||
| – COT Index Score (3 Year Range Pct): | 32.8 | 67.2 | 64.3 |
| – COT Index Reading (3 Year Range): | Bearish | Bullish | Bullish |
| NET POSITION MOVEMENT INDEX: | |||
| – 6-Week Change in Strength Index: | 30.7 | -30.6 | -7.3 |
Article By CountingPips.com – Receive our weekly COT Reports by Email
*COT Report: The COT data, released weekly to the public each Friday, is updated through the most recent Tuesday (data is 3 days old) and shows a quick view of how large speculators or non-commercials (for-profit traders) were positioned in the futures markets.
The CFTC categorizes trader positions according to commercial hedgers (traders who use futures contracts for hedging as part of the business), non-commercials (large traders who speculate to realize trading profits) and nonreportable traders (usually small traders/speculators).
Find CFTC criteria here: (http://www.cftc.gov/MarketReports/CommitmentsofTraders/ExplanatoryNotes/index.htm).

- Bitcoin rose to $66,000. The New Zealand dollar continues to strengthen Jul 22, 2026
- Inflationary pressure is easing in Canada. In New Zealand, on the contrary, inflation is rising Jul 21, 2026
- GBP/USD Falls After Cabinet Changes Jul 21, 2026
- Geopolitical and macroeconomic conditions continue to pressure market sentiment Jul 20, 2026
- USD/JPY Poised to Continue Gains as Expensive Oil and Lack of Support Weigh on Yen Jul 20, 2026
- COT Metals Charts: Weekly Speculator Bets led by Copper & Steel Jul 18, 2026
- COT Bonds Charts: Weekly Speculator Bets led by 2-Year, SOFR 3M & 5-Year Bonds Jul 18, 2026
- COT Energy Charts: Weekly Speculator Bets led by Brent Oil & Heating Oil Jul 18, 2026
- COT Soft Commodities Charts: Weekly Speculator Bets led by Wheat, Corn & Soybean Meal Jul 18, 2026
- The Bank of Canada kept its interest rate unchanged. Platinum prices reached a three‑week high Jul 16, 2026