
Article By RoboForex.com
Brent
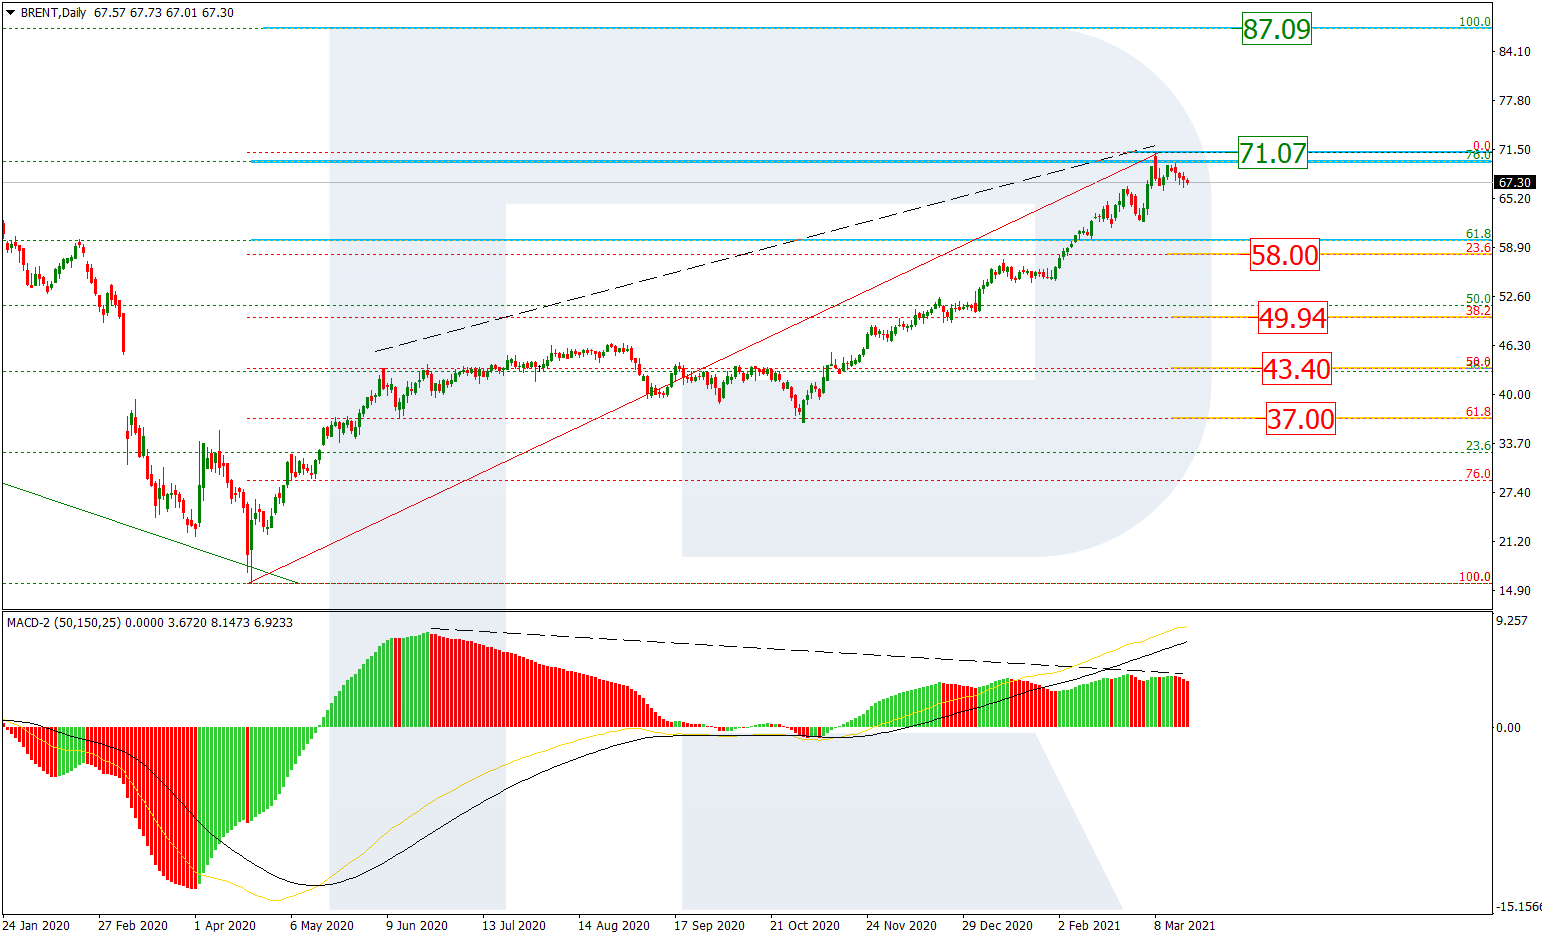
The daily chart shows a long-term ascending tendency, which still seems pretty stable. However, one should note that after reaching the long-term 76.0% fibo, Brent has started a new short-term pullback, which may transform into a proper downtrend towards 23.6%, 38.2%, 50.0%, and 61.8% fibo at 58.00, 49.94, 43.40, and 37.00 respectively. A breakout of the high at 71.07 may complete the correction and lead to a further uptrend to reach the fractal high at 87.09.

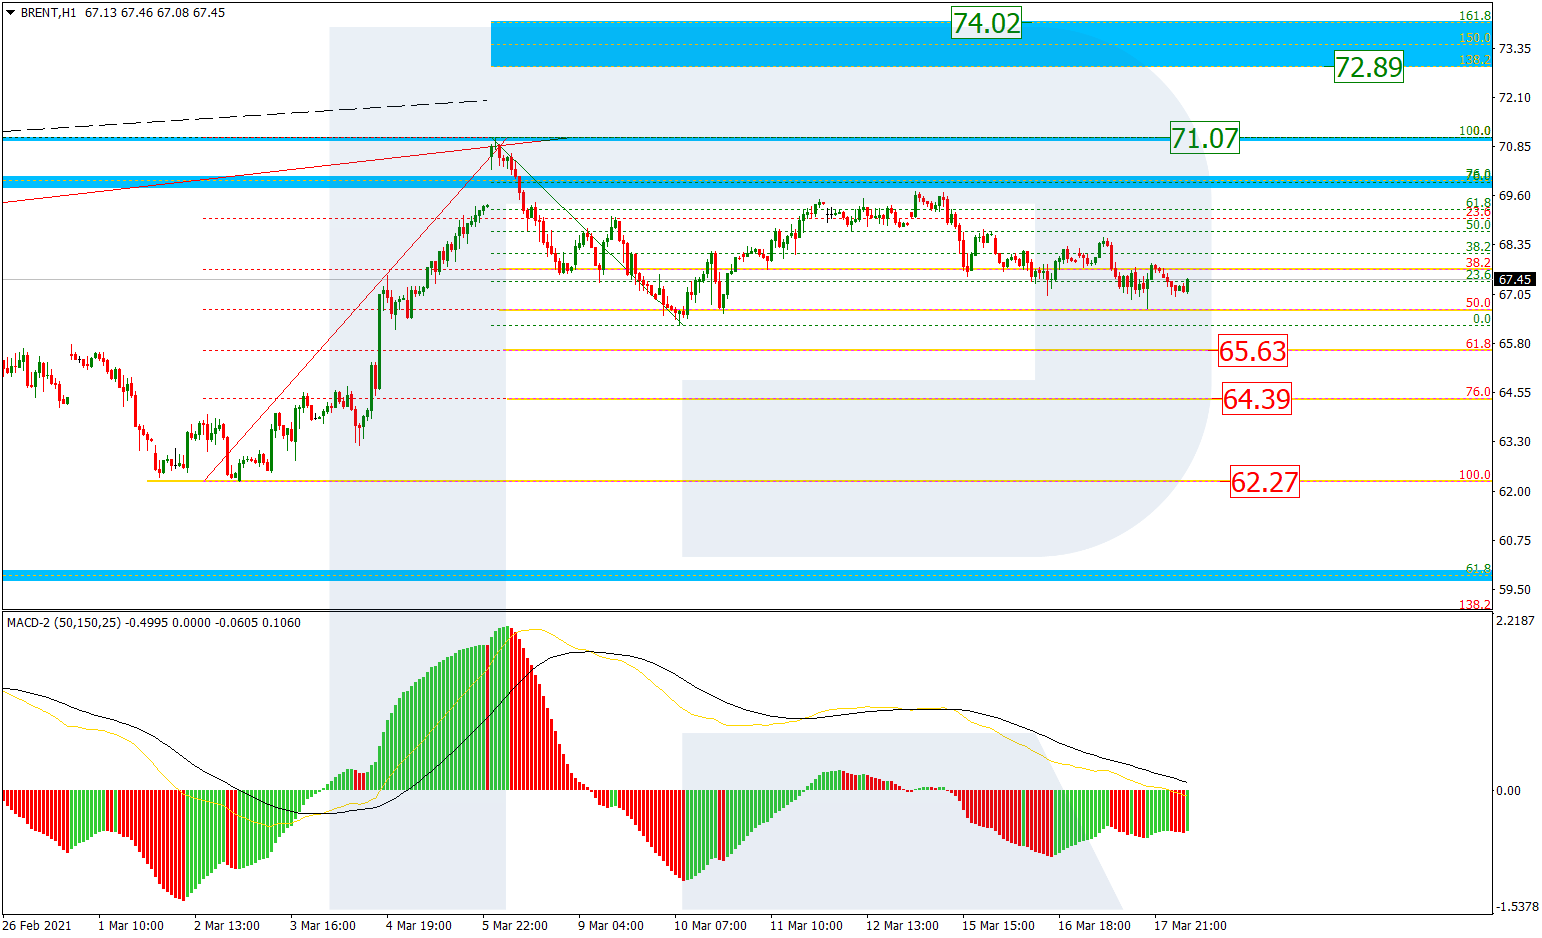
As we can see in the H1 chart, the correctional uptrend has failed to reach the high at 71.07 and the post-correctional extension area between 138.2% and 161.8% fibo at 72.89 and 74.02 respectively. A new decline may be heading towards 61.8% and 76.0% fibo at 65.63 and 64.39 respectively, as well as the low at 62.27.
Free Reports:
 Download Our Metatrader 4 Indicators – Put Our Free MetaTrader 4 Custom Indicators on your charts when you join our Weekly Newsletter
 Get our Weekly Commitment of Traders Reports - See where the biggest traders (Hedge Funds and Commercial Hedgers) are positioned in the futures markets on a weekly basis.
DAX30
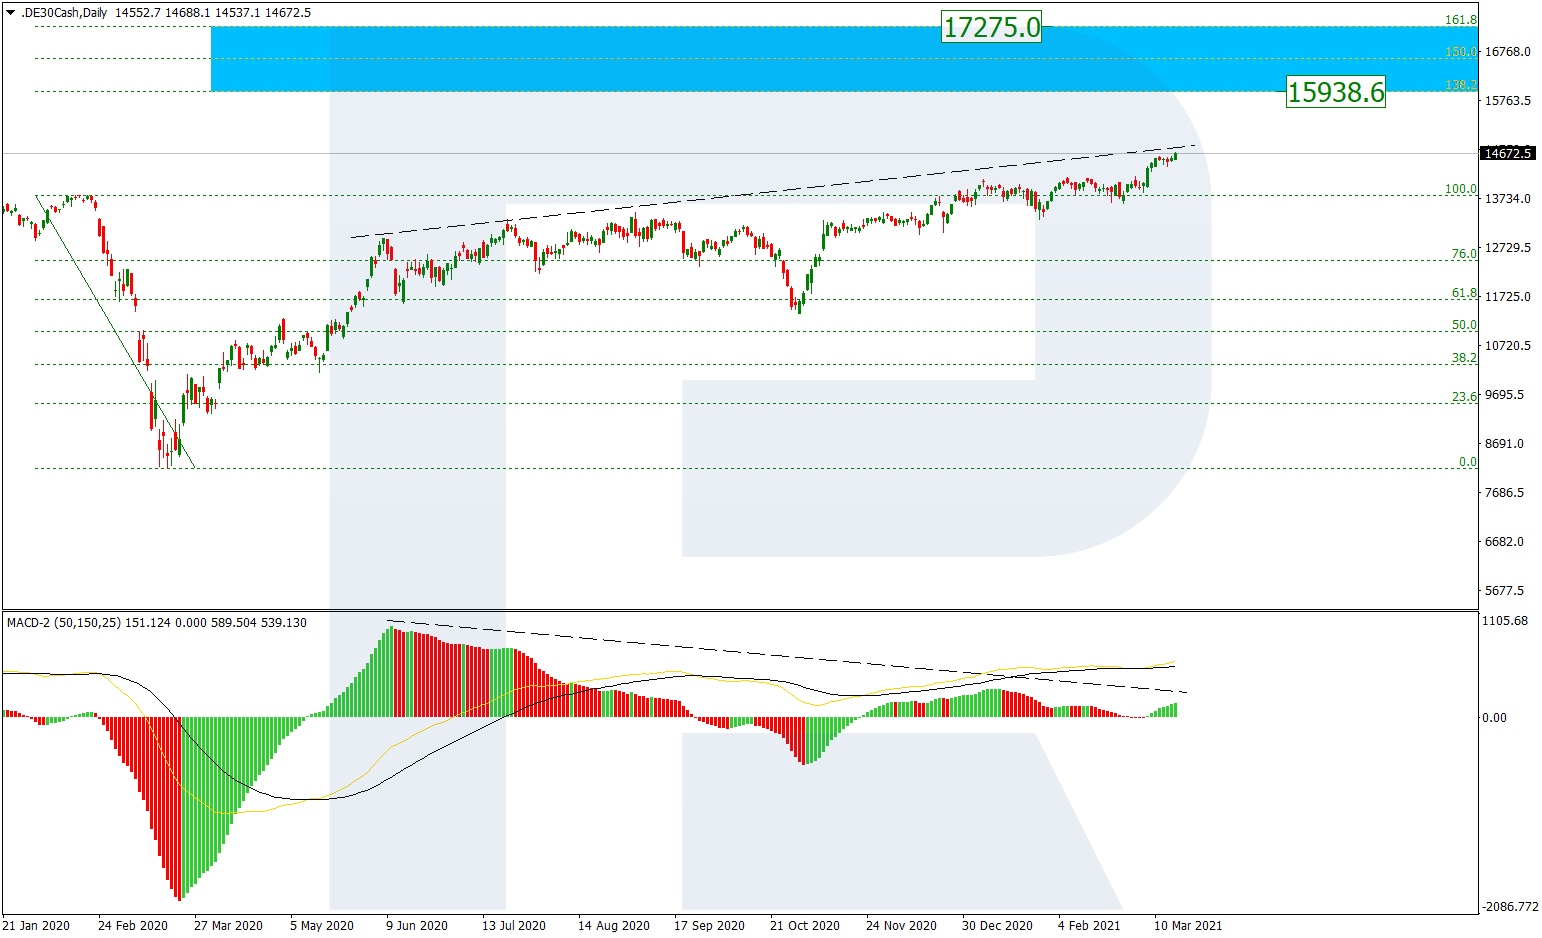
The daily chart shows that the DAX30 index continues rising and updating its highs one after another. This technical picture implies a further uptrend towards the post-correctional extension area between 138.2% and 161.8% fibo at 15938.6 and 17275.0 respectively. At the same time, there is divergence on MACD, which may indicate a new pullback.
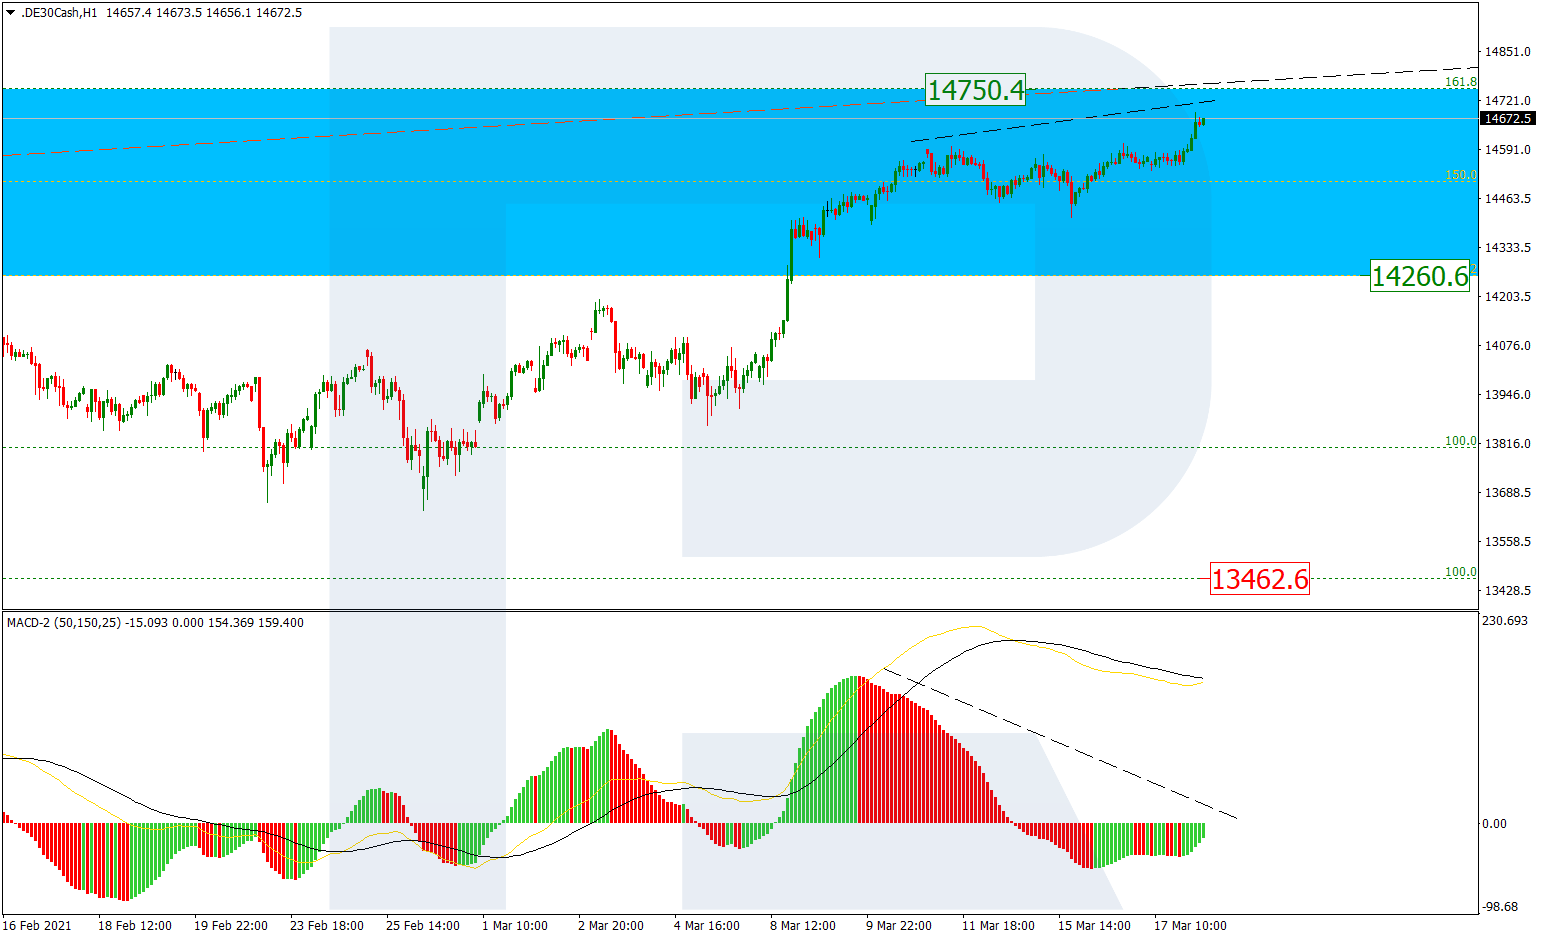
In the H1 chart, after breaking 13462.6, the asset has entered the local post-correctional extension area between 138.2% and 161.8% fibo at 14260.6 and 14750.4 respectively. However, a divergence on MACD may hint at a new pullback towards the level broken earlier.
Article By RoboForex.com
Attention!
Forecasts presented in this section only reflect the author’s private opinion and should not be considered as guidance for trading. RoboForex LP bears no responsibility for trading results based on trading recommendations described in these analytical reviews.

- COT Metals Charts: Weekly Speculator Changes led by Copper Jul 26, 2026
- COT Bonds Charts: Speculator Bets led by SOFR 3-Months & 5-Year Bonds Jul 26, 2026
- COT Energy Charts: Weekly Speculator Bets led by WTI Crude & Natural Gas Jul 26, 2026
- COT Soft Commodities Charts: Weekly Speculator Bets led by Corn & Soybeans Jul 26, 2026
- The US introduces new import tariffs for 60 countries. Brent crude surpasses $100 per barrel Jul 24, 2026
- USD/JPY Breaks Records: Nothing Slows the Yen’s Decline Jul 24, 2026
- Oil prices reached a 6‑week high. The AUD strengthened on the back of a strong labor‑market report Jul 23, 2026
- EUR/USD Recovers as Dollar Weakens Jul 23, 2026
- Bitcoin rose to $66,000. The New Zealand dollar continues to strengthen Jul 22, 2026
- Inflationary pressure is easing in Canada. In New Zealand, on the contrary, inflation is rising Jul 21, 2026