
Article By RoboForex.com
USDCHF, “US Dollar vs Swiss Franc”
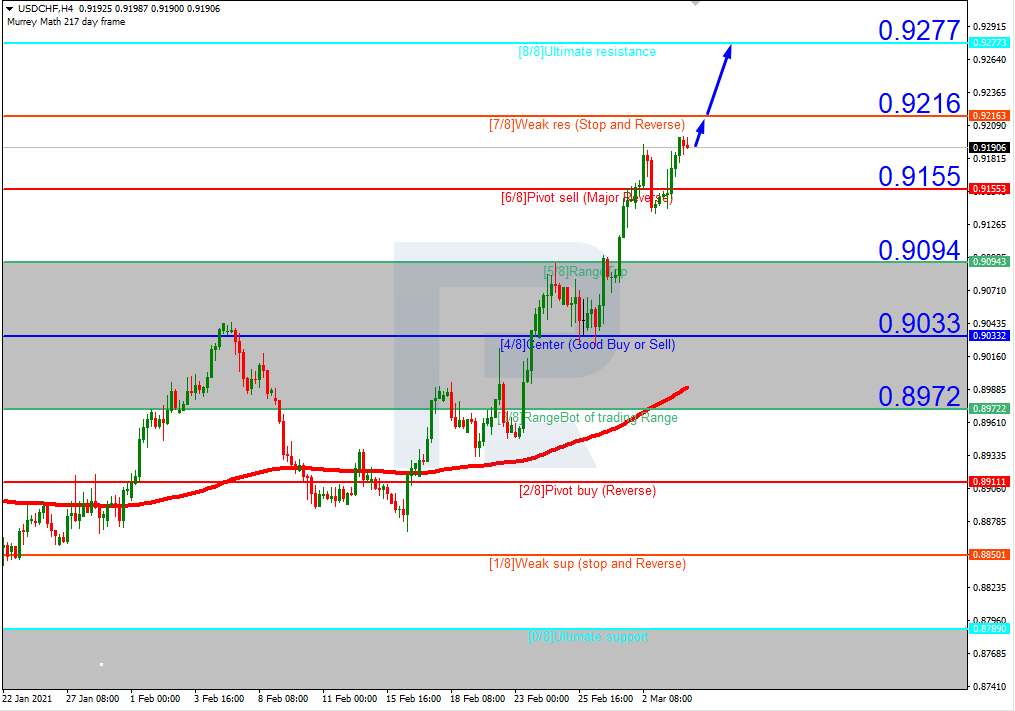
In the H4 chart, USDCHF is trading above the 200-day Moving Average, thus indicating an ascending tendency. In this case, the price is expected to break 7/8 and then continue growing towards the resistance at 8/8. Still, this scenario may no longer be valid if the price break 6/8 to the downside. After that, the instrument may correct downwards to reach the support 5/8.

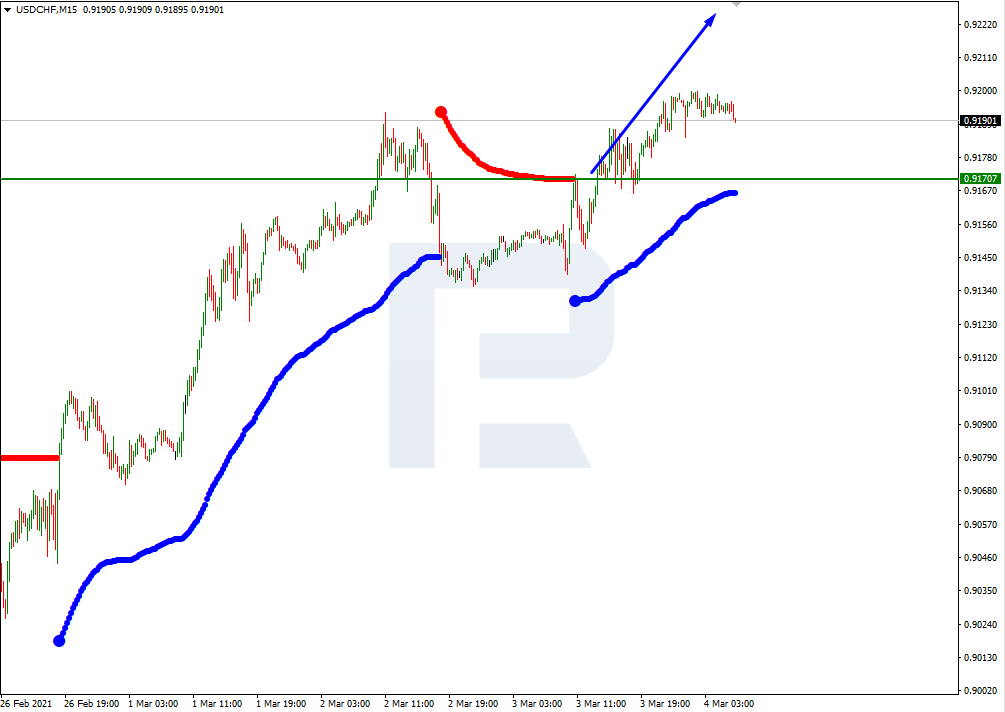
As we can see in the M15 chart, the pair has broken the upside line of the VoltyChannel indicator and, as a result, may continue the ascending tendency.
Free Reports:
 Sign Up for Our Stock Market Newsletter – Get updated on News, Charts & Rankings of Public Companies when you join our Stocks Newsletter
 Get our Weekly Commitment of Traders Reports - See where the biggest traders (Hedge Funds and Commercial Hedgers) are positioned in the futures markets on a weekly basis.
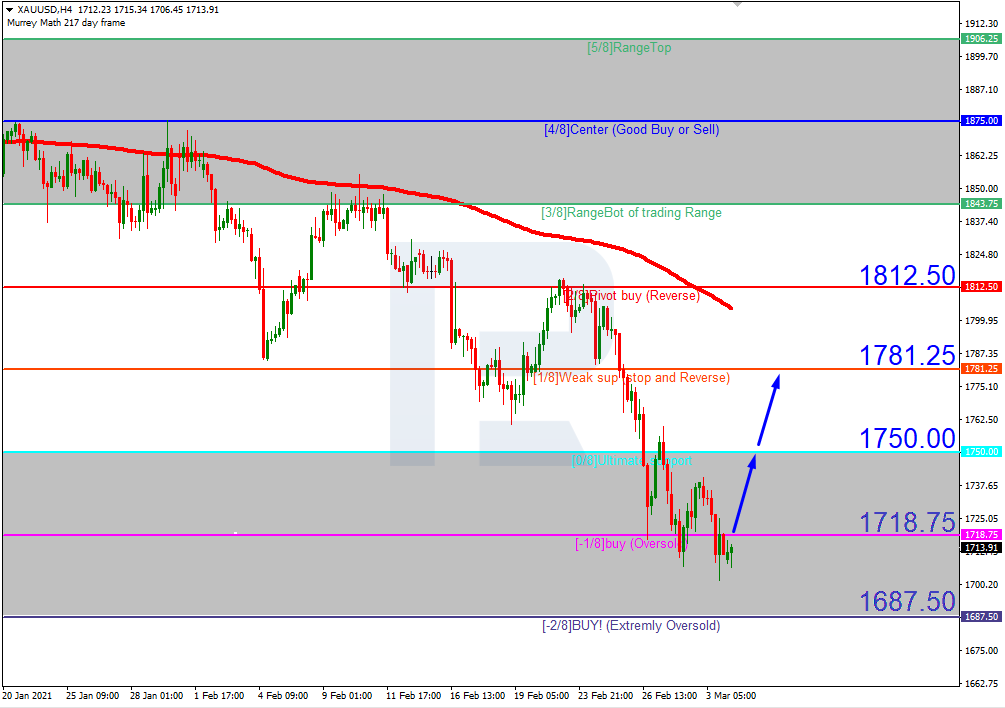
XAUUSD, “Gold vs US Dollar”
As we can see in the H4 chart, XAUUSD is trading inside the “oversold area”. In this case, the price is expected to break -1/8 and then continue growing to reach the resistance at 1/8. However, this scenario may no longer be valid if the price falls and breaks -2/8 to the downside. After that, the lines in the chart will be redrawn, thus helping us to define new targets.
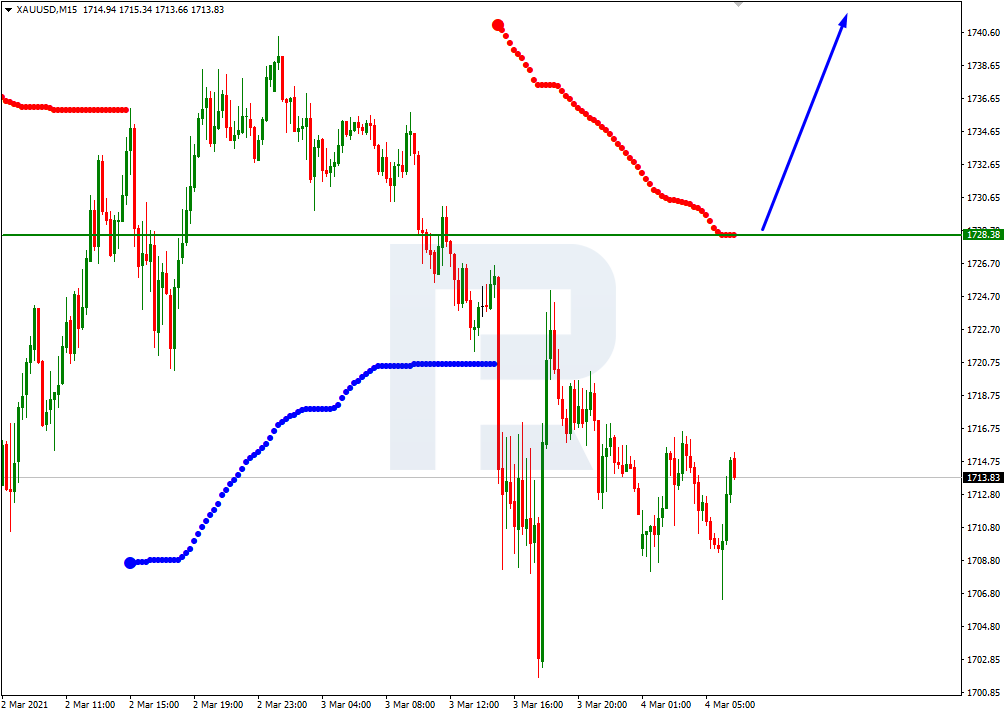
In the M15 chart, the price may break the upside line of the VoltyChannel indicator and, as a result, continue growing.
Article By RoboForex.com
Attention!
Forecasts presented in this section only reflect the author’s private opinion and should not be considered as guidance for trading. RoboForex LP bears no responsibility for trading results based on trading recommendations described in these analytical reviews.

- This week will be one of the most crowded for central‑bank meetings Jul 27, 2026
- EUR/USD Ahead of a Key Week: Holding Near Lows Jul 27, 2026
- COT Metals Charts: Weekly Speculator Changes led by Copper Jul 26, 2026
- COT Bonds Charts: Speculator Bets led by SOFR 3-Months & 5-Year Bonds Jul 26, 2026
- COT Energy Charts: Weekly Speculator Bets led by WTI Crude & Natural Gas Jul 26, 2026
- COT Soft Commodities Charts: Weekly Speculator Bets led by Corn & Soybeans Jul 26, 2026
- The US introduces new import tariffs for 60 countries. Brent crude surpasses $100 per barrel Jul 24, 2026
- USD/JPY Breaks Records: Nothing Slows the Yen’s Decline Jul 24, 2026
- Oil prices reached a 6‑week high. The AUD strengthened on the back of a strong labor‑market report Jul 23, 2026
- EUR/USD Recovers as Dollar Weakens Jul 23, 2026