
Article By RoboForex.com
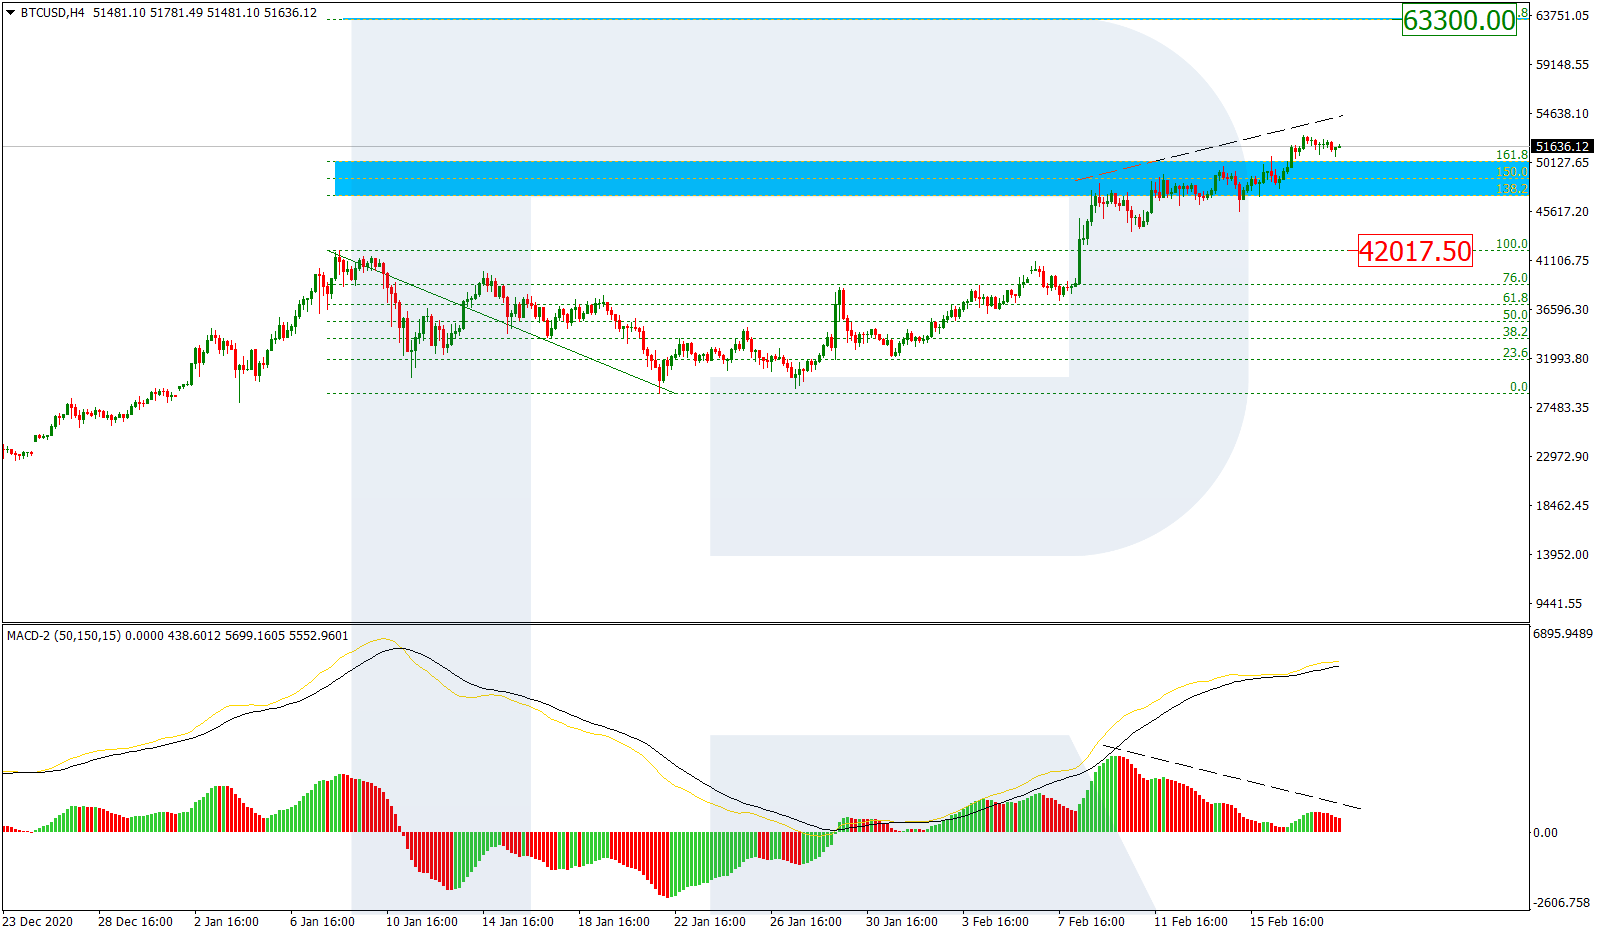
BTCUSD, “Bitcoin vs US Dollar”
As we can see in the H4 chart, BTCUSD continues updating its all-time highs without even thinking of starting any pullbacks. After breaking the post-correctional extension area between 138.2% and 161.8% fibo at 47080.00 and 50213.00 respectively with confidence, the asset has fixed above it. The next upside target is 261.8% fibo at 63300.00. The support is at 42017.50. At the same time, there is a divergence on MACD, which may hint at a quick and deep pullback.

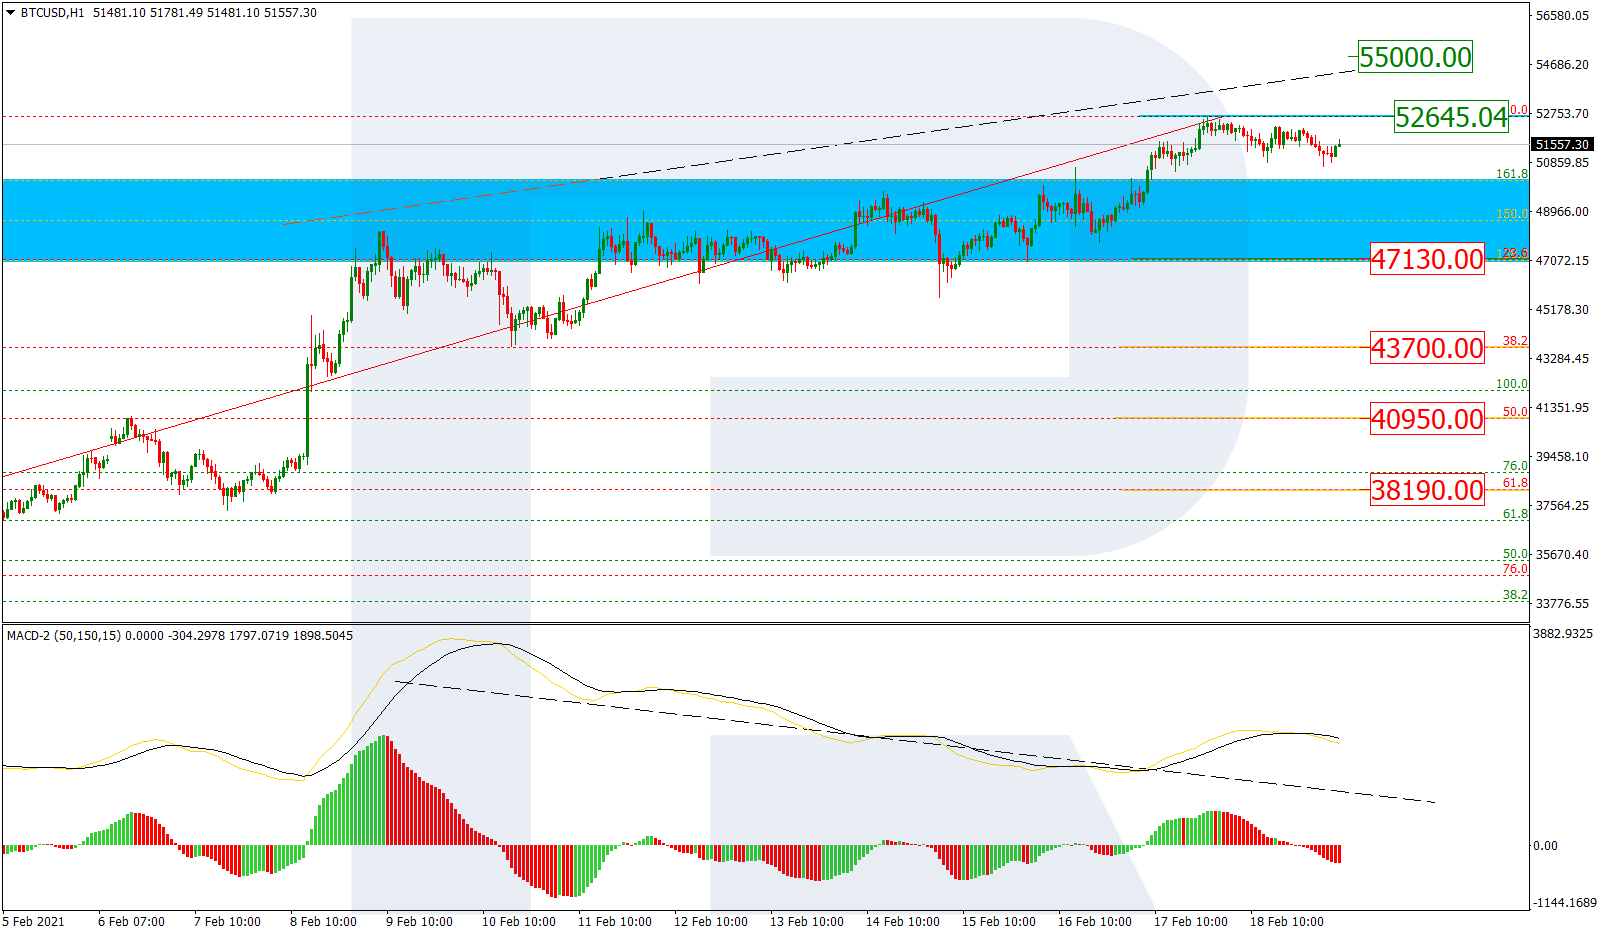
The H1 chart shows a local divergence but the pair may yet reach 55000.00 in the nearest future. however, if the price fails to break the high at 52645.02, the asset may start a new pullback towards 23.6%, 38.2%, 50.0%, and 61.8% fibo at 47130.00, 43700.00, 40950.00, and 38190.00 respectively.
Free Reports:
 Sign Up for Our Stock Market Newsletter – Get updated on News, Charts & Rankings of Public Companies when you join our Stocks Newsletter
 Get our Weekly Commitment of Traders Reports - See where the biggest traders (Hedge Funds and Commercial Hedgers) are positioned in the futures markets on a weekly basis.
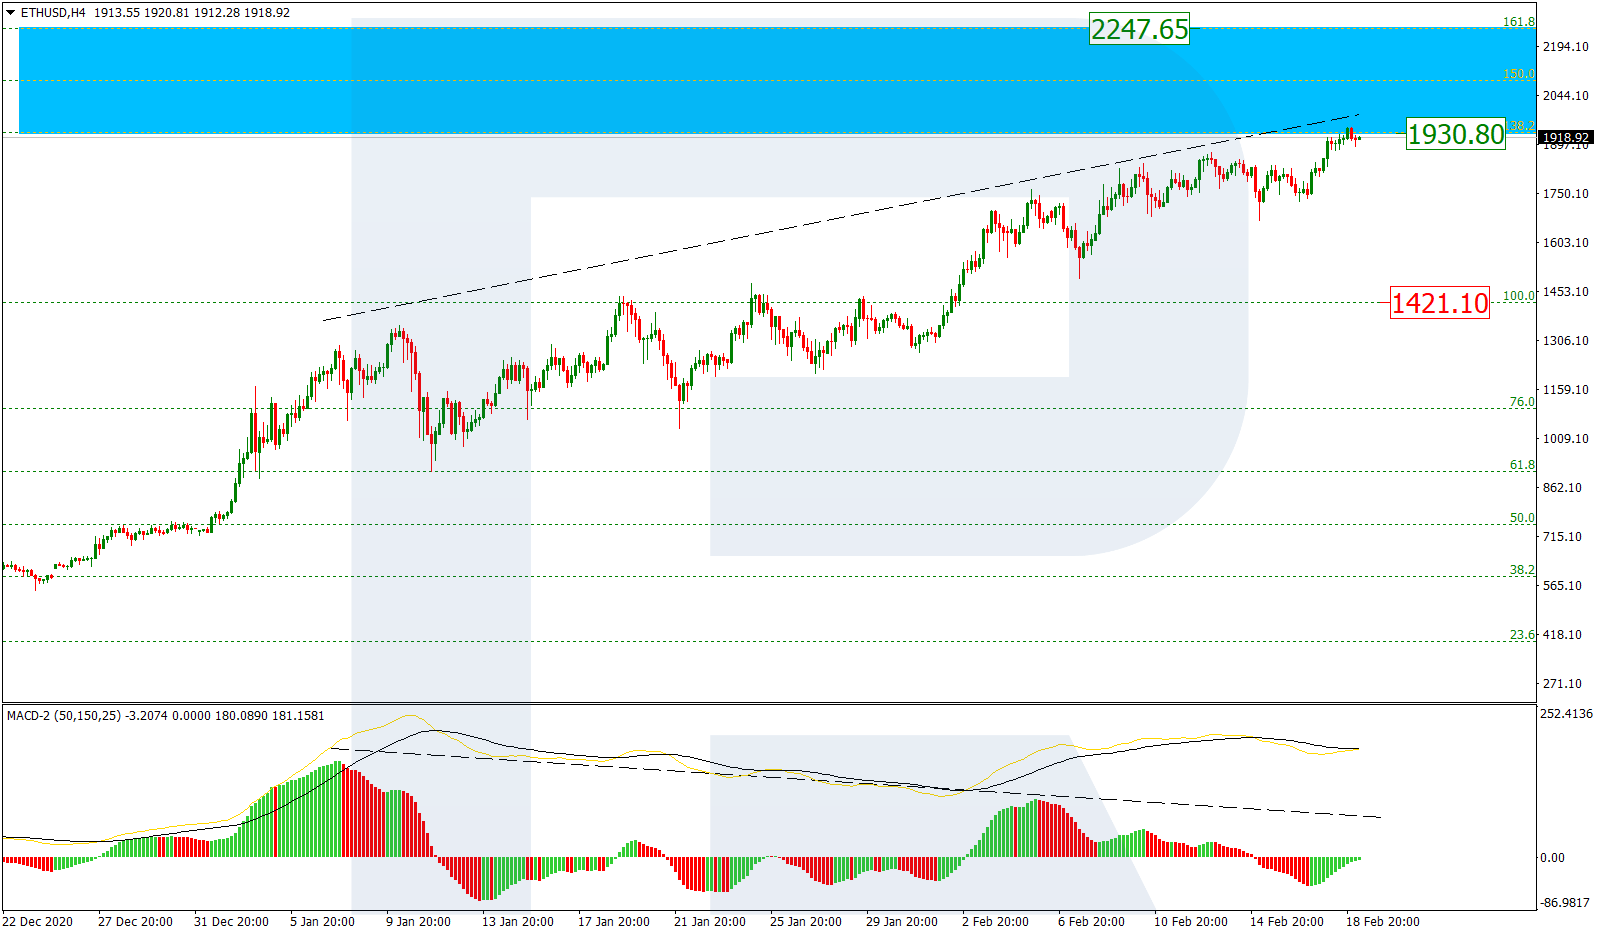
ETHUSD, “Ethereum vs. US Dollar”
The H4 chart shows a stable uptrend, which, after breaking the fractal high at 1421.10, is heading towards the post-correctional extension area between 138.2% and 161.8% fibo at 1930.80 and 2247.65 respectively. However, there is a divergence on MACD, which may hint at a new correctional downtrend.
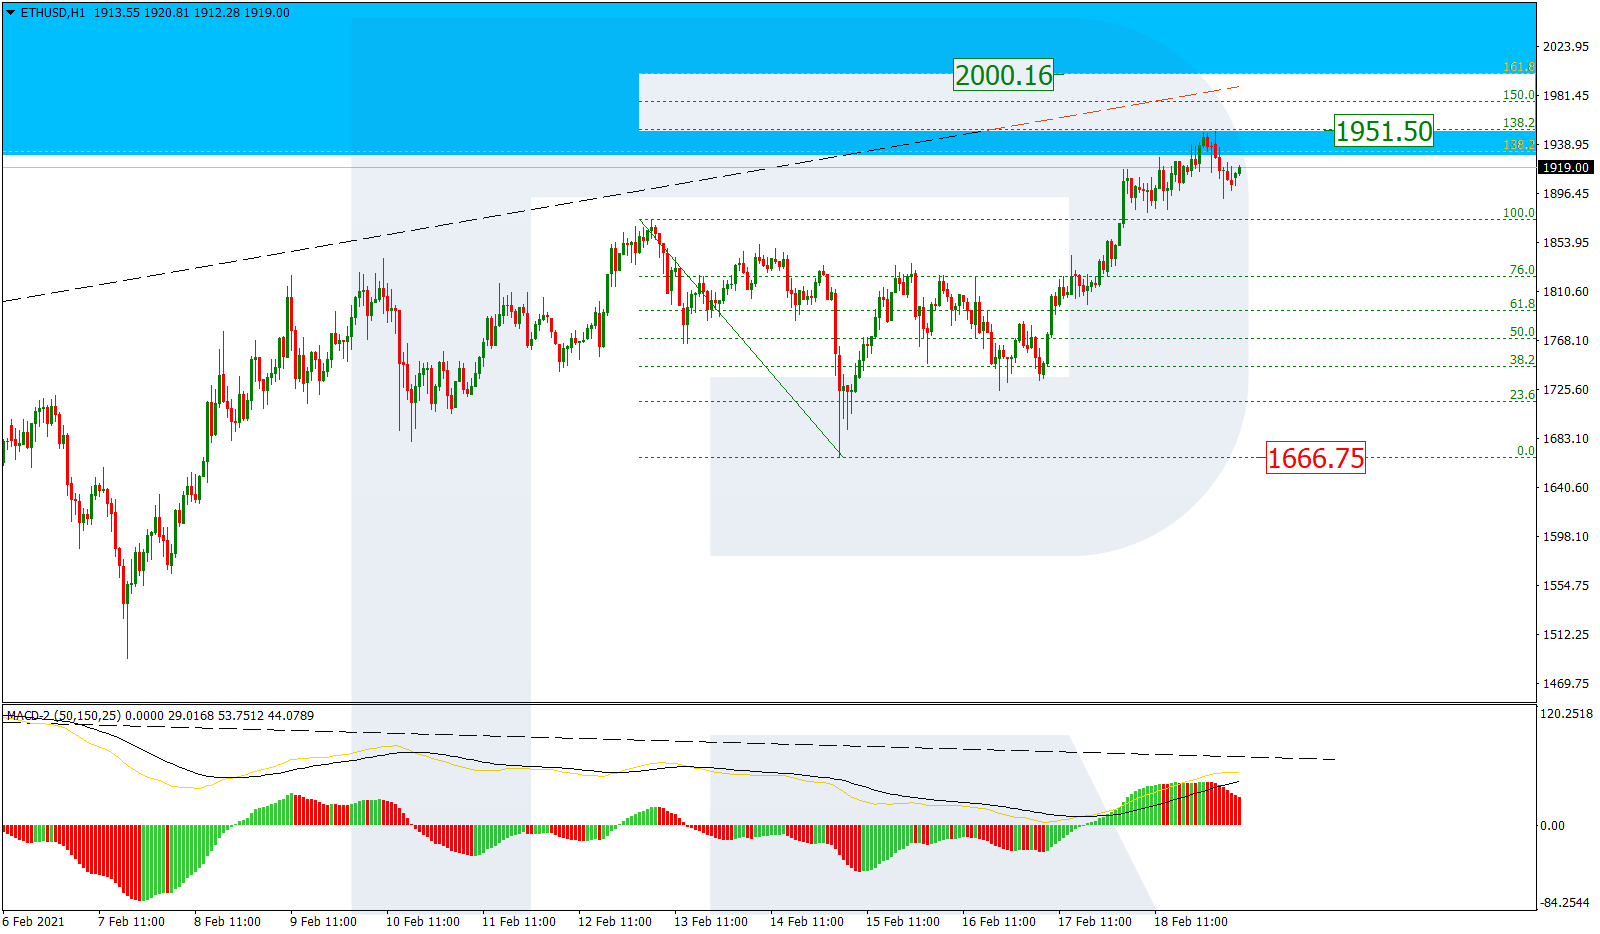
As we can see in the H1 chart, the pair is about to test the post-correctional extension area between 138.2% and 161.8% fibo at 1951.50 and 2000.16 respectively. The local support is the fractal low at 1666.75.
Article By RoboForex.com
Attention!
Forecasts presented in this section only reflect the author’s private opinion and should not be considered as guidance for trading. RoboForex LP bears no responsibility for trading results based on trading recommendations described in these analytical reviews.

- Oil prices fall back to pre‑war levels. Silver drops to a 7‑month low Jun 25, 2026
- Gold Falls to an Eight-Month Low: This May Not Be the Bottom Jun 25, 2026
- Stock indices came under heavy selling pressure amid growing skepticism about AI investments Jun 24, 2026
- The Pound Is Pressured Not by Politics, but by a Strong US Dollar Jun 24, 2026
- Global crude oil prices continued to decline. The AUD/USD exchange rate hit an 11‑week low Jun 23, 2026
- EUR/USD Remains Under Sellers’ Control as the Dollar Stays Strong Jun 23, 2026
- Gold Falls for the Third Consecutive Week: Is There Still Upside Potential? Jun 22, 2026
- Bank Indonesia raised its interest rate. Norges Bank and the SNB left rates unchanged Jun 19, 2026
- EUR/USD Loses Ground as Market Sentiment Favours the US Dollar Jun 19, 2026
- GBPUSD Awaits Bank of England Meeting Near April Lows Jun 18, 2026