
Article By RoboForex.com
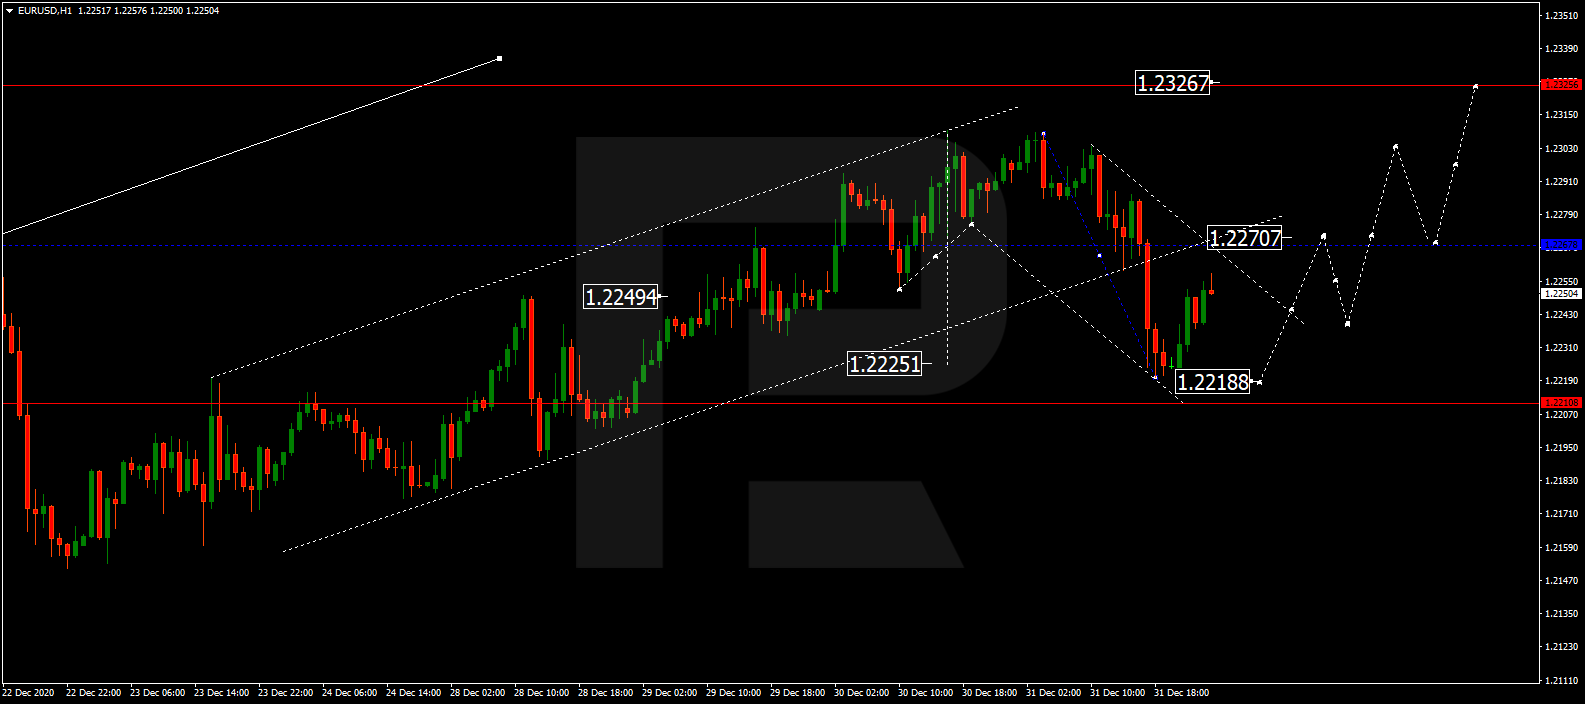
EURUSD, “Euro vs US Dollar”
After finishing the ascending wave at 1.2300 along with the correction towards 1.2220, EURUSD is expected to reach 1.2270 and then fall towards 1.2240, thus forming a new consolidation range between the two latter levels. If later the price breaks this range to the upside, the market may form one more ascending structure towards 1.2326; if to the downside – continue the correction with the target at 1.2218.

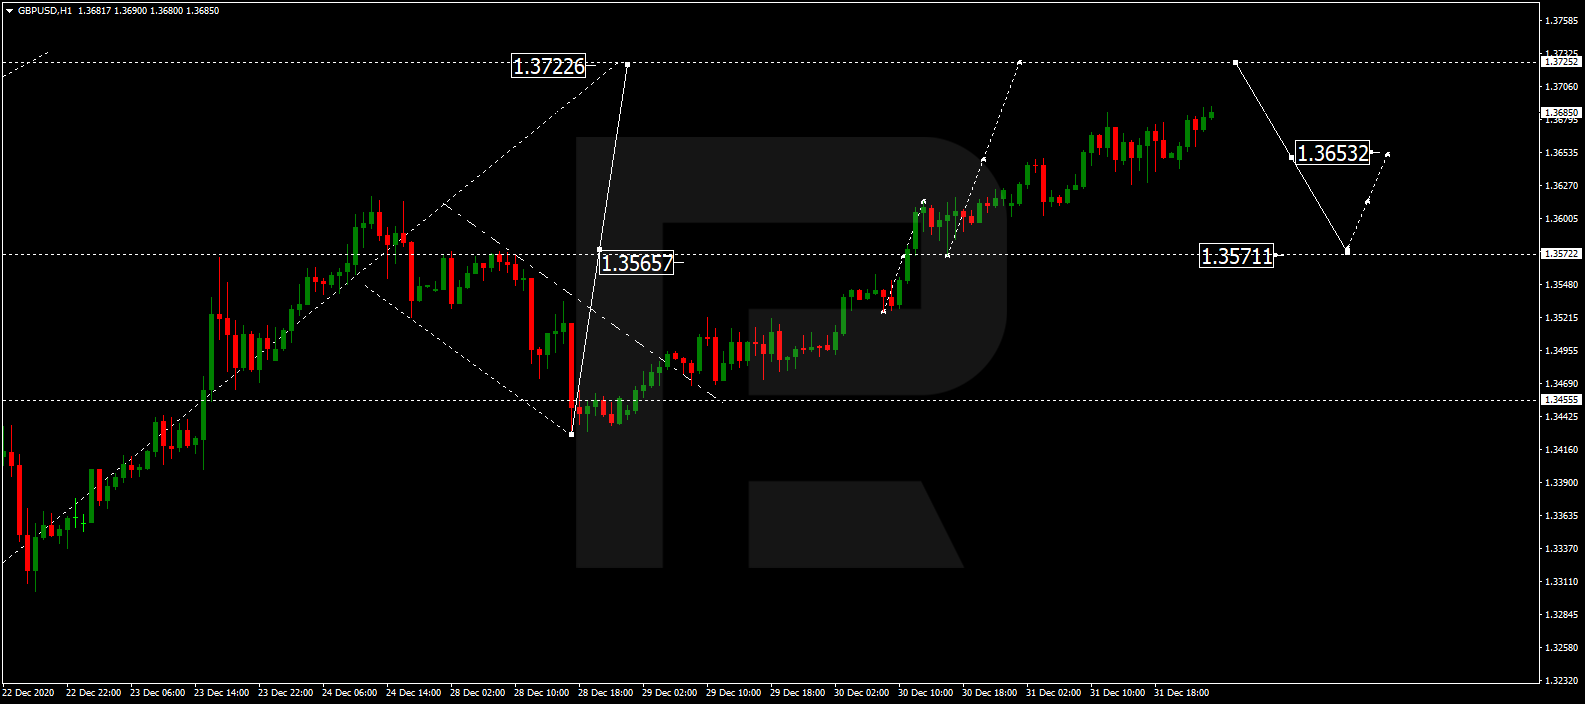
GBPUSD, “Great Britain Pound vs US Dollar”
GBPUSD is growing towards 1.3722. After that, the instrument may correct to reach 1.3571 and then move upwards with the target at 1.3643, thus forming a new consolidation range between these two levels. If later the price breaks this range to the downside, the market may form a new descending structure with the first target at 1.3455.
Free Reports:
 Get our Weekly Commitment of Traders Reports - See where the biggest traders (Hedge Funds and Commercial Hedgers) are positioned in the futures markets on a weekly basis.
 Sign Up for Our Stock Market Newsletter – Get updated on News, Charts & Rankings of Public Companies when you join our Stocks Newsletter
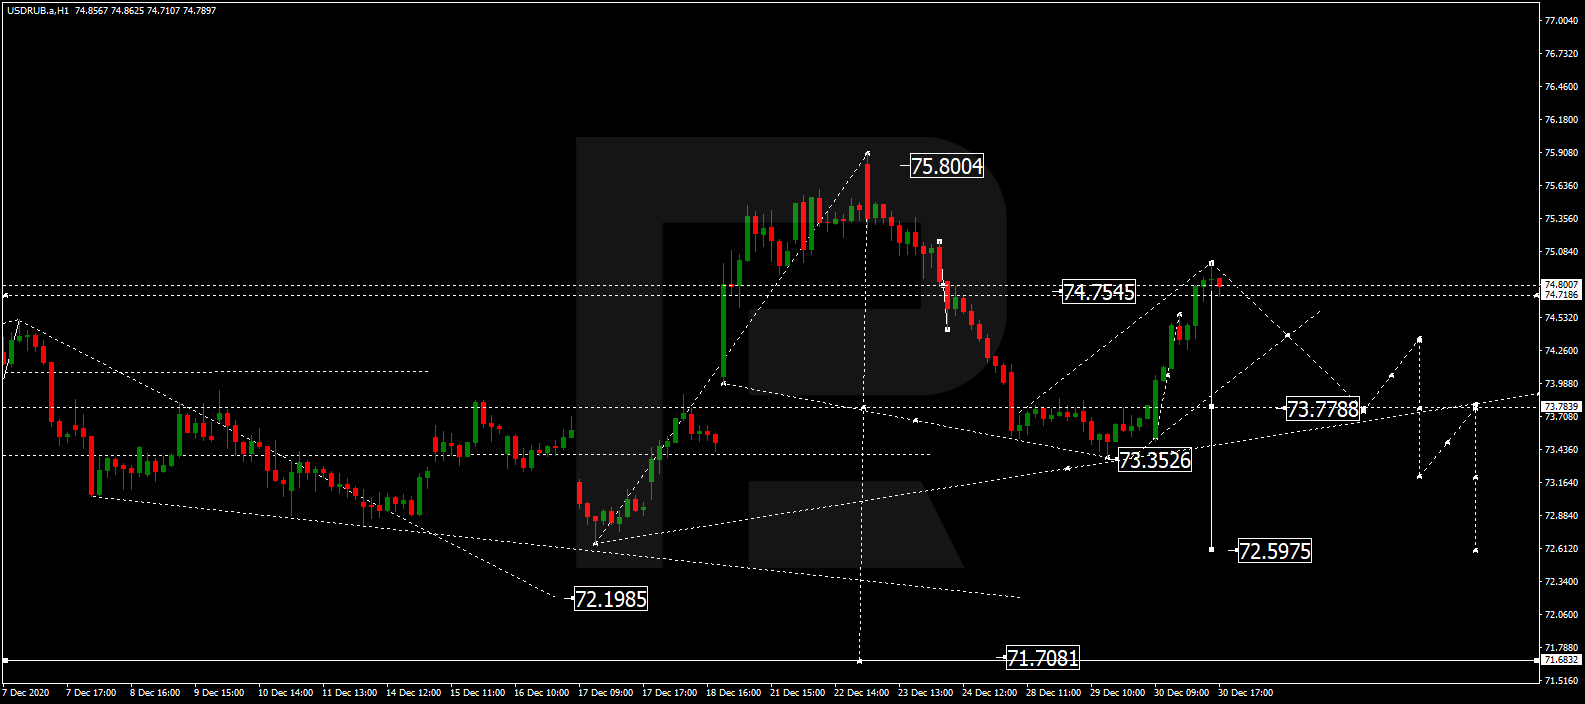
USDRUB, “US Dollar vs Russian Ruble”
USDRUB has completed the correction at 74.74. After the market opening, the pair may fall to break 73.73 and then continue trading downwards with the short-term target at 72.60. In fact, the market is expected to continue forming the descending wave to reach 71.71.
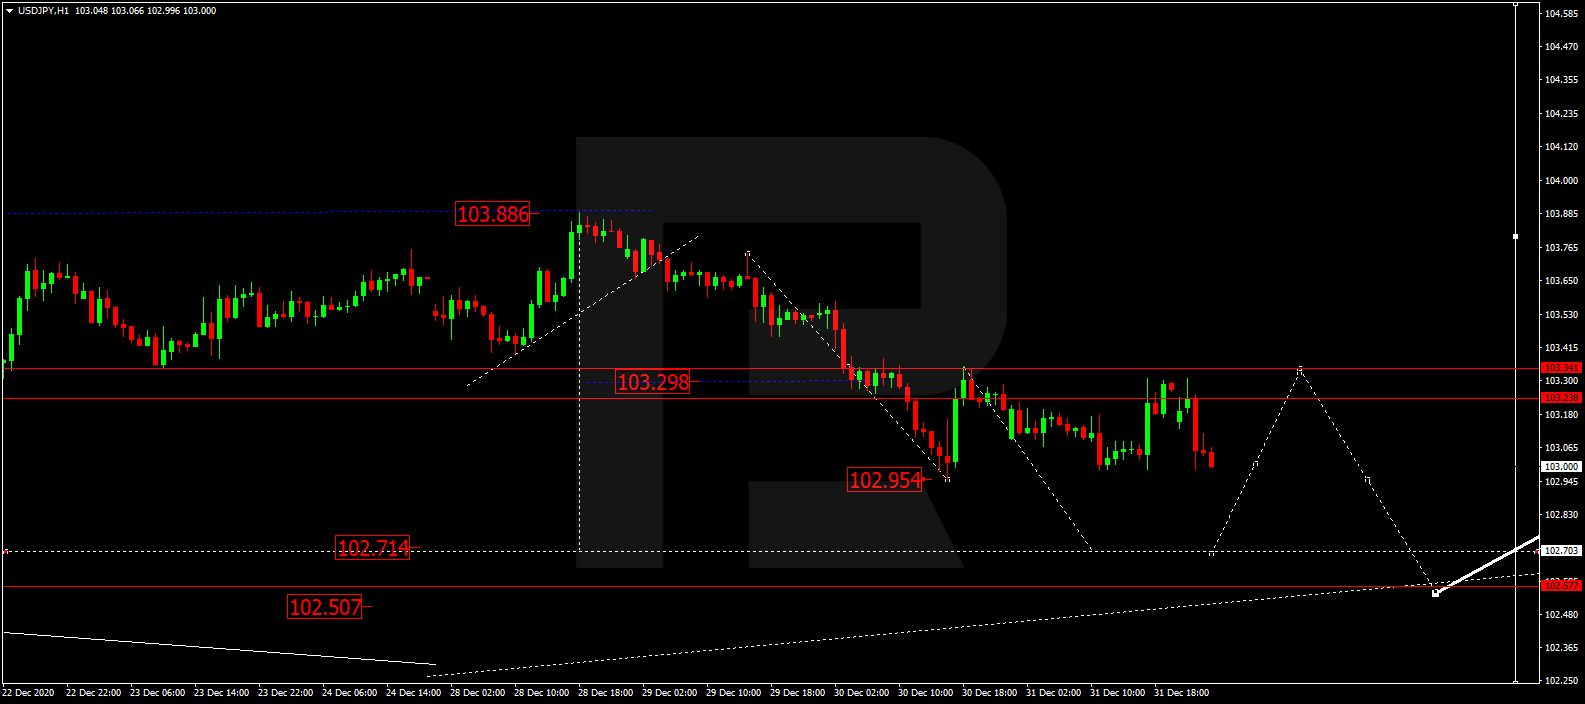
USDJPY, “US Dollar vs Japanese Yen”
After completing the descending wave at 102.95 along with the correction towards 103.30, USDJPY is falling to reach 102.70. After that, the instrument may correct to return to 103.30 and then resume trading downwards with the key target at 102.50.
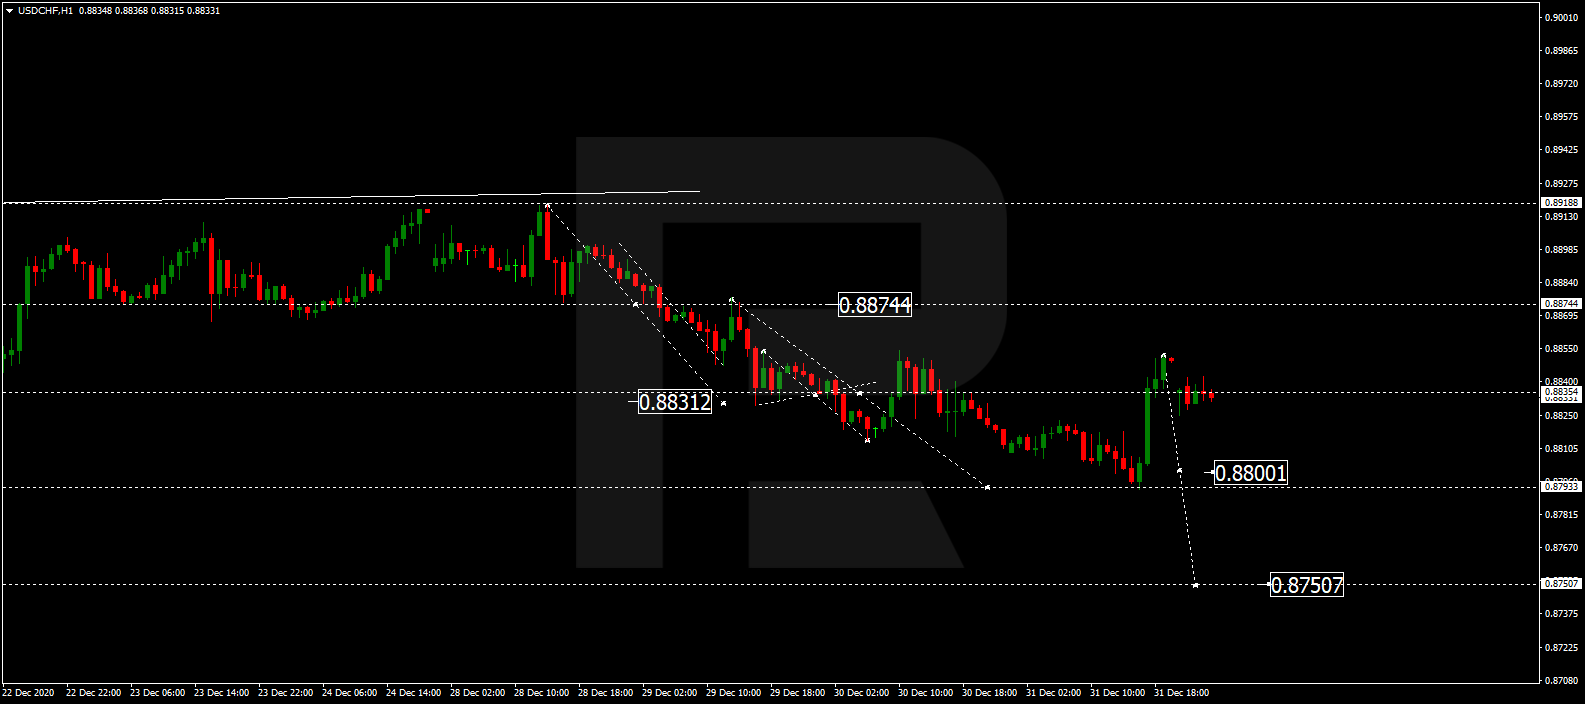
USDCHF, “US Dollar vs Swiss Franc”
After finishing the descending wave at 0.8800 along with the correction towards 0.8850, USDCHF is expected to form a new consolidation range below the latter level. If later the price breaks this range to the downside, the market may resume trading downwards with the target at 0.8750.
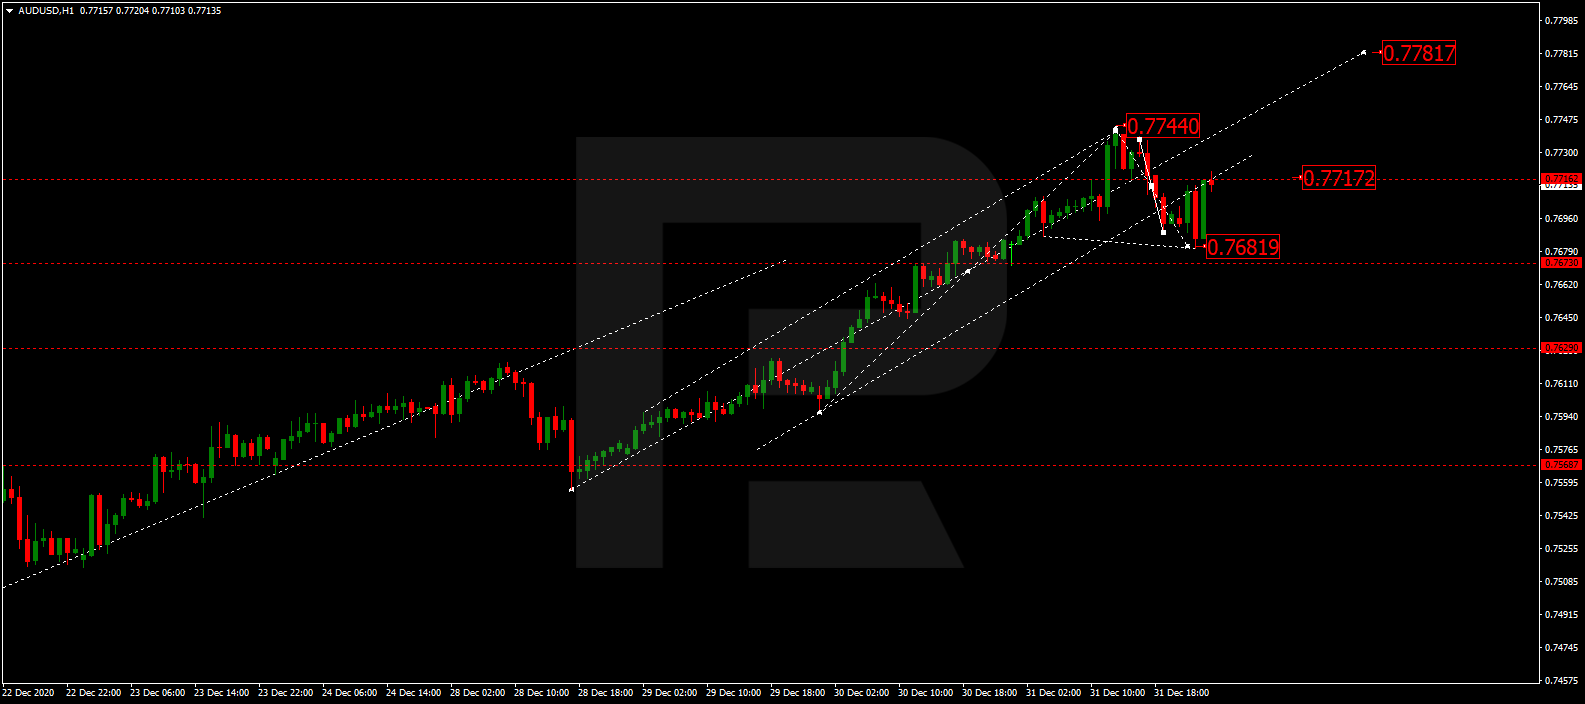
AUDUSD, “Australian Dollar vs US Dollar”
After finishing the ascending wave at 0.7744 and then completing the correction towards 0.7681, AUDUSD has returned to 0.7717 and may form a new consolidation range between the two latter levels. If later the price breaks this range to the upside, the market may resume growing towards 0.7781; if to the downside – start a new decline with the target at 0.7628.
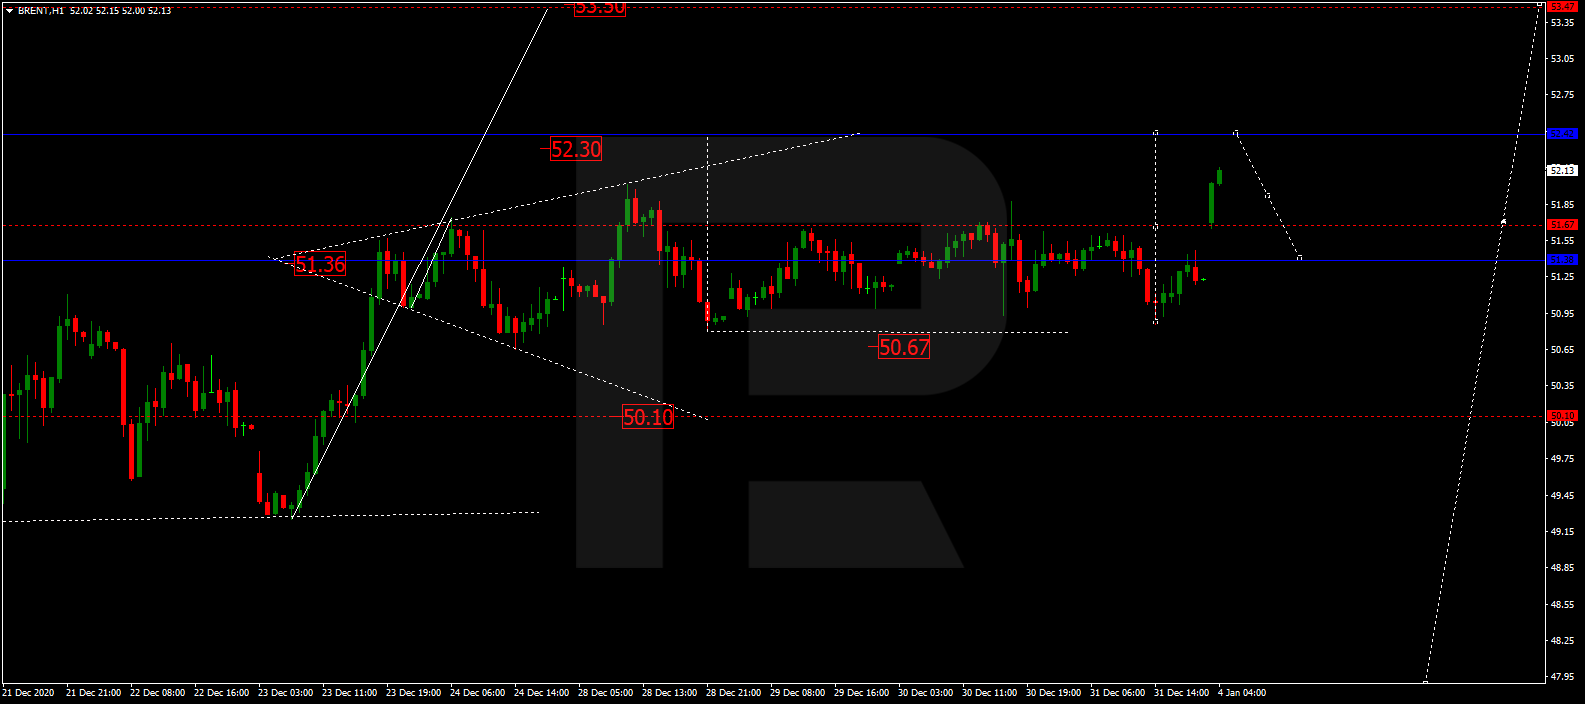
BRENT
Brent is moving upwards to reach 52.30. After that, the instrument may correct towards 51.55 and then resume trading upwards with the short-term target at 53.50.
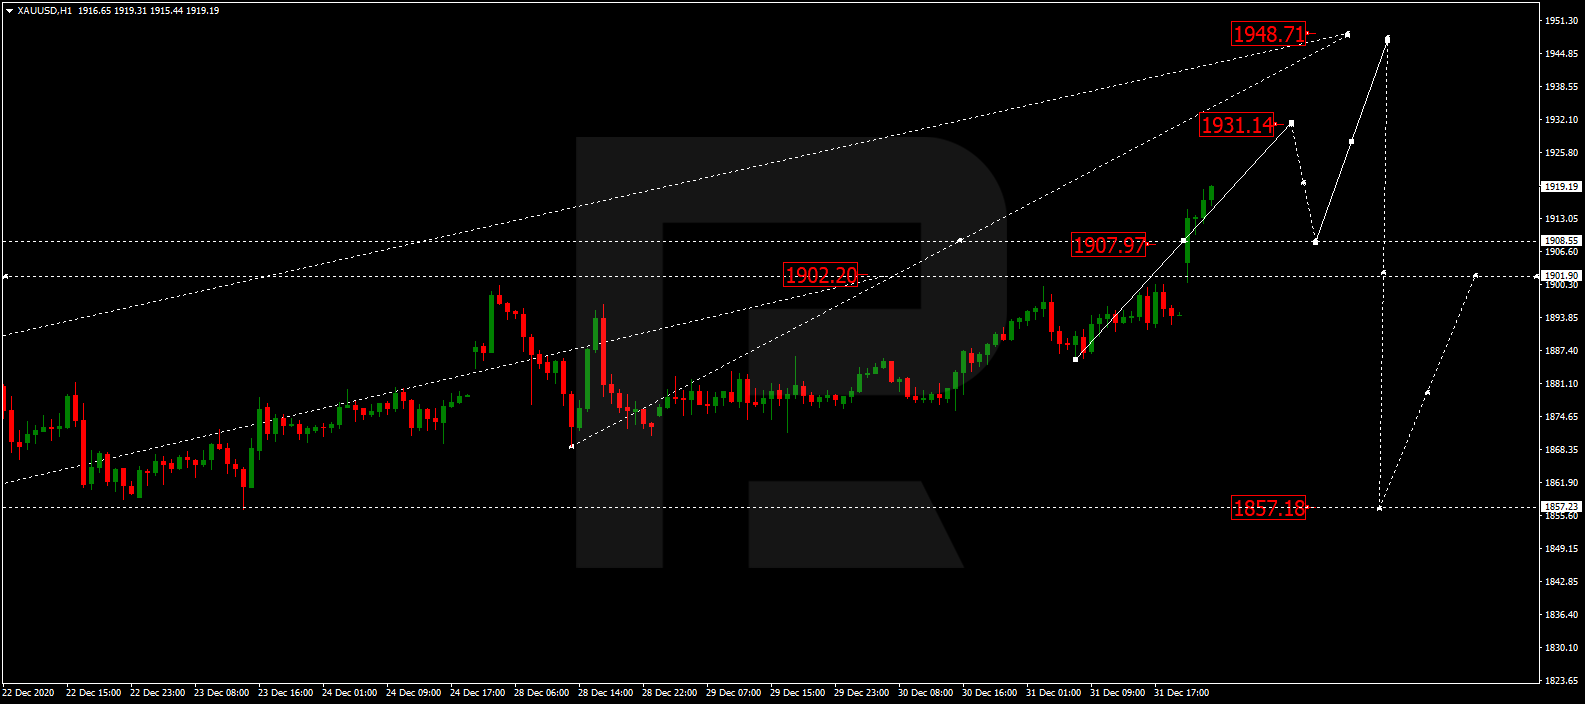
XAUUSD, “Gold vs US Dollar”
Gold is growing to reach 1931.14. Later, the market may start another correction towards 1907.97 and then form one more ascending structure with the target at 1948.70.
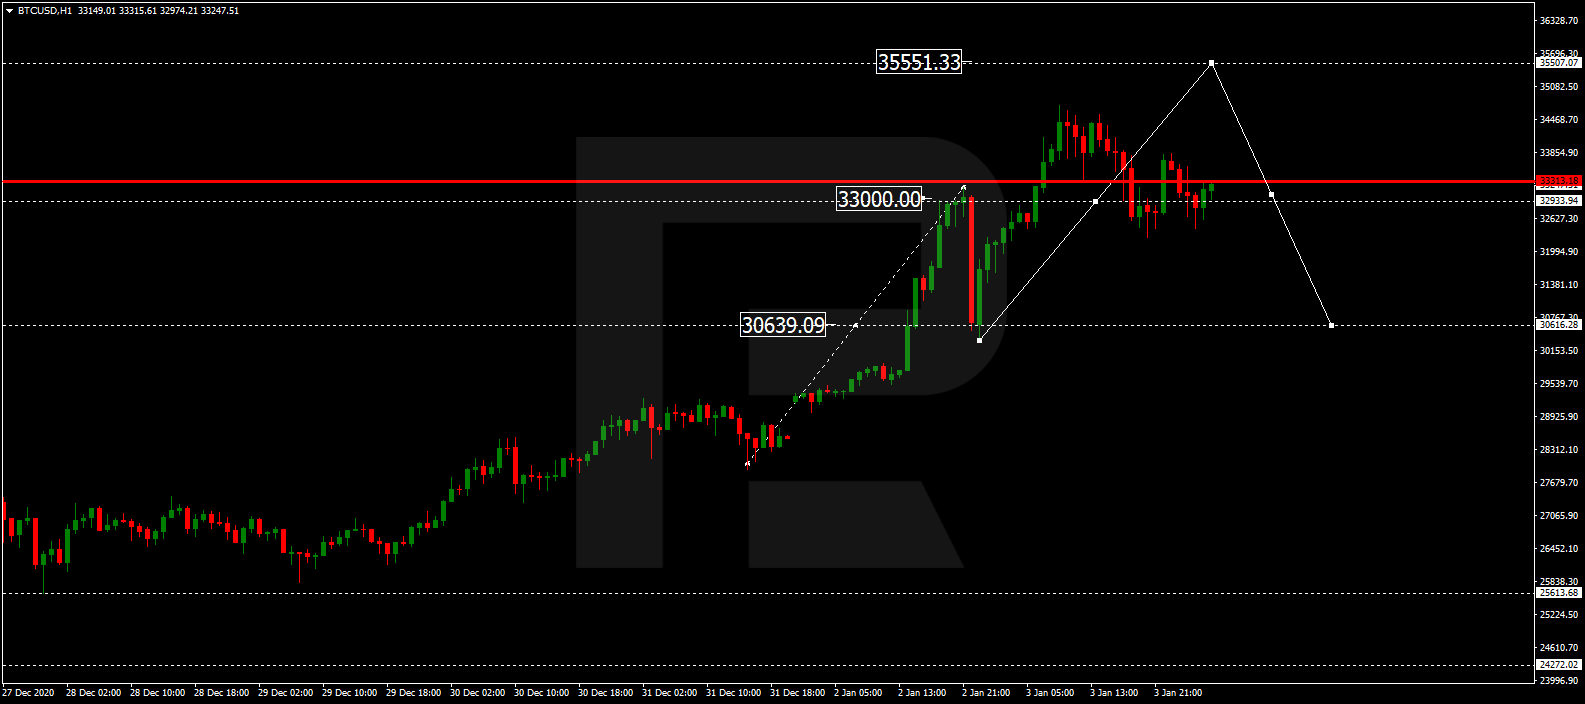
BTCUSD, “Bitcoin vs US Dollar”
After completing the ascending wave at 33000.00 along with the correction towards 30600.00, BTCUSD is forming another ascending structure to reach 35555.00. After that, the instrument may resume trading downwards with the target at 30000.00.
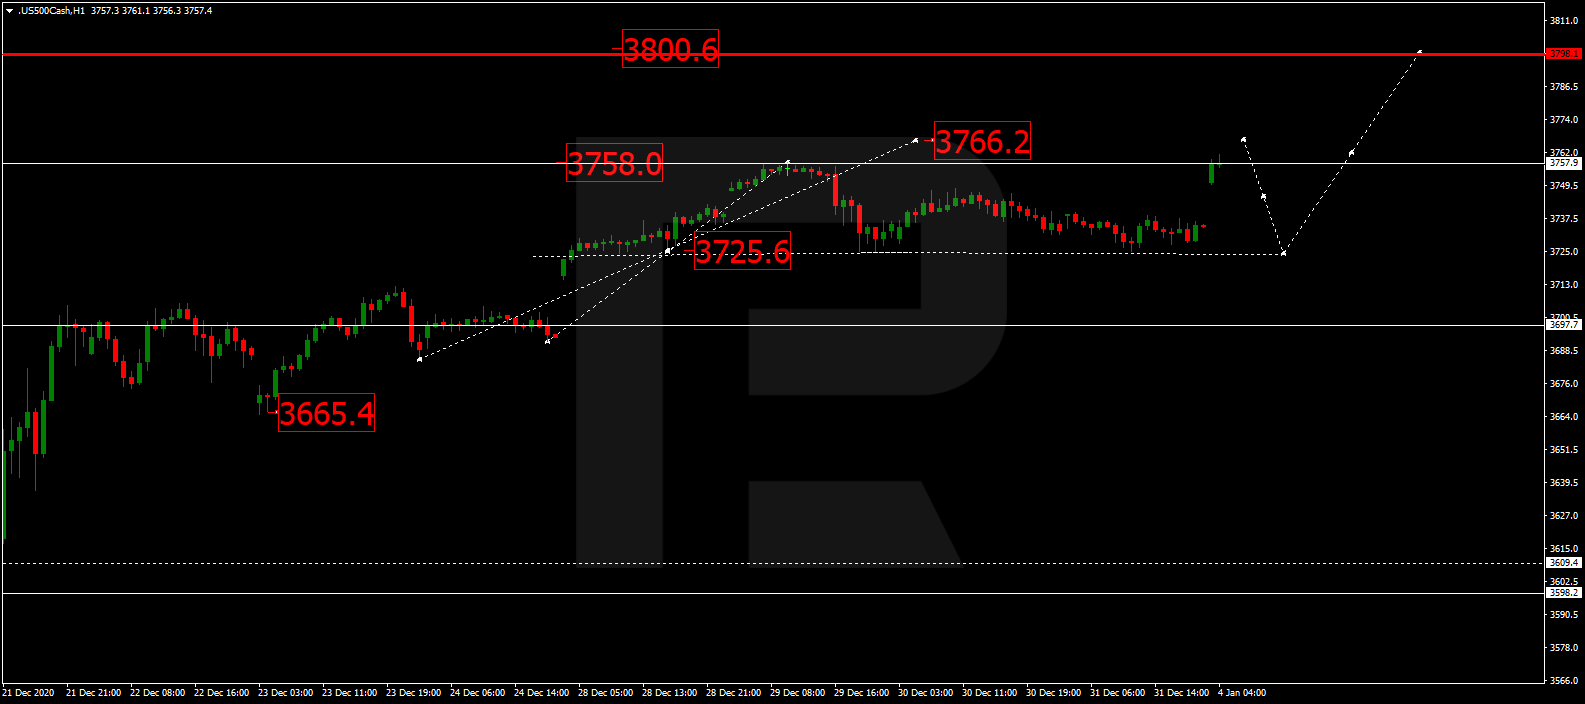
S&P 500
The S&P index is growing towards 3766.1. Later, the market may correct to reach 3725.5 and then complete this ascending wave by trading upwards with the key target at 3800.6. After that, the instrument may form a new descending structure towards 3600.0.
Article By RoboForex.com
Attention!
Forecasts presented in this section only reflect the author’s private opinion and should not be considered as guidance for trading. RoboForex LP bears no responsibility for trading results based on trading recommendations described in these analytical reviews.

- EUR/USD: The Advantage Remains with the Dollar Jun 29, 2026
- Escalation of the US–Iran conflict is once again supporting the rise in oil prices Jun 29, 2026
- Oil prices fall back to pre‑war levels. Silver drops to a 7‑month low Jun 25, 2026
- Gold Falls to an Eight-Month Low: This May Not Be the Bottom Jun 25, 2026
- Stock indices came under heavy selling pressure amid growing skepticism about AI investments Jun 24, 2026
- The Pound Is Pressured Not by Politics, but by a Strong US Dollar Jun 24, 2026
- Global crude oil prices continued to decline. The AUD/USD exchange rate hit an 11‑week low Jun 23, 2026
- EUR/USD Remains Under Sellers’ Control as the Dollar Stays Strong Jun 23, 2026
- Gold Falls for the Third Consecutive Week: Is There Still Upside Potential? Jun 22, 2026
- Bank Indonesia raised its interest rate. Norges Bank and the SNB left rates unchanged Jun 19, 2026