
Author: Dmitriy Gurkovskiy, Chief Analyst at RoboForex
On Monday, September 21st, the major currency pair is “gaining weight” and trading at 1.1864.
The data published last Friday by the USD provided good support o the “greenback”. The preliminary report on the UoM Consumer Sentiment showed 78.9 points in September after being 74.1 points in the previous month. The indicator was expected to improve but only up to 75.0 points.
A new week September won’t offer many important numbers from the USA but the ones that are to be published will be connected with real estate and may provide insight into the state of things with both manufacturers and consumers.
However, the lion’s share of investors’ attention will be focused on almost daily speeches to be delivered by the US Federal Reserve Chairman Jerome Powell, who may talk about assessments of the current state of the American economy.
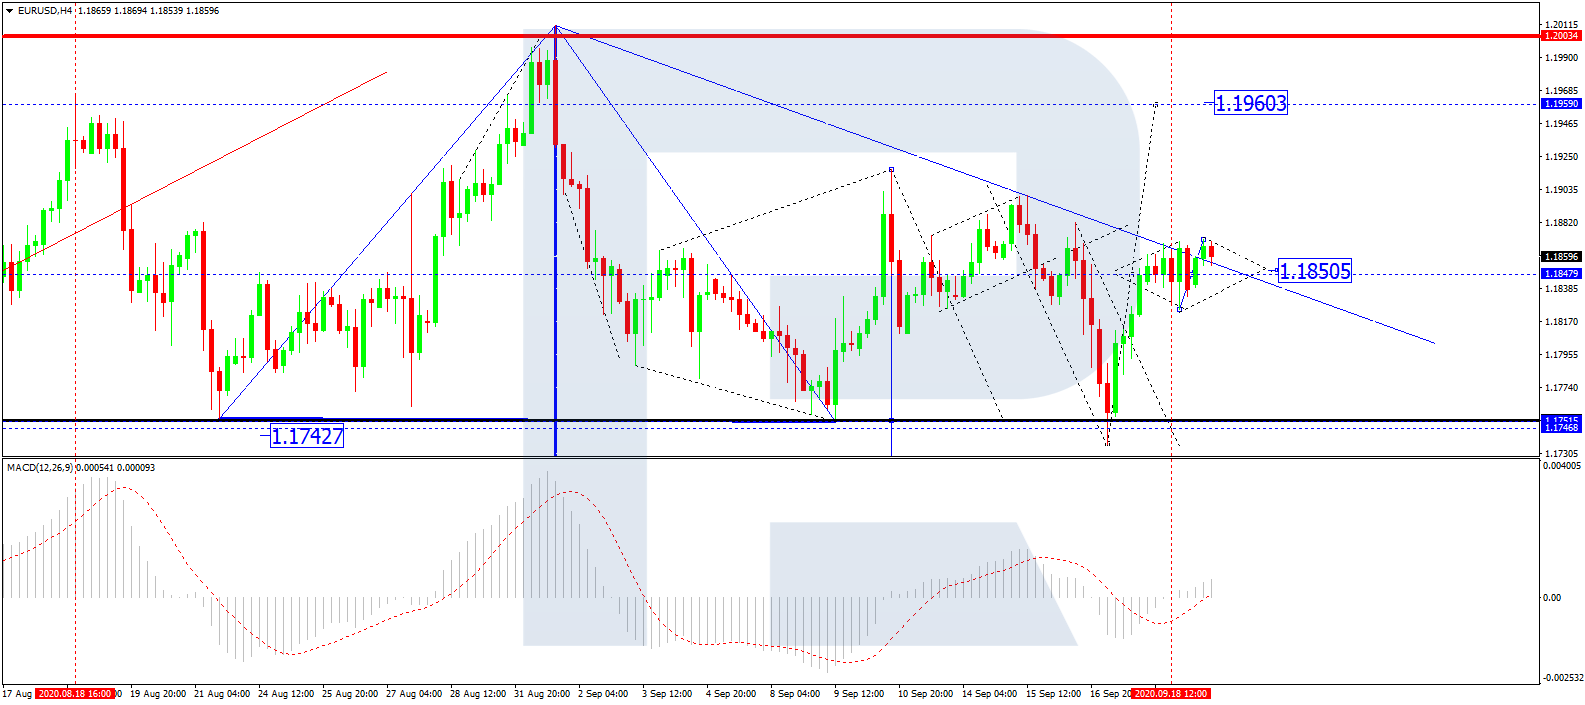
In the H4 chart, EUR/USD is consolidating around 1.1850. If later the price breaks this range to the upside, the market may resume growing to reach 1.1960; if to the downside – start a new decline to break 1.1800 and then continue trading inside the downtrend with the target at 1.1720. From the technical point of view, this scenario is confirmed by MACD Oscillator: after breaking 0 to the downside, its signal line is testing this level from below. If the level is broken to the upside, it may boost the ascending tendency on the price chart. However, if the line rebounds from 0 and enters the histogram area, the asset will continue trading downwards.
Free Reports:
 Get our Weekly Commitment of Traders Reports - See where the biggest traders (Hedge Funds and Commercial Hedgers) are positioned in the futures markets on a weekly basis.
 Sign Up for Our Stock Market Newsletter – Get updated on News, Charts & Rankings of Public Companies when you join our Stocks Newsletter
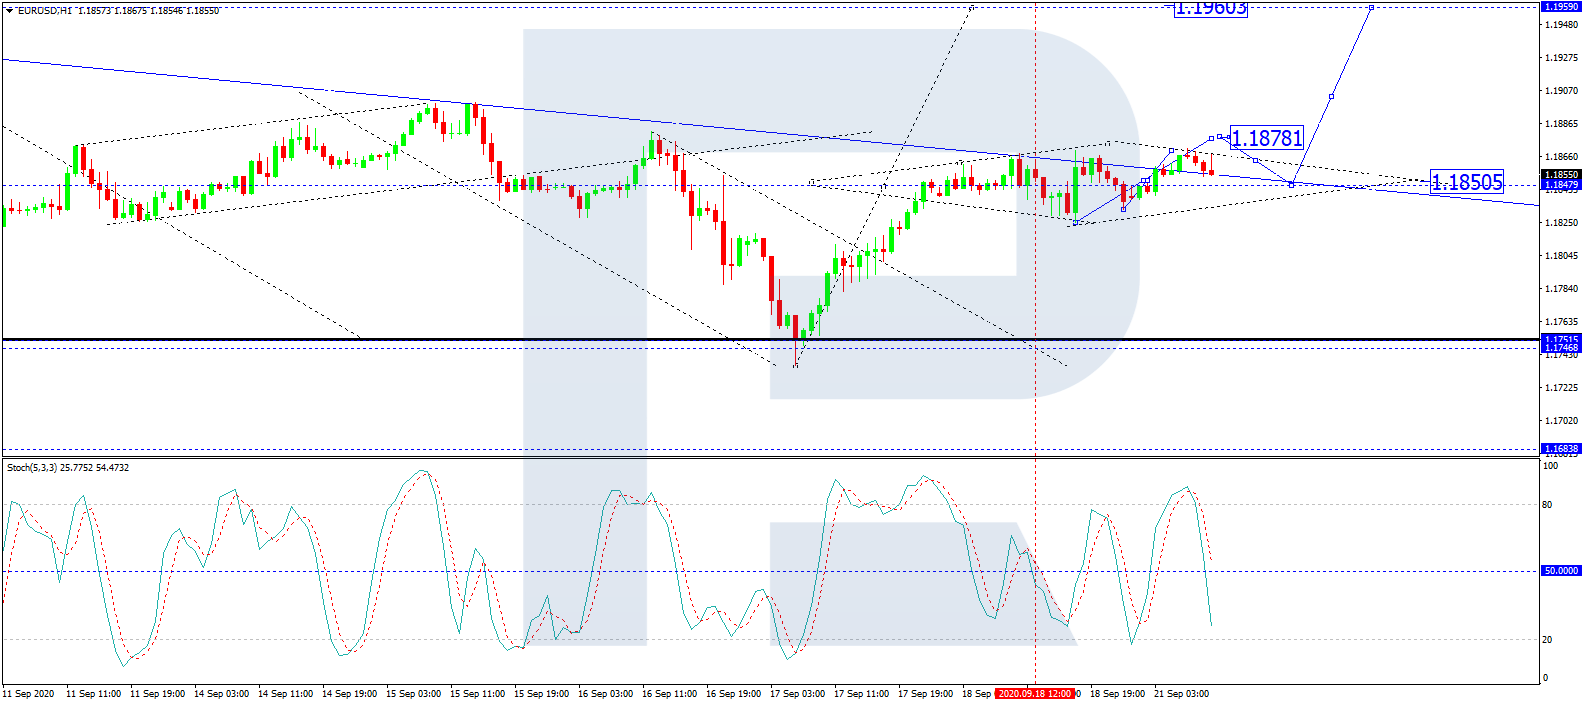
As we can see in the H1 chart, after completing the ascending wave towards the upside border of the range at 1.1866, EUR/USD is expected to rebound from this level and form a new descending structure towards 1.1835. After that, the instrument may resume trading upwards to reach 1.1875. If later the price breaks this level to the upside, the asset may continue growing towards 1.1890. However, if the instrument breaks 1.1820 to the downside, it may resume trading inside the downtrend with the target at 1.1800. From the technical point of view, this scenario is confirmed by Stochastic Oscillator: its signal line is moving towards 50. If this level is broken to the downside, it may continue falling to reach 20. Still, if the line rebounds from 50, it may imply further growth towards 80.
Disclaimer
Any forecasts contained herein are based on the author’s particular opinion. This analysis may not be treated as trading advice. RoboForex bears no responsibility for trading results based on trading recommendations and reviews contained herein.

- Oil prices fall back to pre‑war levels. Silver drops to a 7‑month low Jun 25, 2026
- Gold Falls to an Eight-Month Low: This May Not Be the Bottom Jun 25, 2026
- Stock indices came under heavy selling pressure amid growing skepticism about AI investments Jun 24, 2026
- The Pound Is Pressured Not by Politics, but by a Strong US Dollar Jun 24, 2026
- Global crude oil prices continued to decline. The AUD/USD exchange rate hit an 11‑week low Jun 23, 2026
- EUR/USD Remains Under Sellers’ Control as the Dollar Stays Strong Jun 23, 2026
- Gold Falls for the Third Consecutive Week: Is There Still Upside Potential? Jun 22, 2026
- Bank Indonesia raised its interest rate. Norges Bank and the SNB left rates unchanged Jun 19, 2026
- EUR/USD Loses Ground as Market Sentiment Favours the US Dollar Jun 19, 2026
- GBPUSD Awaits Bank of England Meeting Near April Lows Jun 18, 2026