
Article By RoboForex.com
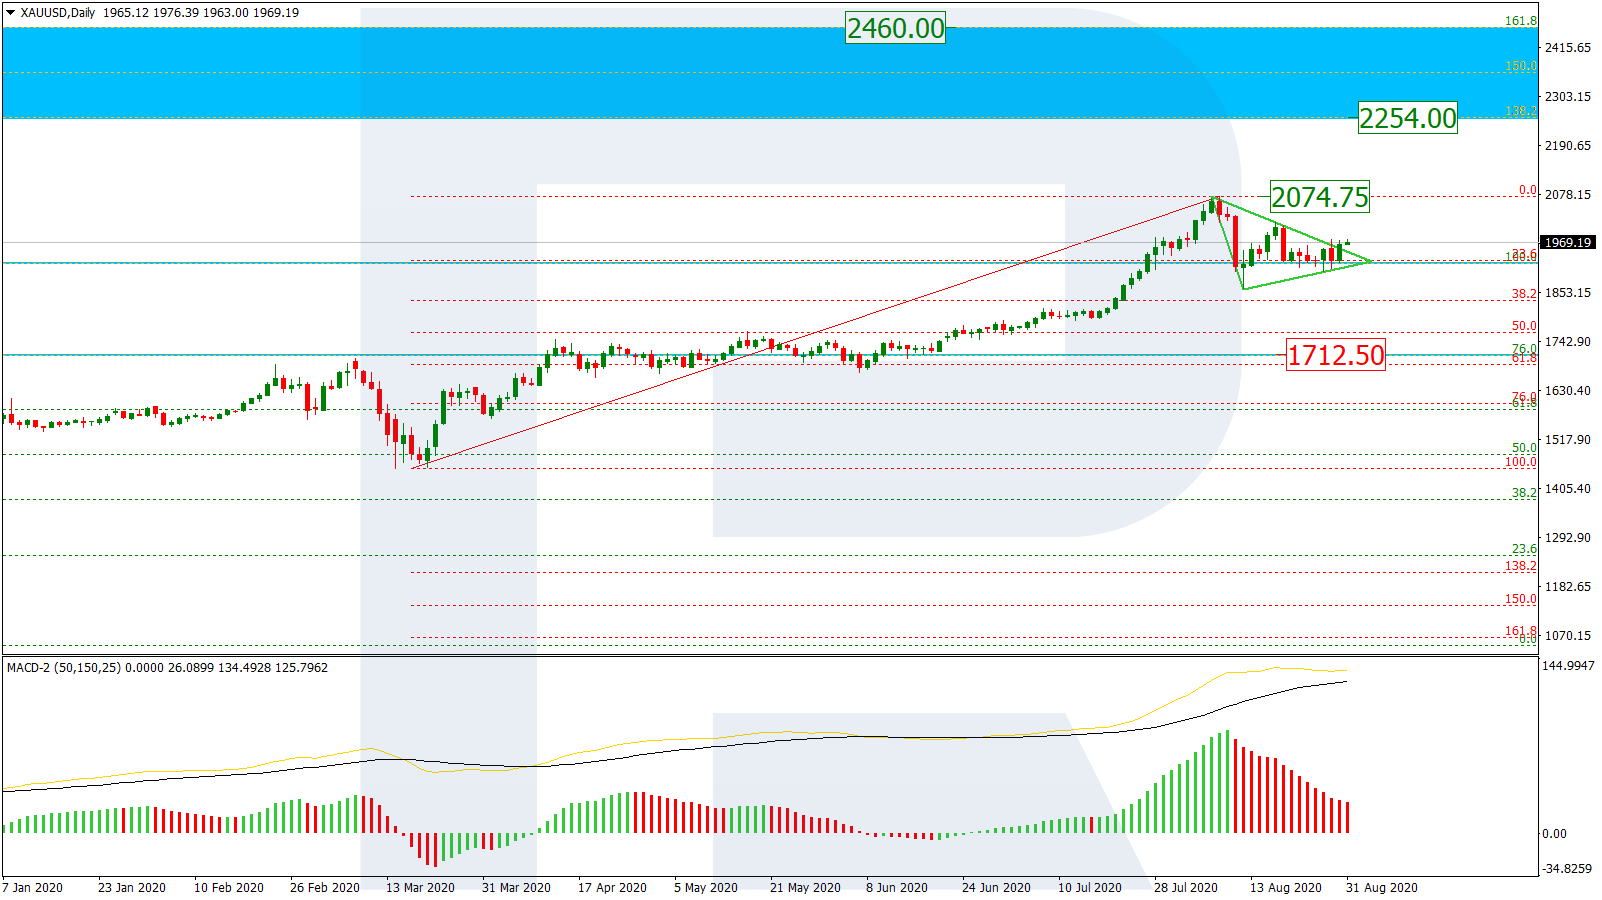
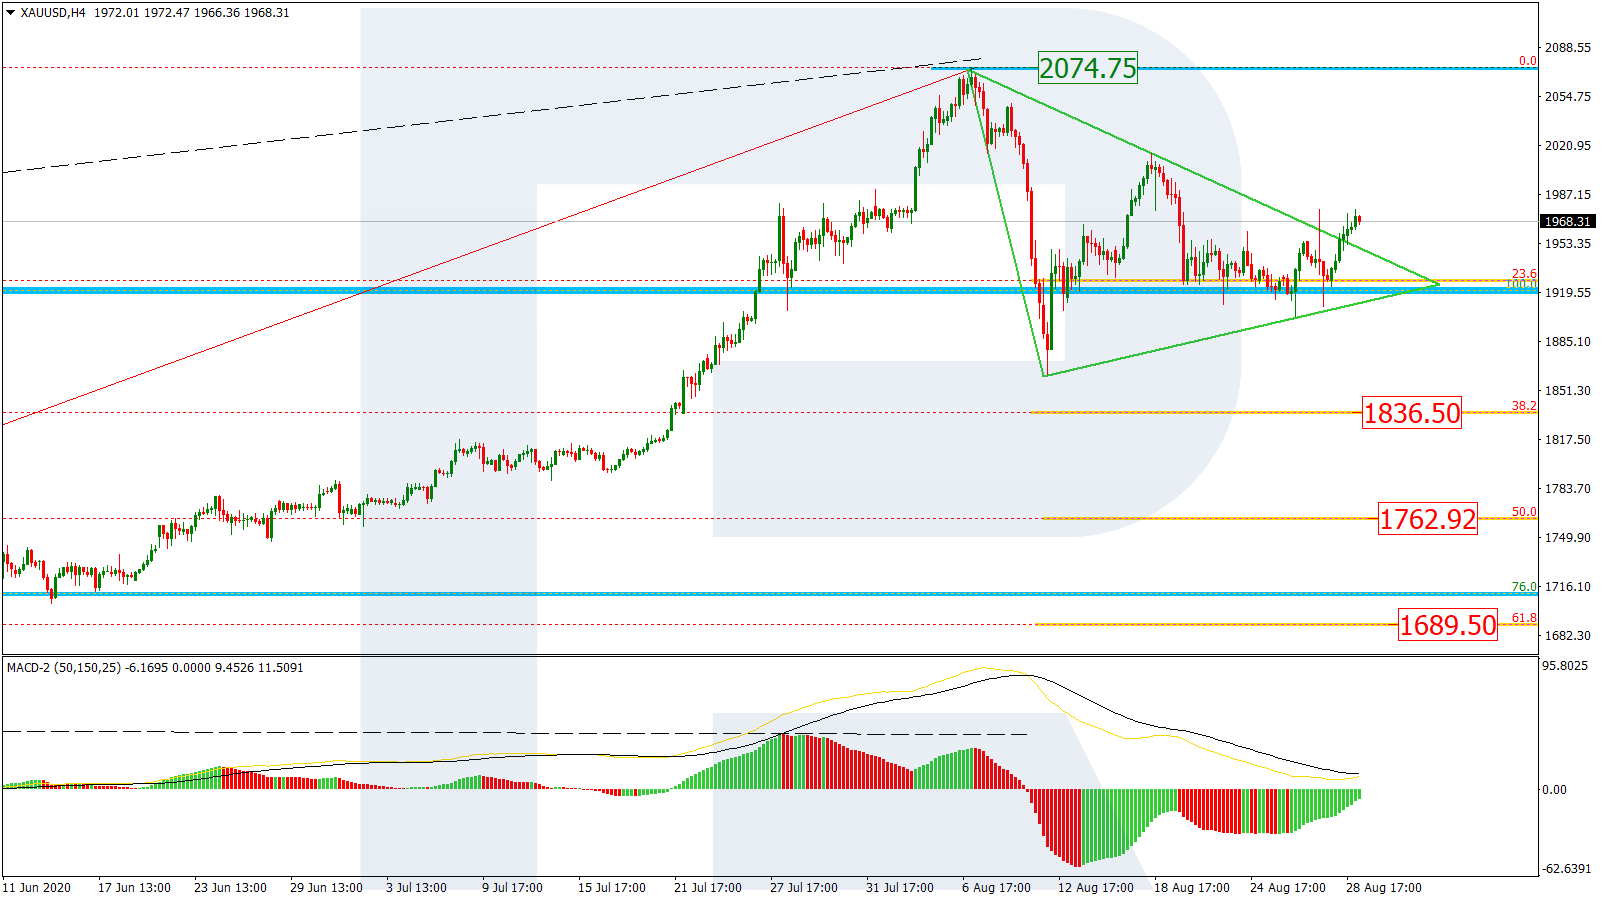
GOLD
On D1, the quotations declined to the previous important level of 1920.66 USD. The correction now looks like a Triangle. The pair may go on declining to 1712.50 USD. After the end of the pullback, the growth will continue in the range between 138.2-161.8% Fibo (2254.00-2460.00 USD).

On H4, the picture of the correctional decline and the Triangle after a divergence is more detailed. The aims of the correction are 23.6% (1836.50 USD) 38.2% (1762.92 USD), and 50.0% Fibo (1689.50 USD). Breaking away the high of 2074.75 USD, the quotations will go on developing the uptrend.
Free Reports:
 Get our Weekly Commitment of Traders Reports - See where the biggest traders (Hedge Funds and Commercial Hedgers) are positioned in the futures markets on a weekly basis.
 Sign Up for Our Stock Market Newsletter – Get updated on News, Charts & Rankings of Public Companies when you join our Stocks Newsletter
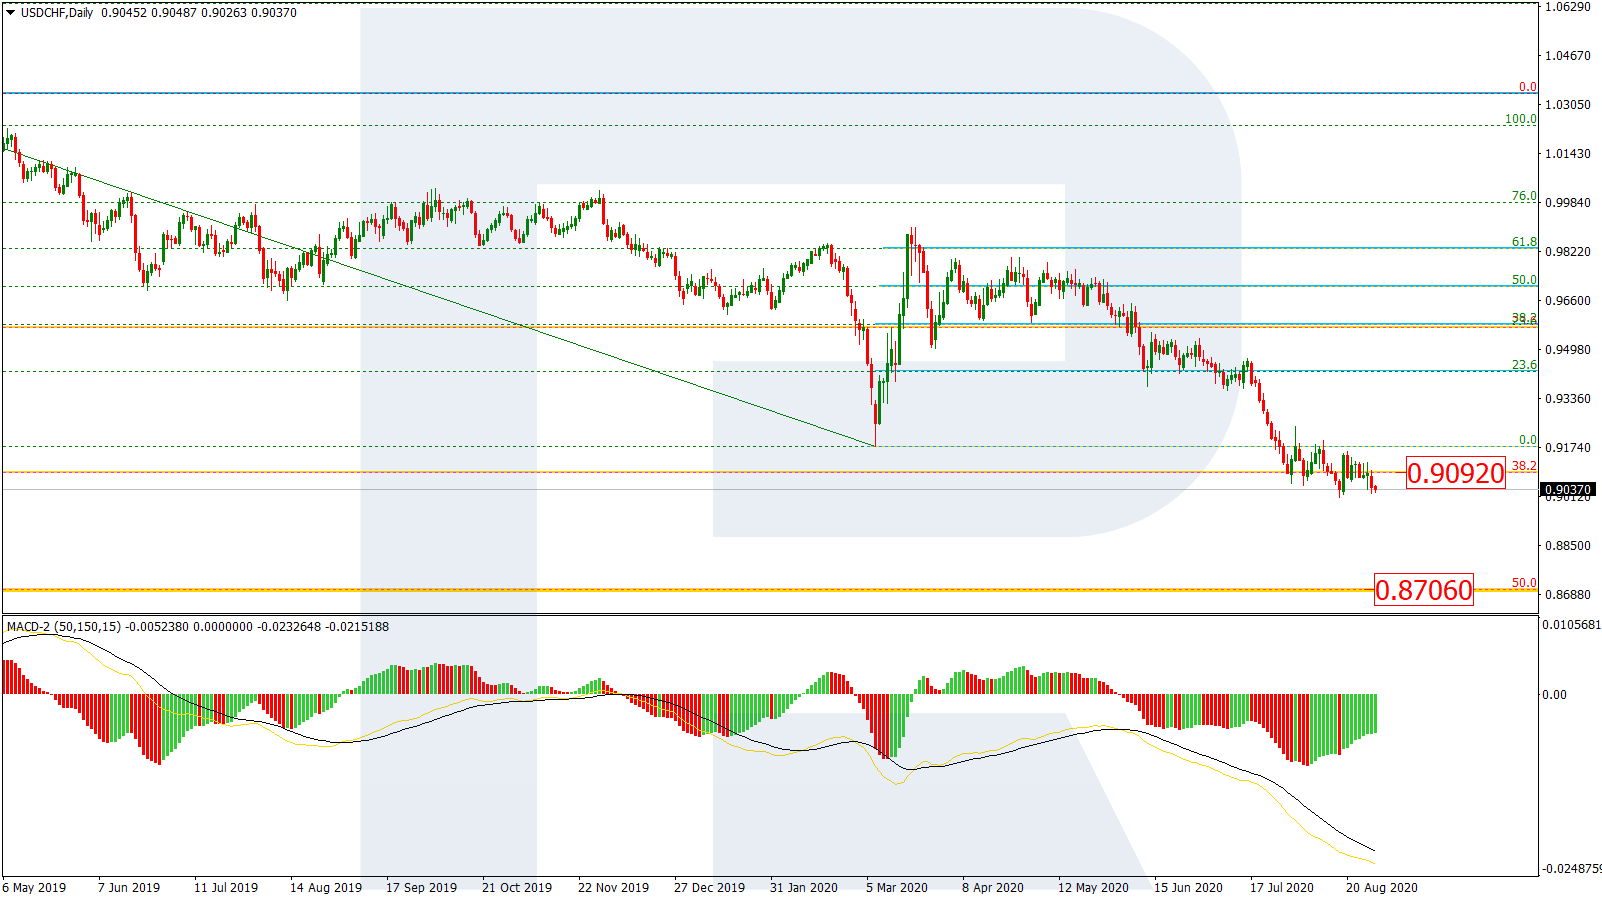
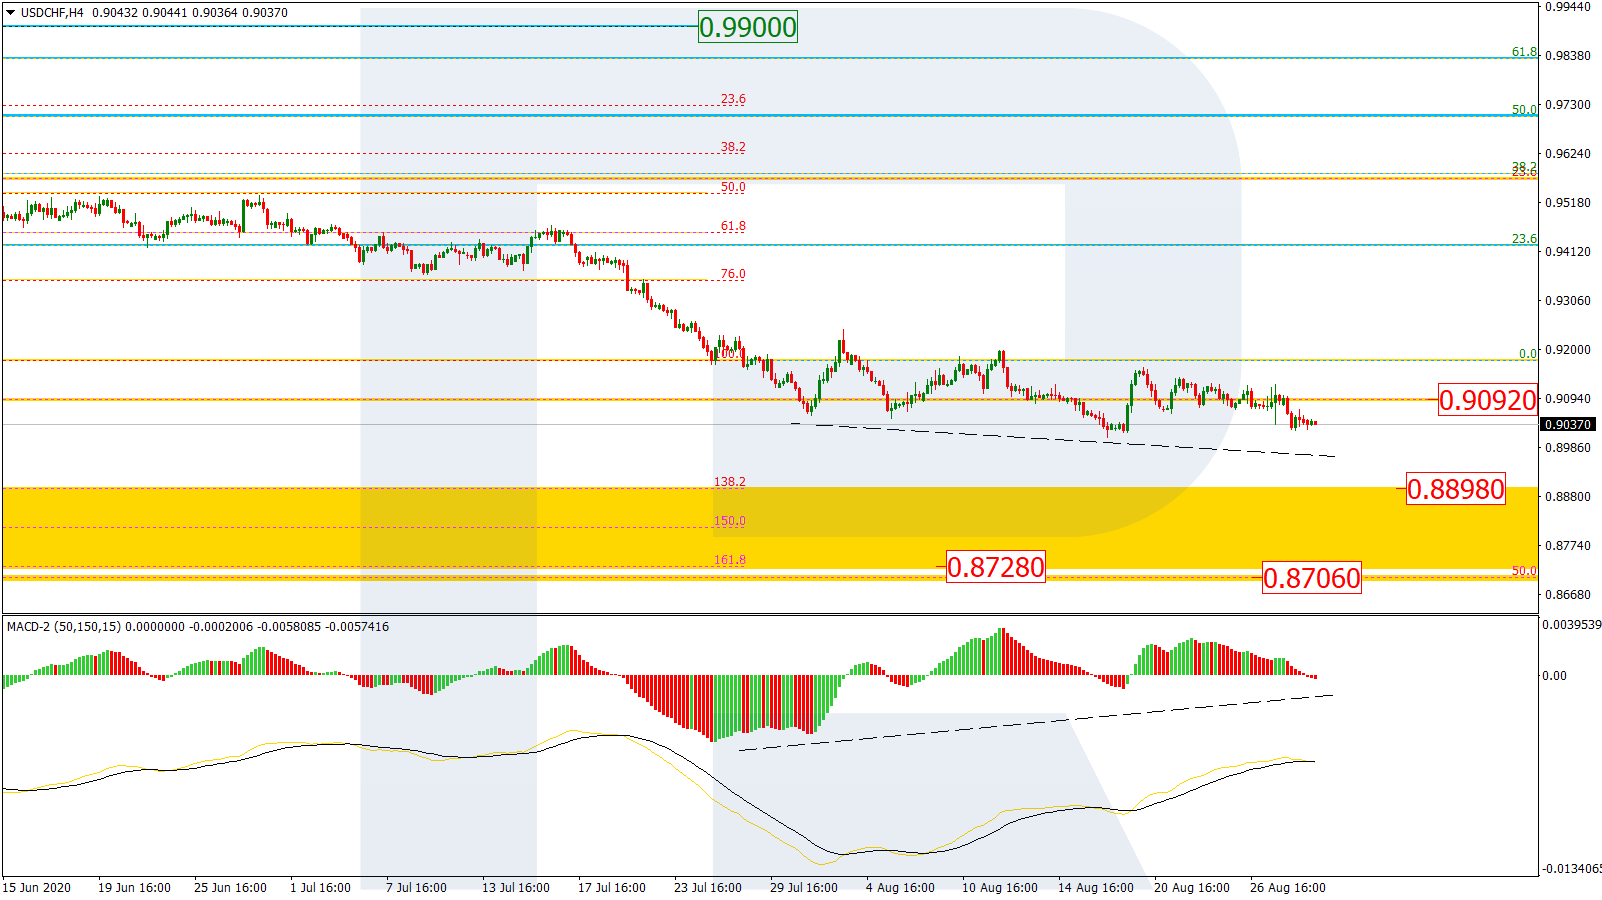
USDCHF
On D1, after a pullback to 61.8% Fibo, another wave of decline engulfed the low and reached the long-term level of 38.2% Fibo (0.9092 USD). Speaking locally and short-termly, the market is expecting a correction. However, after the pullback, the quotations may head for a long-term level of 50.0% Fibo (0.8706 USD).
On H4, the quotations are testing 38.2% Fibo (0.9092 USD) very thoroughly. Further decline qill aim at the post-correctional extension range of 138.2-161.8% Fibo (0.8898-0.8728 USD).
Article By RoboForex.com
Attention!
Forecasts presented in this section only reflect the author’s private opinion and should not be considered as guidance for trading. RoboForex LP bears no responsibility for trading results based on trading recommendations described in these analytical reviews.

- EUR/USD: The Advantage Remains with the Dollar Jun 29, 2026
- Escalation of the US–Iran conflict is once again supporting the rise in oil prices Jun 29, 2026
- Oil prices fall back to pre‑war levels. Silver drops to a 7‑month low Jun 25, 2026
- Gold Falls to an Eight-Month Low: This May Not Be the Bottom Jun 25, 2026
- Stock indices came under heavy selling pressure amid growing skepticism about AI investments Jun 24, 2026
- The Pound Is Pressured Not by Politics, but by a Strong US Dollar Jun 24, 2026
- Global crude oil prices continued to decline. The AUD/USD exchange rate hit an 11‑week low Jun 23, 2026
- EUR/USD Remains Under Sellers’ Control as the Dollar Stays Strong Jun 23, 2026
- Gold Falls for the Third Consecutive Week: Is There Still Upside Potential? Jun 22, 2026
- Bank Indonesia raised its interest rate. Norges Bank and the SNB left rates unchanged Jun 19, 2026