
By Analytical Department RoboForex
Gold declined to 4,600 USD per troy ounce on Monday, extending losses from the previous session. Pressure intensified after Donald Trump issued a new ultimatum to Iran, threatening strikes on energy and civilian infrastructure unless the Strait of Hormuz is reopened.
Trump signalled his readiness to sharply increase pressure and set a new deadline, further heightening tensions in financial markets. Tehran has rejected the demands and continues to target energy facilities in the region.
Since the onset of the conflict, gold has lost approximately 12% of its value. Rising energy prices are amplifying inflation risks and reinforcing expectations of higher interest rates, which limit demand for the metal.
Moreover, gold is not fully fulfilling its traditional role as a safe-haven asset. Some investors are being forced to unwind positions to cover losses in other market segments, adding further downward pressure on prices.
Technical Analysis
Free Reports:
 Download Our Metatrader 4 Indicators – Put Our Free MetaTrader 4 Custom Indicators on your charts when you join our Weekly Newsletter
 Get our Weekly Commitment of Traders Reports - See where the biggest traders (Hedge Funds and Commercial Hedgers) are positioned in the futures markets on a weekly basis.
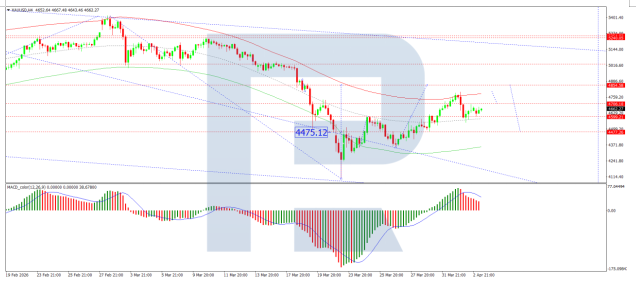
On the H4 XAU/USD chart, the market is forming a consolidation range around 4,599 USD. An upside breakout would open the way for a correction towards 4,854 USD, while a downside breakout could mark the beginning of a new downward wave towards 4,477 USD. The MACD indicator confirms the current momentum, with its signal line above the zero line and pointing firmly upwards.
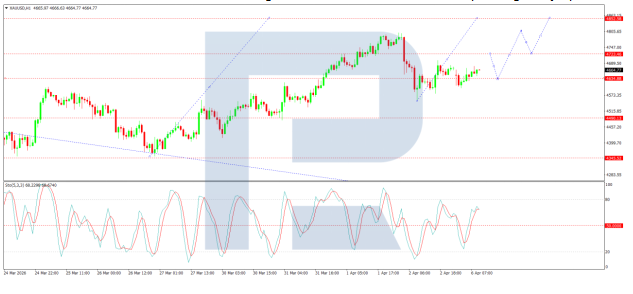
On the H1 chart, the market has broken above 4,636 USD and is forming a wave towards 4,737 USD. Looking ahead, a corrective move back to 4,636 USD is likely, followed by a renewed advance towards 4,852 USD. The Stochastic oscillator supports this scenario, with its signal line above 50 and pointing towards 80.
Conclusion
Gold’s 12% decline since the start of the Middle East conflict highlights a market paradox: escalating geopolitical tensions have failed to support the traditional safe-haven asset. Instead, surging energy prices have intensified inflation concerns, pushing interest rate expectations higher and weighing on the non-yielding metal. Forced liquidation by investors covering losses elsewhere has added to the selling pressure. With Trump issuing a new ultimatum and Tehran rejecting the demands, the conflict shows no signs of easing. While technical indicators suggest scope for a short-term rebound, gold’s broader trajectory remains vulnerable, and further downside cannot be ruled out.
Disclaimer
Any forecasts contained herein are based on the author’s particular opinion. This analysis may not be treated as trading advice. RoboForex bears no responsibility for trading results based on trading recommendations and reviews contained herein.

- COT Metals Charts: Weekly Speculator Bets led by Copper & Steel Jul 18, 2026
- COT Bonds Charts: Weekly Speculator Bets led by 2-Year, SOFR 3M & 5-Year Bonds Jul 18, 2026
- COT Energy Charts: Weekly Speculator Bets led by Brent Oil & Heating Oil Jul 18, 2026
- COT Soft Commodities Charts: Weekly Speculator Bets led by Wheat, Corn & Soybean Meal Jul 18, 2026
- The Bank of Canada kept its interest rate unchanged. Platinum prices reached a three‑week high Jul 16, 2026
- Stock indices rose after the release of US inflation data. China’s GDP slowed sharply Jul 15, 2026
- GBP/USD Awaits Political News: What Will Happen Next Jul 15, 2026
- USD/JPY Holds at Highs: Pressure Lingers on Yen Jul 14, 2026
- Oil prices jumped 4% amid a new wave of escalation between the US and Iran Jul 13, 2026
- EUR/USD: US Inflation Will Determine Everything Jul 13, 2026