
By ForexTime
- FXTM’s USDInd ↑ 2% MTD
- Dollar best performing G10 currency MTD
- Geopolitical risk + US CPI combo = fresh volatility?
- Over past year US CPI decision triggered moves of ↑ 0.2% & ↓ 0.6%
- Technical levels: 98.00, 99.00 and 100.00
Global markets have been thrown into turmoil due to the deepening conflict in the Middle East.
As the confrontation between the US, Israel and Iran rages on, investor sentiment remains fragile with fears intensifying of a wider conflict in the region.
Mounting geopolitical risk and top-tier data could provide fresh trading opportunities in the week ahead:
Monday, 9th March
- CN50: China PPI, CPI
- EUR: Germany industrial production
- TWN: Taiwan trade
Tuesday, 10th March
- AUD: Australia Westpac consumer confidence
- JPY: Japan GDP, money stock
- EUR: EU finance ministers meet in Brussels to discuss policy
- ZAR: South Africa GDP
- Saudi Aramco earnings.
Wednesday, 11th March
Free Reports:
 Download Our Metatrader 4 Indicators – Put Our Free MetaTrader 4 Custom Indicators on your charts when you join our Weekly Newsletter
 Get our Weekly Commitment of Traders Reports - See where the biggest traders (Hedge Funds and Commercial Hedgers) are positioned in the futures markets on a weekly basis.
- EUR: Germany CPI
- JPY: Japan PPI
- USDInd: US CPI, federal budget balance
Thursday, 12th March
- ZAR: South Africa manufacturing production
- USDInd: US housing starts, trade, initial jobless claims
- GBP: BOE Governor Andrew Bailey speech
Friday, 13th June
- CAD: Canada unemployment
- EUR: Eurozone industrial production
- NZD: New Zealand BusinessNZ manufacturing PMI
- GBP: UK industrial production, trade balance
- USDInd: US consumer income, PCE price index, GDP, University of Michigan consumer sentiment
The spotlight shines on FXTM’s USDInd which has surged on safe haven flows as investors scrambled to price in the chaos.
Note: FXTM’s USDInd measures how the dollar performs against a basket of six different G10 currencies, including the Euro, British Pound, Japanese Yen, and Canadian dollar, Swedish krona & Swiss franc.
Here is how they are weighted:
- Euro: 57.6%
- JPY: 13.6%
- GBP: 11.9%
- CAD: 9.1%
- SEK: 4.2%
- CHF: 3.6%
Geopolitical conflict and key US data could spell fresh volatility for the USDInd.
Here are 4 reasons why:
1. US-Israel war with Iran
The ongoing US-Israeli offensive against Iran has jolted financial markets, sparking a wave of risk aversion.
This has sent investors sprinting toward safe-haven destinations, including the US dollar.
- Should the situation worsen and risk spilling over into a wider conflict, the dollar may be boosted further by safe-haven flows.
- Signs of easing tensions may boost the market mood, weakening the dollar as appetite for safe-haven assets cools.
2. US CPI + PCE combo
The latest US inflation reports are likely to shape expectations around the Fed’s future policy moves.
- Wednesday 11th March – US Feb CPI
- CPI year-on-year (Feb 2025 vs. Feb 2026) to rise 2.5%
———————————————————————————————————
- Friday 13th March – US Jan PCE – Fed’s preferred inflation gauge
- Core PCE year-on-year to rise 3.1% from 3.0%.
This week alone, aggressively rising energy prices have raised inflationary fears – forcing markets to push back against bets around lower US rates.
- The USDInd could jump if the incoming inflation reports reveal signs of rising price pressures.
- Any signs of cooling prices pressures may support the argument around lower US rates.
Over the past 12 months, the US CPI has triggered upside moves on the USDInd of as much as 0.2% or declines of 0.6% in a 6-hour window post-release.
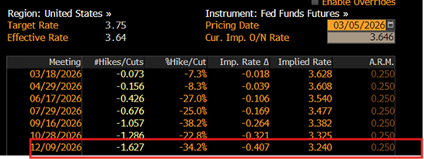
Traders are currently pricing a 60% chance that the Fed cuts rates at least twice in 2025.
3. Europe data dump
A string of key data across Europe including, German industrial production and CPI could influence sentiment toward the European economy and the Euro.
It is worth noting that the EUR makes up roughly 58% of the USDInd weight.
- Stronger than expected data from Europe may weigh on the USDInd as the euro appreciates.
- Disappointing data from Europe could boost the USDInd as the euro weakens.
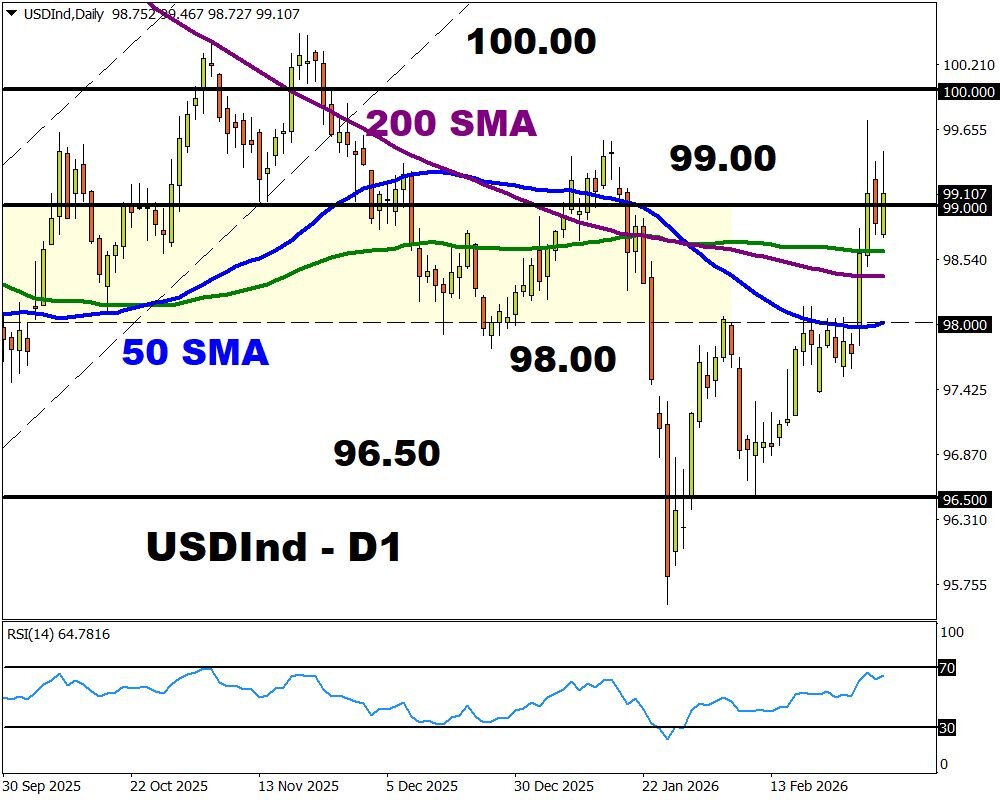
4. Technical forces
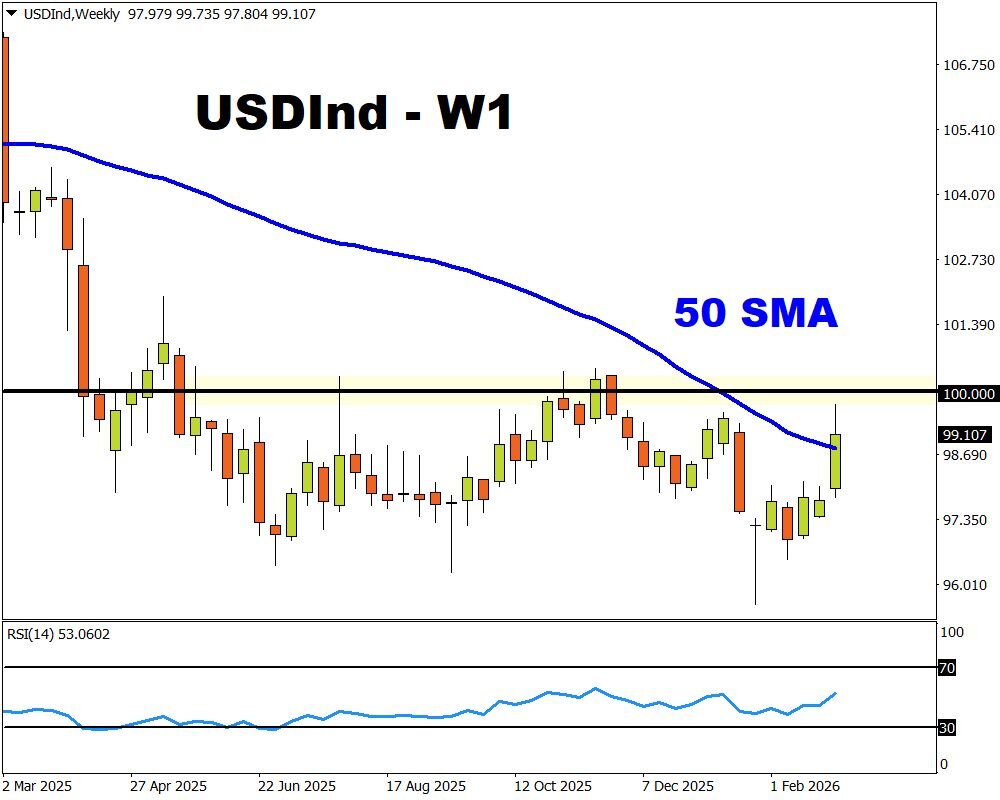
FXTM’s USDInd is pushing higher on the daily charts. However, the Relative Strength Index is close to 70 – signalling that prices are nearly overbought.
- A solid breakout and weekly close above 99.00 could signal a move back toward 100.00 and 100.50.
- Sustained weakness below 99.00 could see price decline back toward the 200-day SMA and the 50-day SMA at 98.00.
![]() Article by ForexTime
Article by ForexTime
ForexTime Ltd (FXTM) is an award winning international online forex broker regulated by CySEC 185/12 www.forextime.com

- Investors run to safe-haven assets amid Middle East escalation Mar 6, 2026
- EUR/USD Under Pressure: Middle East Risks Outweigh All Else Mar 6, 2026
- Bitcoin shows resilience to Middle East events. Oil market stabilizes Mar 5, 2026
- GBP/USD: Market Not Expecting BoE Rate Cut in March Mar 5, 2026
- Brent headed for $100? Mar 4, 2026
- Global stock indices continue sell-off due to Middle East conflict Mar 4, 2026
- USD/JPY to Quickly Return to Growth: Momentum Favours the US Dollar Mar 4, 2026
- European equities plunge amid Persian Gulf military conflict Mar 3, 2026
- Gold Rallies for Fifth Day, With External Risks Mounting Mar 3, 2026
- Iran Crisis: A Dangerous Turning Point Mar 2, 2026