
By RoboForex Analytical Department
Gold on Friday was at 4800 USD per troy ounce. It remains in a vulnerable position after declining 3.8% the day before and is moving towards its second consecutive weekly drawdown. This comes amid high selling pressure.
The correction follows a series of updates to historic highs in January. The rise in prices was initially driven by heightened geopolitical risks, concerns about the Fed’s independence, and speculative demand from China. The tension has since decreased, while the protective attractiveness of gold has diminished. Representatives of Iran and the US confirmed that negotiations are taking place in Oman, and the market is closely following their progress.
An additional factor was weak data on the US labour market. In January, the number of layoffs rose to 108.4 thousand, the maximum for this month since 2009. Initial claims for unemployment benefits rose to 231 thousand, and the ADP report on private-sector employment was weaker than expected. A series of these data has increased expectations of a Fed rate cut later this year. At the same time, the market still considers June as a possible time for the first step.
Technical Analysis
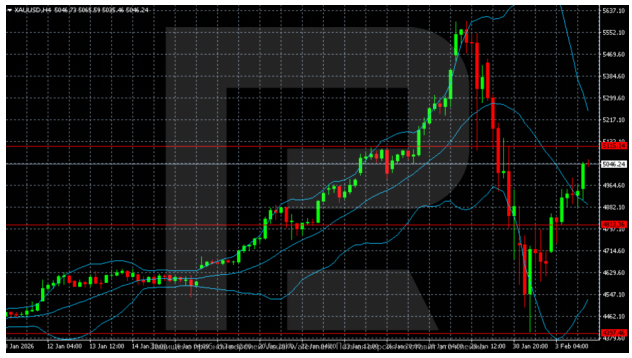
The H4 chart shows completed pulse growth with a peak above 5500, followed by an aggressive correction. The decline went to the 4450–4500 zone. From there, the rebound began. The price moved up to the 5000–5050 area but remains below the key 5100–5150 resistance and the Bollinger median line. The structure indicates a phase of high volatility and redistribution after an overheated uptrend.
Free Reports:
 Get our Weekly Commitment of Traders Reports - See where the biggest traders (Hedge Funds and Commercial Hedgers) are positioned in the futures markets on a weekly basis.
 Sign Up for Our Stock Market Newsletter – Get updated on News, Charts & Rankings of Public Companies when you join our Stocks Newsletter
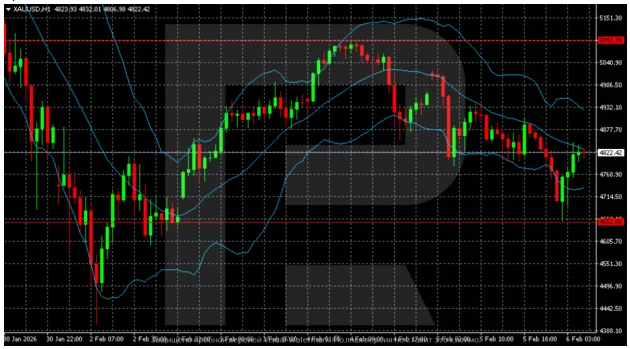
After a sharp collapse, gold on the H1 chart formed a local bottom in the 4650–4700 range and began to recover. The price is back within the Bollinger Bands and is consolidating near the median line at around 4820–4850. The movement looks corrective, volatility is declining, and the balance of power is still neutral.
Conclusion
In summary, gold’s decline reflects a market reassessment, where receding geopolitical fears and a shift towards anticipating Fed easing have removed key pillars of its recent speculative rally. Technically, the sell-off appears to be a volatile but natural correction following an overheated uptrend. While a short-term stabilisation is underway, the price remains vulnerable below critical higher-timeframe resistance. The near-term direction will likely depend on the tone of upcoming US economic data, which will either reinforce or undermine the market’s dovish Fed expectations, and further developments in Middle East diplomacy.
Disclaimer
Any forecasts contained herein are based on the author’s particular opinion. This analysis may not be treated as trading advice. RoboForex bears no responsibility for trading results based on trading recommendations and reviews contained herein.

- Brent headed for $100? Mar 4, 2026
- Global stock indices continue sell-off due to Middle East conflict Mar 4, 2026
- USD/JPY to Quickly Return to Growth: Momentum Favours the US Dollar Mar 4, 2026
- European equities plunge amid Persian Gulf military conflict Mar 3, 2026
- Gold Rallies for Fifth Day, With External Risks Mounting Mar 3, 2026
- Iran Crisis: A Dangerous Turning Point Mar 2, 2026
- Oil prices have seen their largest surge in 4 years amid the military conflict in the Persian Gulf. Mar 2, 2026
- EUR/USD Reacts to Geopolitics and Data: Week Opens Nervously Mar 2, 2026
- US-Iran deal on the brink of collapse. Market prices geopolitical premium into oil Feb 27, 2026
- USD/JPY Declines, but the Overall Outlook for the Yen Remains Hazy Feb 27, 2026