
By RoboForex Analytical Department
Gold is trading around 2,910 USD per troy ounce on Wednesday, pausing after the previous day’s growth. The temporary slowdown comes as rising US Treasury bond yields exert pressure on prices.
Key drivers influencing gold prices
Despite this pause, gold remains near its record highs, supported by strong safe-haven demand amid escalating trade tensions. On Tuesday, the US implemented 25% tariffs on Canada and Mexico and a 10% tariff on China, worsening the global trade climate and triggering retaliatory measures.
US Commerce Secretary Howard Lutnick suggested that tariff reductions for Canada and Mexico may be possible in the future, which has slightly calmed market fears but has not eliminated concerns entirely.
Further bolstering gold’s appeal as a safe-haven asset is the broader geopolitical landscape. The US suspended military aid to Ukraine, while reports emerged suggesting a potential easing of sanctions against Russia. These developments increase uncertainty in global markets, enhancing gold’s attractiveness.
Free Reports:
 Sign Up for Our Stock Market Newsletter – Get updated on News, Charts & Rankings of Public Companies when you join our Stocks Newsletter
 Get our Weekly Commitment of Traders Reports - See where the biggest traders (Hedge Funds and Commercial Hedgers) are positioned in the futures markets on a weekly basis.
In the near term, market participants are awaiting key US economic reports, including the ISM services PMI and employment data. These indicators will provide further clues about the Federal Reserve’s monetary policy direction. Recent data suggests growing economic strains, strengthening the argument for additional rate cuts, which would further support gold prices.
Technical analysis of XAU/USD
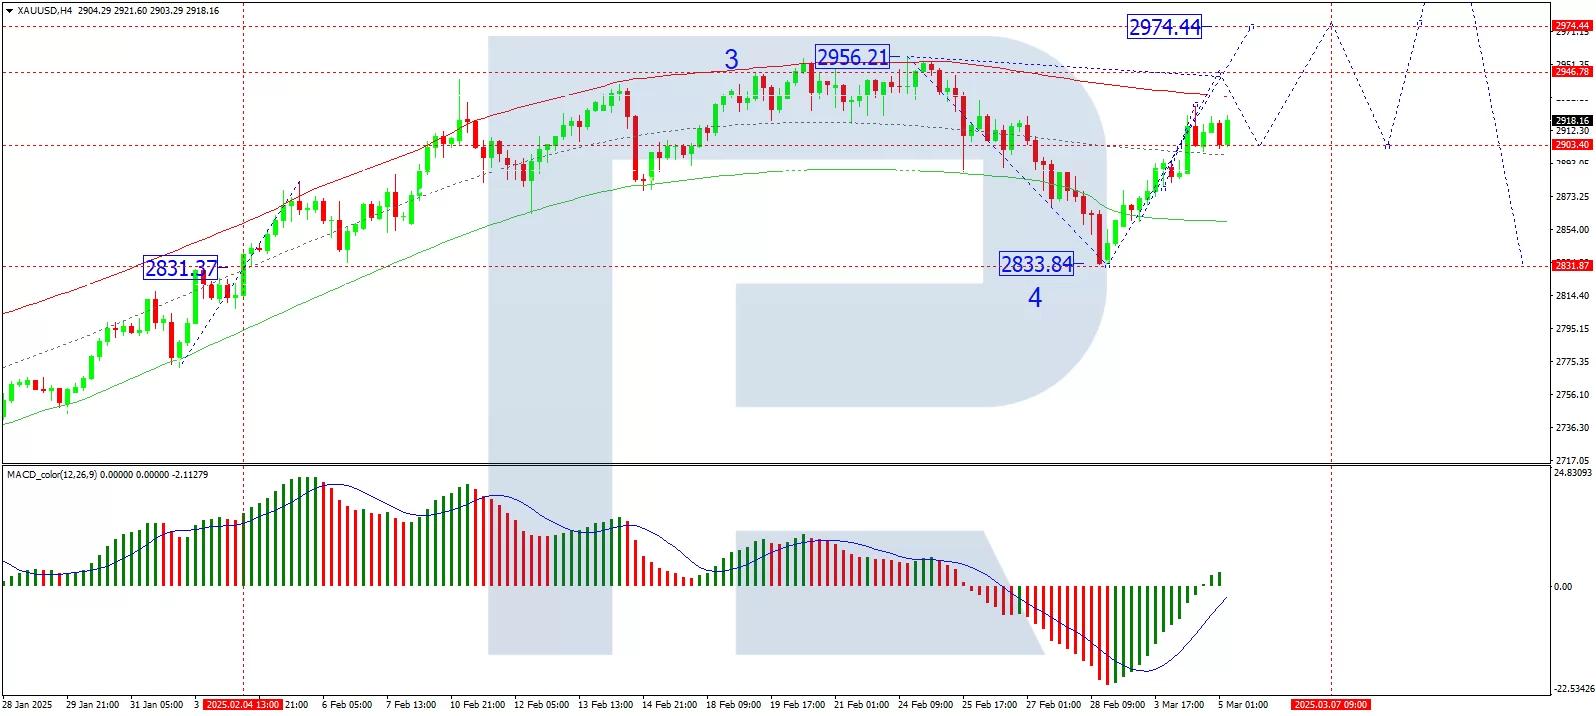
On the H4 chart, XAU/USD has formed a growth wave to 2,900. Currently, the market is consolidating around this level. A breakout to the upside is expected, with a target of 2,974 as the next local resistance level. After reaching this target, a correction towards 2,900 could follow. The MACD indicator confirms this scenario, with its signal line positioned below zero but trending upwards, indicating strong bullish momentum.
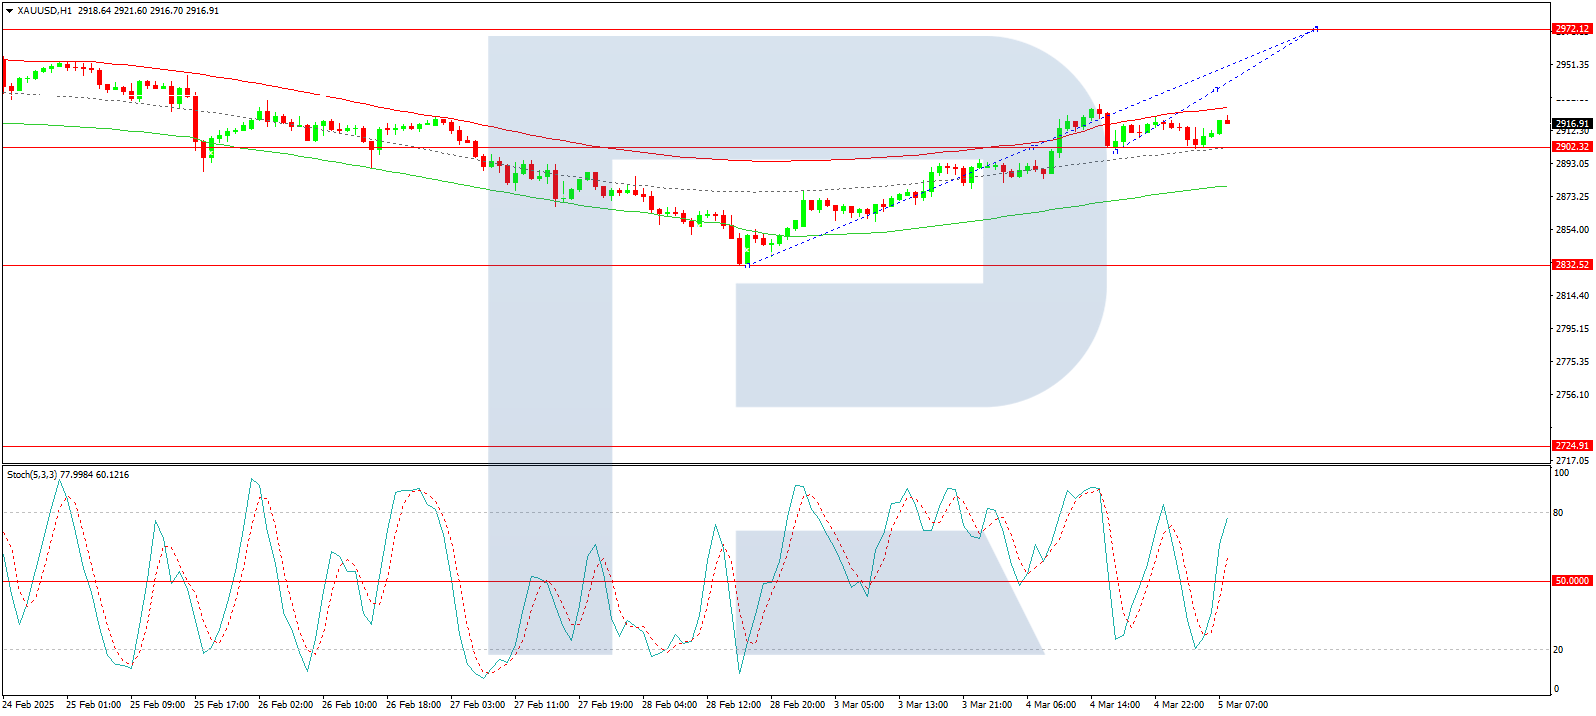
On the H1 chart, gold has already executed a growth wave to 2,900, forming a consolidation range at this level. If the price breaks downward, a correction to 2,880 is possible before another upward impulse begins. A bullish breakout from the consolidation range would open the potential for a direct rally towards 2,974. The Stochastic oscillator supports this view, with its signal line above 50 and pointing towards 80, indicating a continuation of upward momentum.
Conclusion
Gold remains well-supported by trade tensions, geopolitical uncertainties, and expectations of Federal Reserve rate cuts. While a temporary pullback could occur, the broader trend suggests further upside towards 2,974. Market participants should watch upcoming US economic data releases for additional confirmation of gold’s next move.
Disclaimer
Any forecasts contained herein are based on the author’s particular opinion. This analysis may not be treated as trading advice. RoboForex bears no responsibility for trading results based on trading recommendations and reviews contained herein.

- Investors run to safe-haven assets amid Middle East escalation Mar 6, 2026
- EUR/USD Under Pressure: Middle East Risks Outweigh All Else Mar 6, 2026
- Bitcoin shows resilience to Middle East events. Oil market stabilizes Mar 5, 2026
- GBP/USD: Market Not Expecting BoE Rate Cut in March Mar 5, 2026
- Brent headed for $100? Mar 4, 2026
- Global stock indices continue sell-off due to Middle East conflict Mar 4, 2026
- USD/JPY to Quickly Return to Growth: Momentum Favours the US Dollar Mar 4, 2026
- European equities plunge amid Persian Gulf military conflict Mar 3, 2026
- Gold Rallies for Fifth Day, With External Risks Mounting Mar 3, 2026
- Iran Crisis: A Dangerous Turning Point Mar 2, 2026