
By ForexTime
- Bitcoin ↓ 7% on Tuesday, pulling YTD losses to 5%
- Bears exploit Trump tariff fears & industry-related drama
- Over past year US PCE triggered moves of ↑ 4.1% & ↓ 2.5%
- Technical levels: $94,000, $87,000 and 200-day SMA
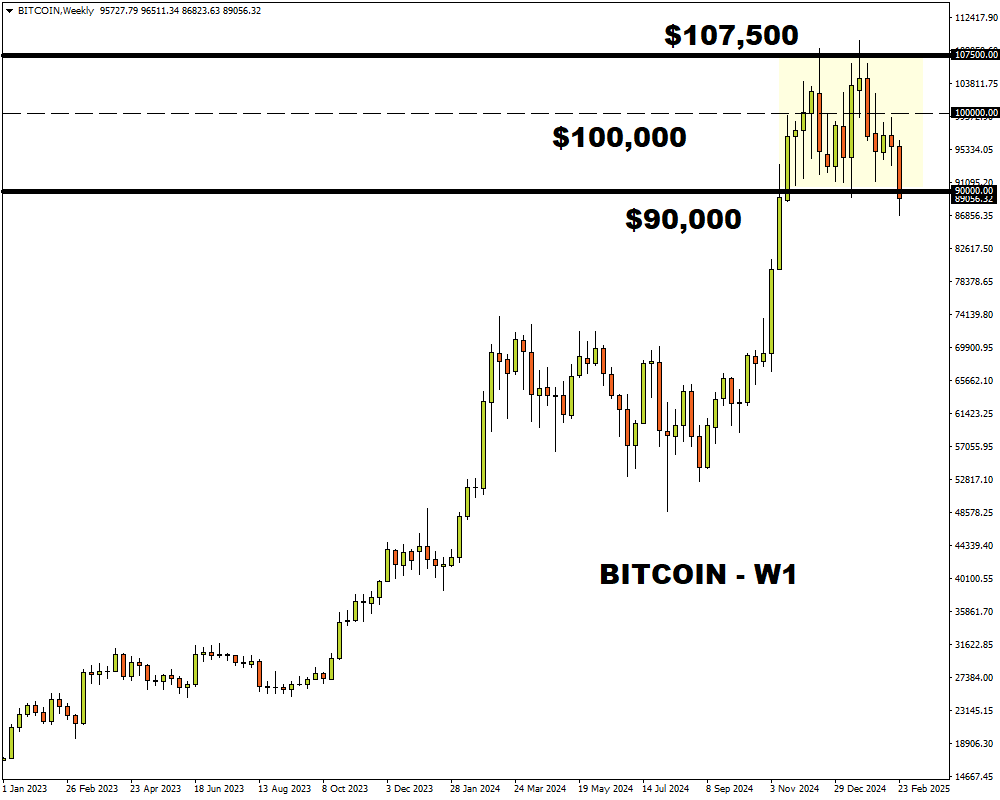
Bitcoin collapsed over 7% on Tuesday, hitting its lowest level since mid-November as a messy cocktail of developments soured investor appetite.
The “OG” crypto cut through the $90,000 weekly support level, dragging year-to-date losses to 5% amid Trump’s tariff fears and a series of industry-specific drama.
Last Friday, cryptocurrency exchange Bybit was hacked – losing $1.5 billion in what could be the biggest crypt theft in history. With investors jittery about the safety of digital-asset platforms, Bitcoin was left vulnerable to heavy losses.
Also weighing on sentiment was the memecoin scandal in mid-February involving Argentina’s President’s $LIBRA token.
All this uncertainty was reflected in the massive $516 million outflows from Bitcoin ETFs on Monday.
More losses could be on the cards for Bitcoin if the market mood fails to improve.
Free Reports:
 Sign Up for Our Stock Market Newsletter – Get updated on News, Charts & Rankings of Public Companies when you join our Stocks Newsletter
 Get our Weekly Commitment of Traders Reports - See where the biggest traders (Hedge Funds and Commercial Hedgers) are positioned in the futures markets on a weekly basis.
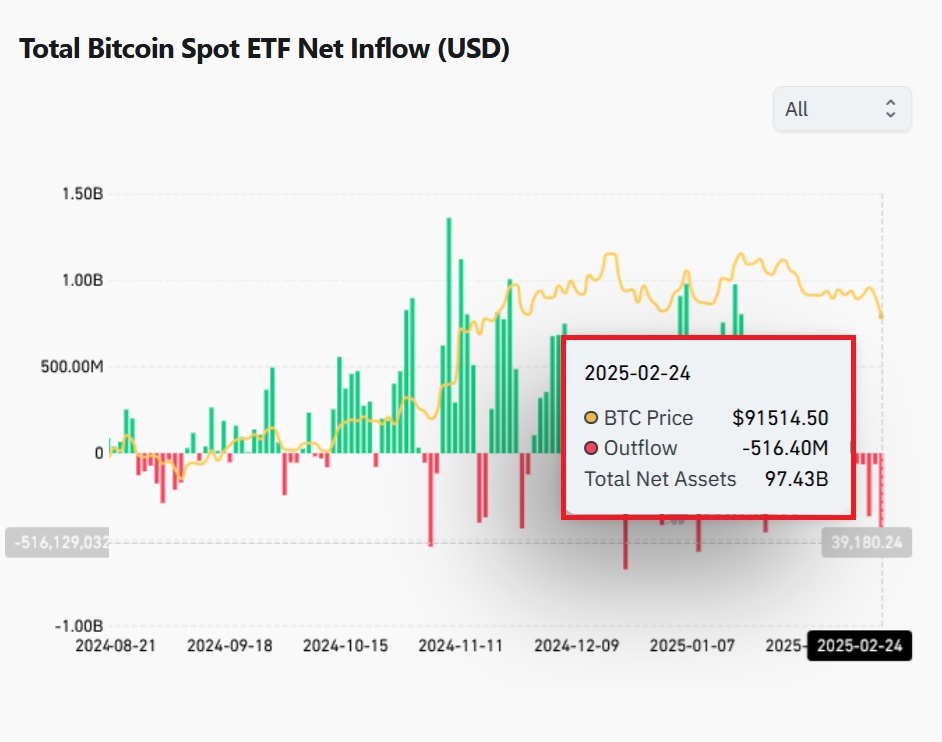
Source: Coinglass
On the macro front, incoming US data and Fed speeches may trigger fresh volatility for Bitcoin but to its sensitivity to interest rates.
Note: Traders are currently pricing in a 33% probability of a 25bp rate cut by May with this jumping to 83% by June.
- Thursday 27th February: US Q4 GDP (second estimate), initial weekly jobless claims, speeches by Fed officials.
- Friday 28th February: US January PCE, speech by Chicago Fed President Austan Goolsbee.
Over the past year, the US PCE report has triggered upside moves of as much as 4.1% or declines of 2.5% in a 6-hour window post-release.
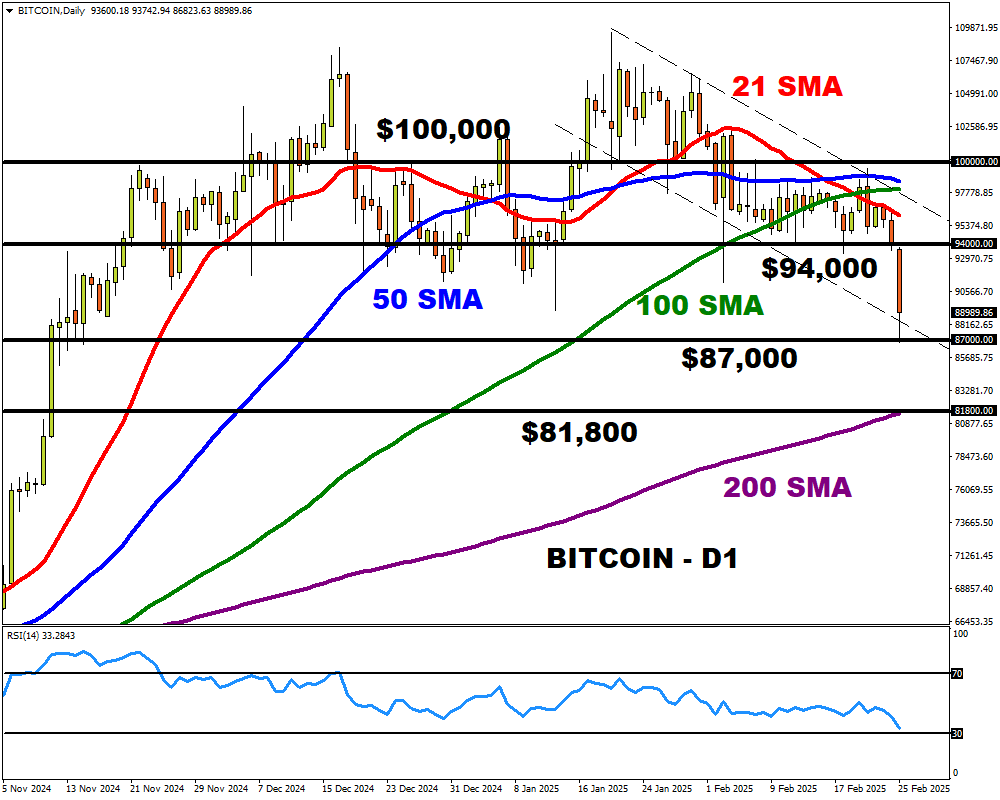
Technical outlook
Prices are under pressure on the daily charts, trading below the 21, 50 and 100-day SMA.
- Should $87,000 prove to be reliable support, this may trigger a rebound back toward $94,000.
- A breakdown below $87,000 may open a path toward the 200-day SMA at $81,800.


![]() Article by ForexTime
Article by ForexTime
ForexTime Ltd (FXTM) is an award winning international online forex broker regulated by CySEC 185/12 www.forextime.com

- Bitcoin shows resilience to Middle East events. Oil market stabilizes Mar 5, 2026
- GBP/USD: Market Not Expecting BoE Rate Cut in March Mar 5, 2026
- Brent headed for $100? Mar 4, 2026
- Global stock indices continue sell-off due to Middle East conflict Mar 4, 2026
- USD/JPY to Quickly Return to Growth: Momentum Favours the US Dollar Mar 4, 2026
- European equities plunge amid Persian Gulf military conflict Mar 3, 2026
- Gold Rallies for Fifth Day, With External Risks Mounting Mar 3, 2026
- Iran Crisis: A Dangerous Turning Point Mar 2, 2026
- Oil prices have seen their largest surge in 4 years amid the military conflict in the Persian Gulf. Mar 2, 2026
- EUR/USD Reacts to Geopolitics and Data: Week Opens Nervously Mar 2, 2026