
By RoboForex Analytical Department
Gold prices have risen for four consecutive days, reaching 2,660 USD per troy ounce by Friday. The upward movement in Gold prices is primarily driven by the weakening of the US dollar and heightened geopolitical tensions. The current state of the currency market, characterised by low liquidity due to the extended US holiday weekend starting with Thanksgiving, also contributes to Gold’s price behaviour.
Despite this recent appreciation, Gold faces potential headwinds and could experience a 2% decline by the week’s end as investors await further data from the US. The upcoming statistics are anticipated to provide additional insights into the Federal Reserve’s monetary direction on monetary policy. While the Core PCE data suggests a rate cut in December is plausible, other economic indicators point to the continued robustness of the US economy. This may lead the Fed to maintain its cautious approach to interest rates in 2025.
The relationship between the US dollar and Gold is crucial, as they typically move inversely. Gold, which does not generate its yield, tends to perform well when the dollar and US Treasury bond yields are lower.
Technical analysis of XAU/USD
Free Reports:
 Download Our Metatrader 4 Indicators – Put Our Free MetaTrader 4 Custom Indicators on your charts when you join our Weekly Newsletter
 Get our Weekly Commitment of Traders Reports - See where the biggest traders (Hedge Funds and Commercial Hedgers) are positioned in the futures markets on a weekly basis.
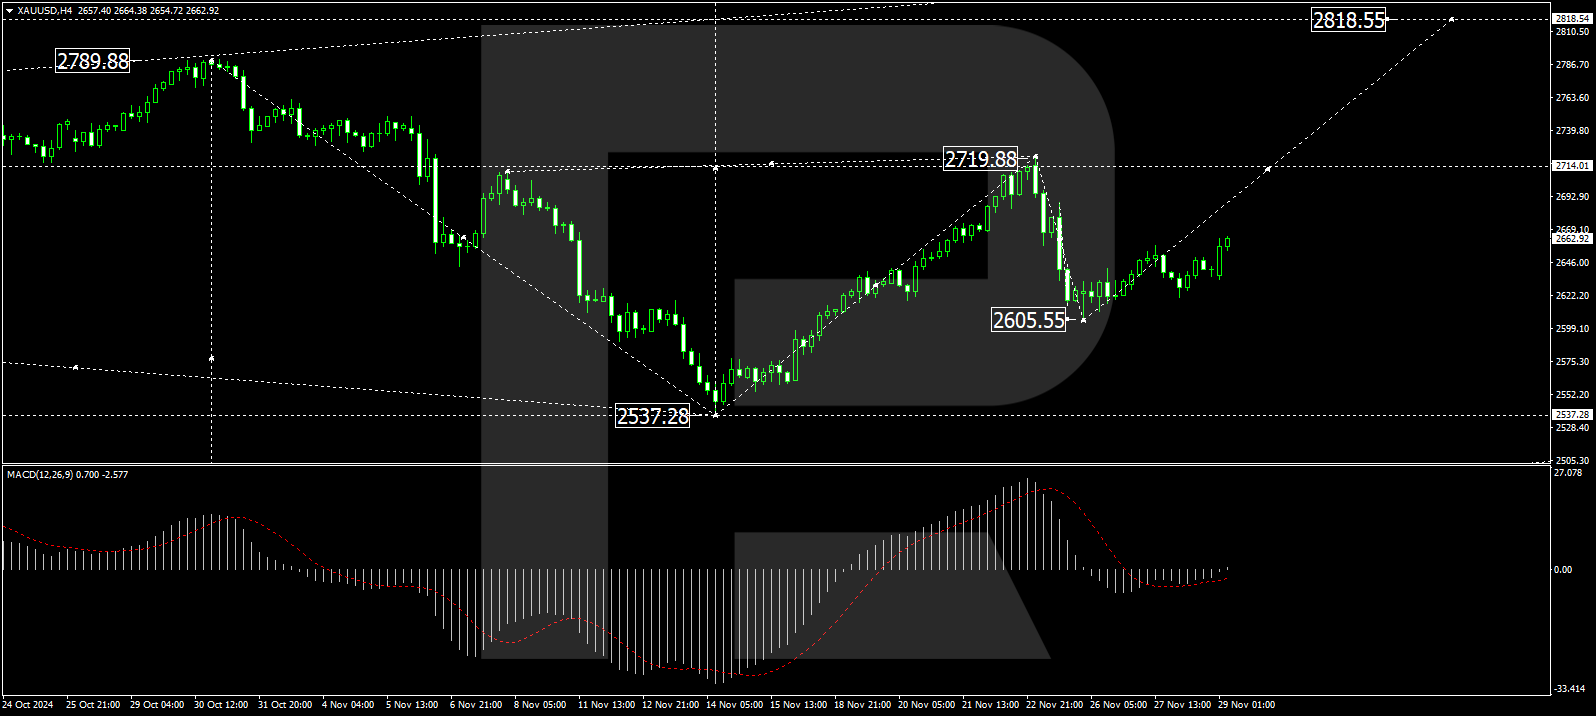
On the H4 chart, XAU/USD has completed a corrective wave at 2,605.55 and is now poised for further growth towards 2,715.00. When this level is reached, a consolidation phase around 2,715.00 may occur, potentially leading to a continued upward trajectory towards 2,818.55. The MACD indicator supports this bullish XAU/USD outlook, with its signal line below zero but rising sharply.
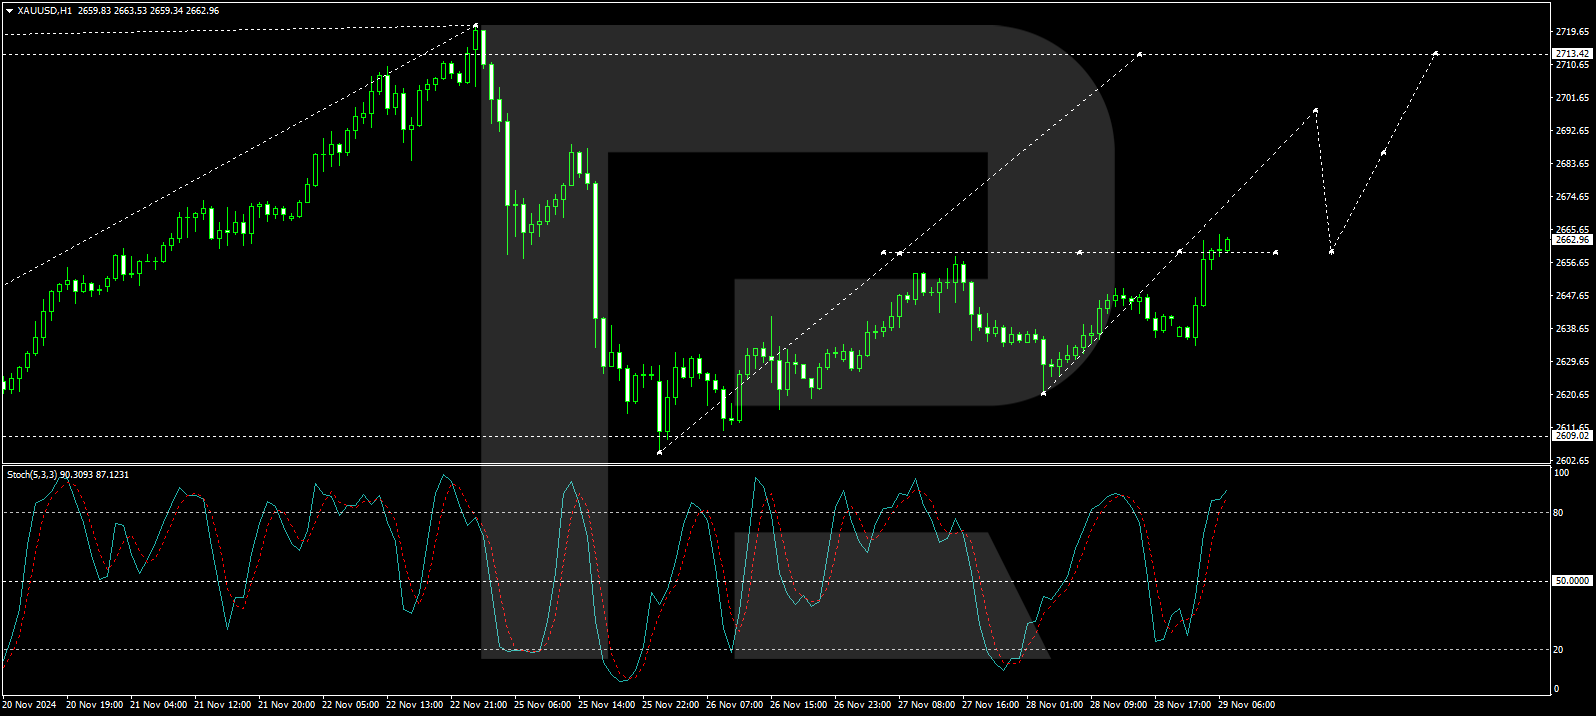
The H1 chart shows that Gold has completed an initial growth structure to 2,658.88 and a subsequent correction to 2,622.00. Currently, a new growth phase targeting 2,698.00 is underway. Upon reaching this target, a pullback to 2,658.88 may occur before the market attempts to achieve a higher level of 2,715.00. This outlook is corroborated by the Stochastic oscillator, whose signal line is above 50 and climbing towards 80, indicating the potential for further upward movement.
Disclaimer
Any forecasts contained herein are based on the author’s particular opinion. This analysis may not be treated as trading advice. RoboForex bears no responsibility for trading results based on trading recommendations and reviews contained herein.

- EUR/USD: Busy Week Ahead Aug 3, 2026
- Positive sentiment in the AI sector supported stock indices. Oil prices remain volatile Aug 3, 2026
- The Tech‑heavy NASDAQ Index jumped by more than 3.3%. The offshore yuan is trading at its highest level since 2023 Jul 31, 2026
- USD/JPY After Volatility: Multiple Events in One Day Jul 31, 2026
- The US indices sell off amid renewed US-Iran clashes. Oil jumps by 7% Jul 30, 2026
- USD/JPY Temporary in Equilibrium: Multiple Factors in Focus Jul 30, 2026
- GBP/USD at Month’s Lows: The Outlook Remains Weak Jul 29, 2026
- Crude oil falls below $80 per barrel. Australia sees inflation slowdown Jul 29, 2026
- The US Tech sector hit by sell‑off. Oil prices decline on renewed negotiations Jul 28, 2026
- Gold Declines, Focus on Fed and Falling Oil Prices Jul 28, 2026
