
By RoboForex Analytical Department
The AUD/USD pair fell to 0.6566 on Friday, marking its lowest since early August. The US dollar continued to strengthen last night, bolstered by signs of resilience in the US economy. Additionally, investors hold significant expectations for Donald Trump’s success in the upcoming presidential election next week.
Meanwhile, an unexpected improvement in Chinese manufacturing activity provided noticeable support for the Aussie. Given that China is Australia’s key trade and economic partner, the Australian dollar is highly responsive to developments in China.
Annual inflation in Australia eased to 3.5% in Q3 but remains above the Reserve Bank of Australia’s target range of 2.0-3.0%. Producer prices rose more than expected in the third quarter, while retail sales declined in September. These mixed signals are keeping the Aussie under pressure.
Baseline expectations suggest the Reserve Bank of Australia will leave the interest rate unchanged at 4.35% at its meeting next week.
Technical analysis of AUD/USD
Free Reports:
 Download Our Metatrader 4 Indicators – Put Our Free MetaTrader 4 Custom Indicators on your charts when you join our Weekly Newsletter
 Get our Weekly Commitment of Traders Reports - See where the biggest traders (Hedge Funds and Commercial Hedgers) are positioned in the futures markets on a weekly basis.
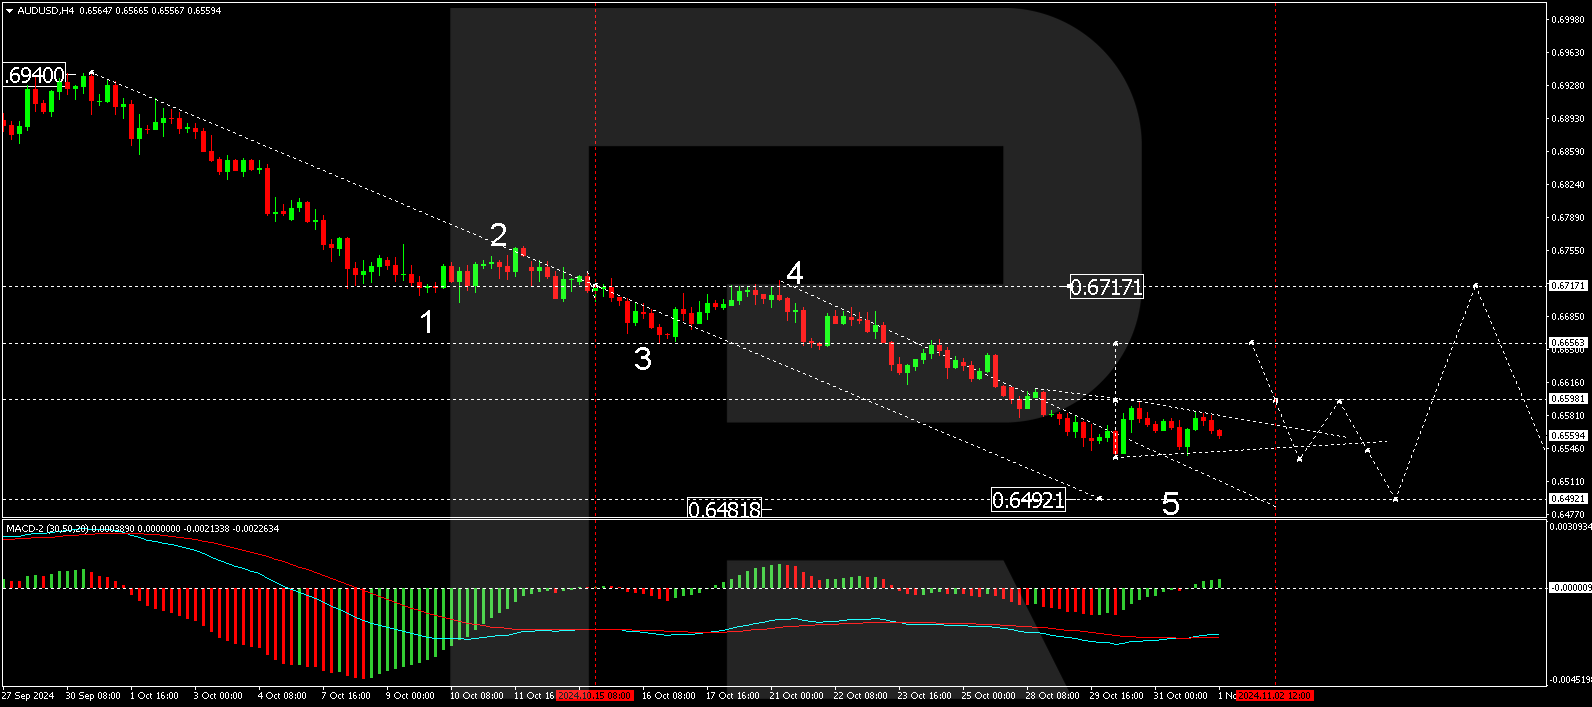
On the H4 chart, the AUD/USD market completed a wave of decline to 0.6536. Today, the market is forming a consolidation range above this level. An upward breakout would signal the development of a growth wave towards 0.6656, viewed as a correction to the previous downtrend. Once this correction is completed, we may see a new decline towards 0.6492. Technically, this scenario is supported by the MACD indicator, with its signal line below zero near the lows and preparing to turn upwards.
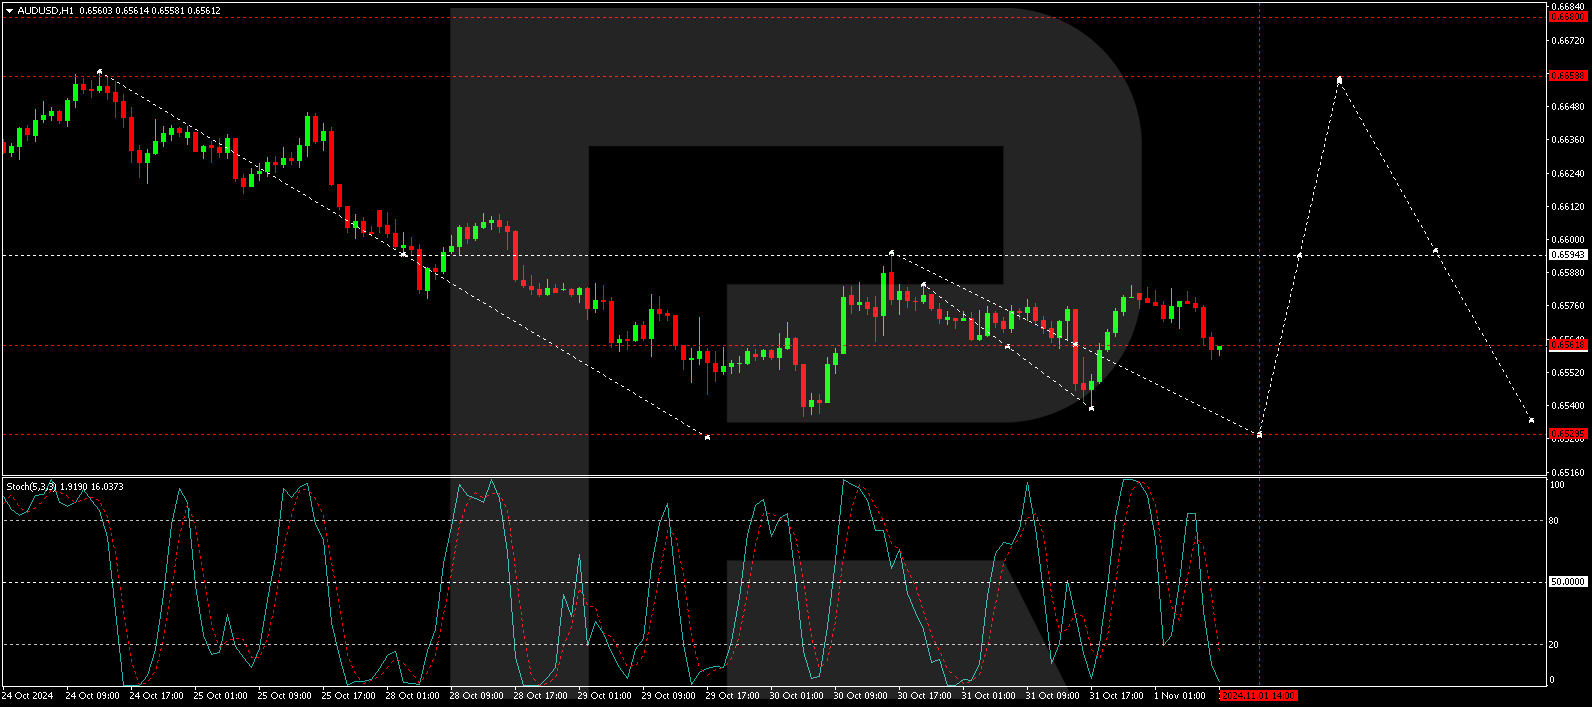
On the H1 chart, the AUD/USD market has formed a consolidation range around 0.6561, with a potential extension towards 0.6530. After this, we may see the beginning of an upward wave targeting 0.6655 as the first objective. This growth structure is expected to be part of a broader correction. Technically, this scenario is also confirmed by the Stochastic oscillator, with its signal line below the 20 mark and preparing to rise towards 80.
Disclaimer
Any forecasts contained herein are based on the author’s particular opinion. This analysis may not be treated as trading advice. RoboForex bears no responsibility for trading results based on trading recommendations and reviews contained herein.

- Investors run to safe-haven assets amid Middle East escalation Mar 6, 2026
- EUR/USD Under Pressure: Middle East Risks Outweigh All Else Mar 6, 2026
- Bitcoin shows resilience to Middle East events. Oil market stabilizes Mar 5, 2026
- GBP/USD: Market Not Expecting BoE Rate Cut in March Mar 5, 2026
- Brent headed for $100? Mar 4, 2026
- Global stock indices continue sell-off due to Middle East conflict Mar 4, 2026
- USD/JPY to Quickly Return to Growth: Momentum Favours the US Dollar Mar 4, 2026
- European equities plunge amid Persian Gulf military conflict Mar 3, 2026
- Gold Rallies for Fifth Day, With External Risks Mounting Mar 3, 2026
- Iran Crisis: A Dangerous Turning Point Mar 2, 2026